Energy & Commodities
EIA April STEO in 2026: Hormuz Stress, Fuel Prices, and LNG Capacity
A 2026 EIA April STEO review focused on Hormuz shut-ins, fuel-price resets, Brent spreads, and U.S. LNG export-capacity limits.
(Source: U.S. Energy Information Administration, Short-Term Energy Outlook, April 2026)
Thesis
The most important thing about the EIA's April 2026 Short-Term Energy Outlook is that it is not a simple directional oil call. It is a structured stress scenario built around a temporary but severe Strait of Hormuz disruption, and that assumption changes almost every major line item in the report.
Related reading: Crude Oil in 2026: Release Cadence, Inflation Path, and Energy-Stock Risk | ChatGPT, Gemini, and Claude in 2026: Evidence Discipline Before Stock Claims | U.S. Stock Investing in 2026: Broker Checks Before Stock Selection
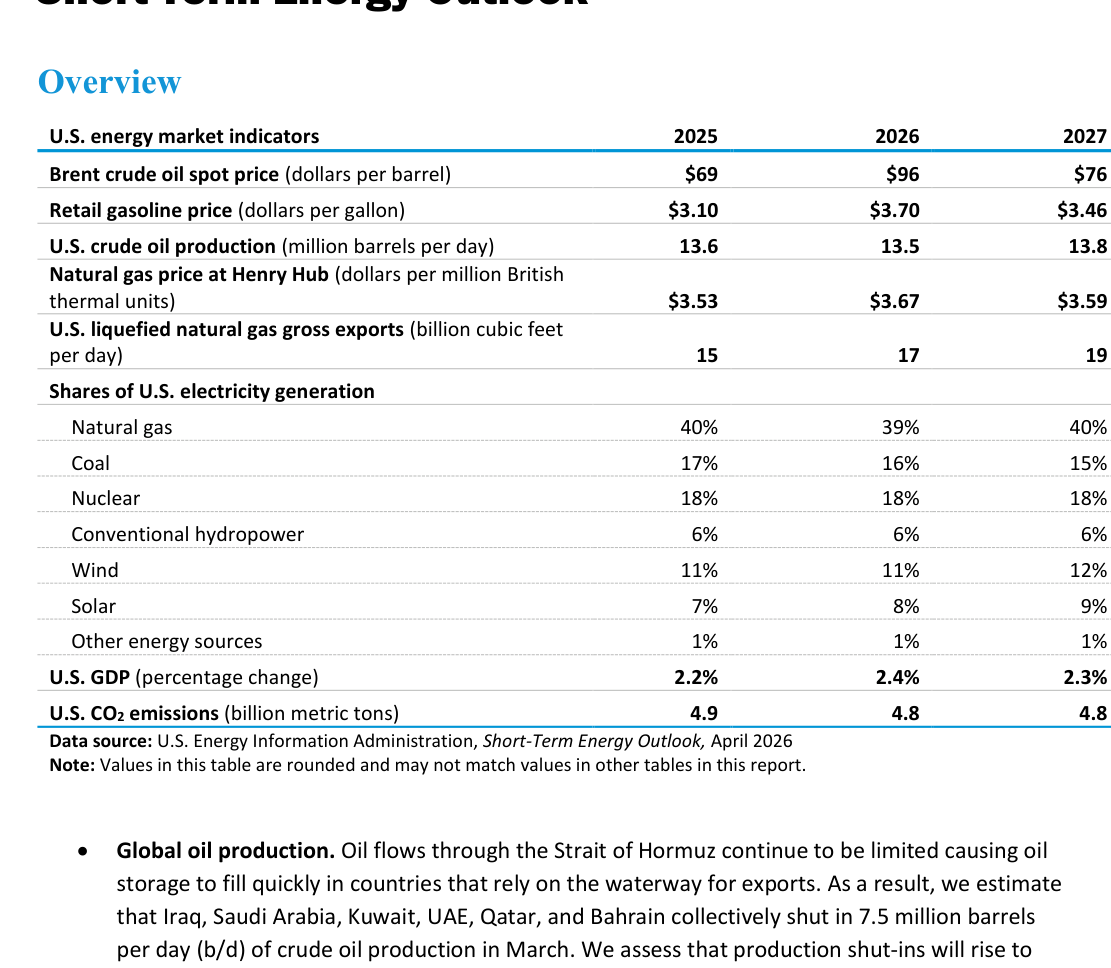
On the surface, the headline numbers are dramatic. The EIA's overview table now shows an average Brent crude oil spot price of $96 per barrel in 2026, a U.S. retail gasoline price of $3.70 per gallon, a Henry Hub natural gas price of $3.67 per million British thermal units, and U.S. LNG gross exports of 17 billion cubic feet per day. In the body of the report, the EIA goes further and says Brent averaged $103/b in March and is expected to peak at $115/b in 2Q26, while gasoline approaches $4.30/gal in April and diesel moves above $5.80/gal.
For market readers, the practical takeaway is that the report is really describing a chain reaction: constrained Gulf oil flows, upward revisions to Brent and retail fuels, and a parallel tightening in LNG markets that keeps U.S. export assets running close to full tilt. That is a much more useful framing than reading the STEO as a one-line bullish or bearish signal.
This STEO Is a Scenario Map, Not a Clean Base Case
The report is explicit about the setup. In its overview discussion, the EIA says oil flows through the Strait of Hormuz remain limited and that Iraq, Saudi Arabia, Kuwait, the UAE, Qatar, and Bahrain collectively shut in 7.5 million barrels per day of crude production in March. It then says shut-ins rise to 9.1 million b/d in April before gradually falling.
That matters because the entire oil path depends on one key assumption: the conflict does not persist past April and shipping through the strait gradually resumes. The report does not describe an indefinitely disrupted world. It describes a severe shock followed by a long normalization period that still keeps a geopolitical risk premium embedded in prices through late 2026.
That distinction is critical. A reader who only sees "$115 Brent" could mistake the number for a steady-state forecast. It is not. It is the peak in a disruption scenario that still assumes eventual flow recovery. The market implication is that price-spike and spread-widening risk matters more than treating the report as proof of a permanently tight global oil market.
Source Evidence Snapshot
The hero image already uses the report's opening overview table, so the evidence section avoids a second opening-table screenshot and starts with the mechanism. That opening page is still the cleanest one-page summary in the report: it frames 2026 around $96 Brent, $3.70 gasoline, $3.67 Henry Hub, and 17 Bcf/d of U.S. LNG exports, then ties those averages directly to the Strait of Hormuz disruption assumptions.
Forecast-revision source note: U.S. Energy Information Administration, Short-Term Energy Outlook, April 2026 PDF, page 4, "Notable forecast changes," shows the size of the reset relative to March 10, 2026. Brent's 2026 average moves from $79 to $96, diesel from $4.12 to $4.80, and gasoline from $3.34 to $3.70. In other words, the report is not merely acknowledging volatility. It is repricing the year.
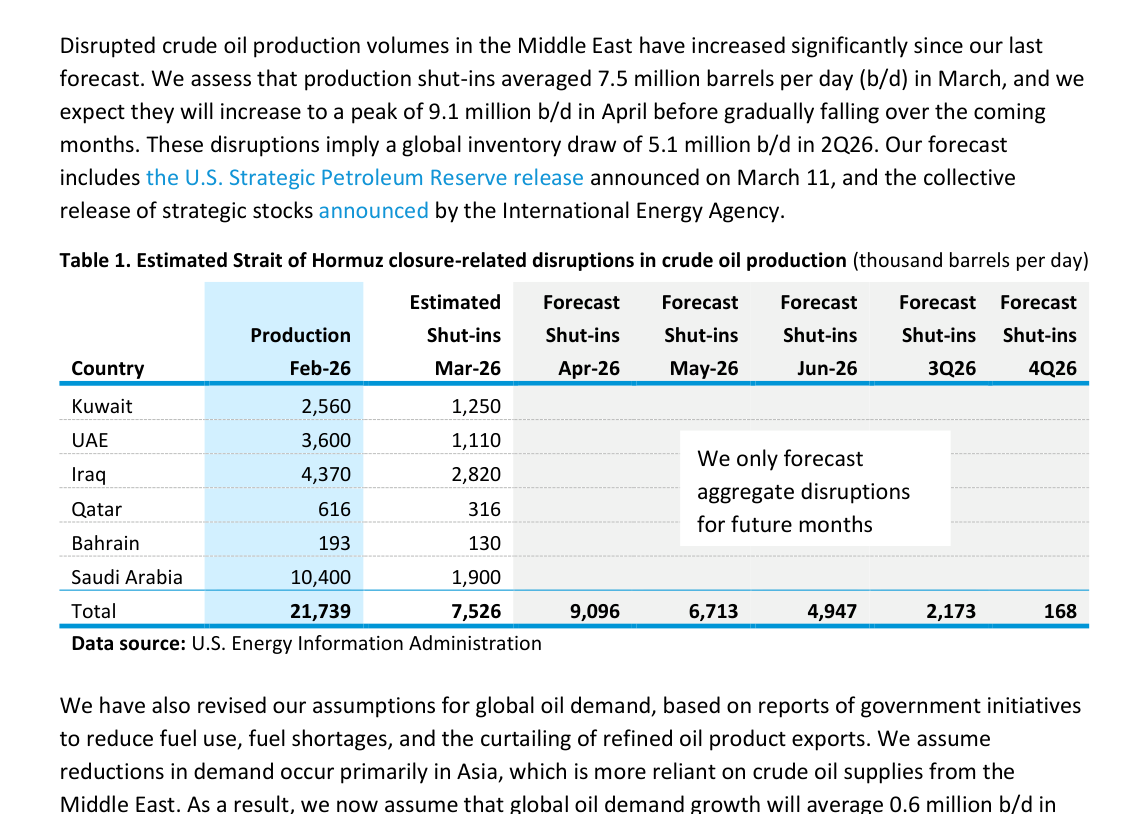
The shut-in table is what turns the oil forecast from story into mechanism. Total shut-ins rise from 7,526 thousand barrels per day in March to 9,096 thousand barrels per day in April before easing later in the year. That is the supply math behind the higher Brent path and tighter inventory balance.
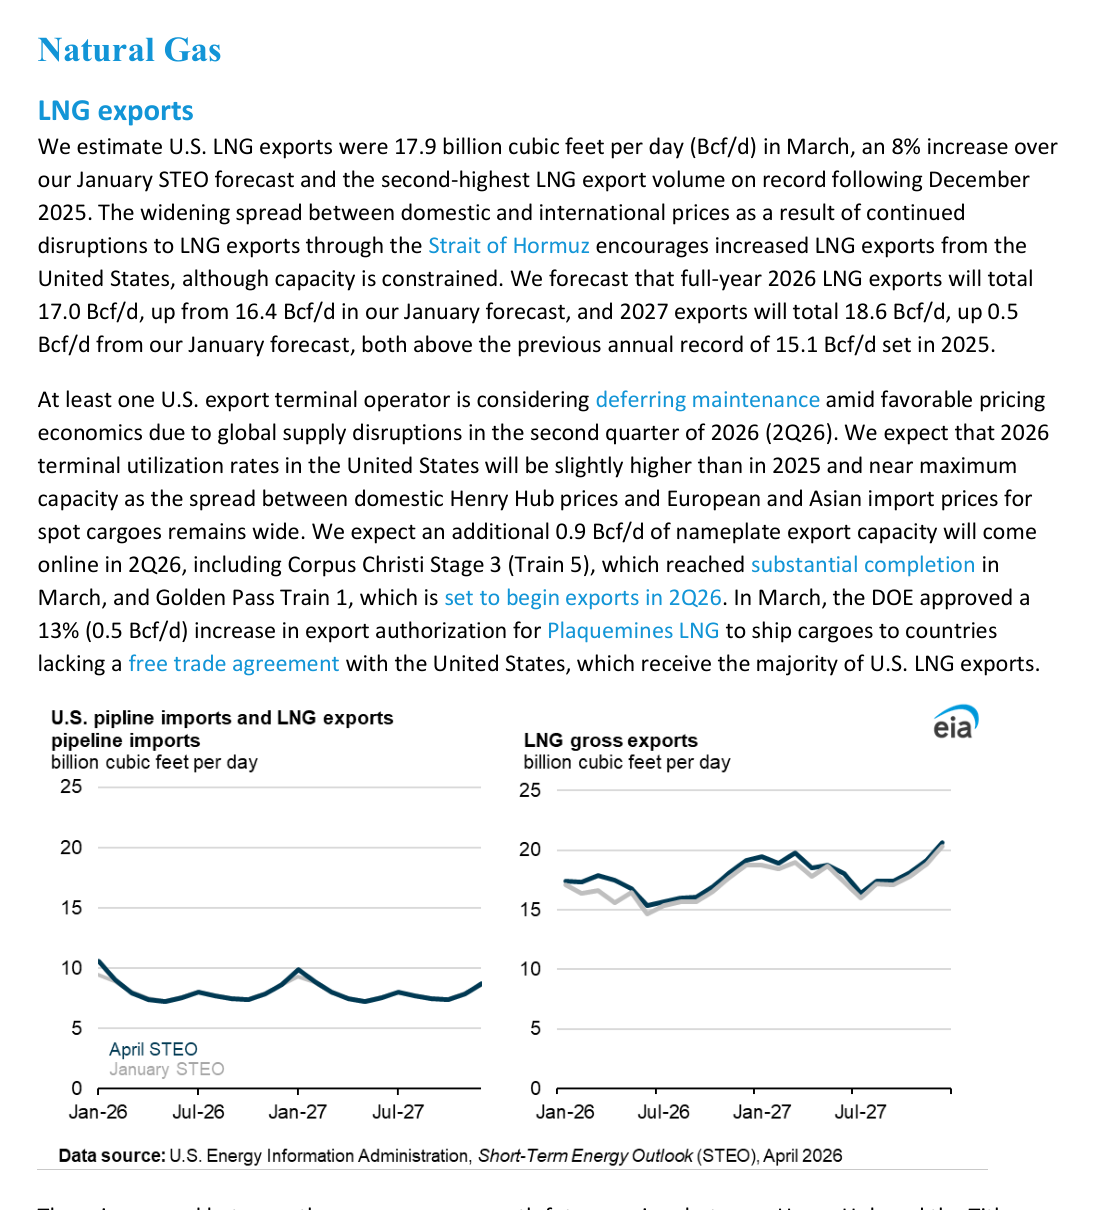
The LNG section confirms that the shock is broader than oil. The EIA estimates U.S. LNG exports reached 17.9 Bcf/d in March, forecasts 17.0 Bcf/d for full-year 2026, and 18.6 Bcf/d for 2027, while also noting that export flexibility is constrained because facilities are already operating near maximum capacity.
Why the Biggest Market Revision Was in Oil and Fuel
The report's March-to-April reset is unusually large. On page 4, the EIA shows Brent's 2026 average forecast rising 22% from the prior STEO, while retail gasoline increases 10.6% and retail diesel 16.7%. That scale of revision tells market readers two things at once.
First, the market impact is immediate. The EIA says Brent averaged $103/b in March and daily Brent prices reached almost $128/b on April 2. It also expects the Brent-WTI spread to peak at $15/b in April because Brent is more directly exposed to shipping costs and lost Middle East flows. That favors assets exposed to global crude pricing and can keep international benchmarks firmer than inland U.S. crude.
Second, the downstream impact is not symmetrical. Gasoline rises sharply, but diesel remains the tighter part of the barrel. The report forecasts average U.S. diesel prices above $5.80/gal in April and says distillate inventories remain below the five-year average. For refiners and fuel-linked equities, that means the signal is not just "higher oil." It is also "persistent distillate tightness."
The best way to read the report is to separate the peak from the average. The peak is the attention-grabbing number, but the annual average captures the extent to which EIA expects the premium to remain embedded even after flows begin to recover. That is why Brent still averages $96 in 2026 despite the report assuming the conflict does not continue past April.
The LNG Section Carries the Capacity Constraint Story
The LNG section is what makes this STEO more than a crude macro note. The EIA says reduced LNG flows through the Strait of Hormuz sharply widened the gap between Henry Hub and European and Asian import prices, pushing U.S. export facilities to near-peak capacity. It also notes that only limited flexibility exists to increase exports further.
That is a meaningful detail because it changes how the gas side of the market should be interpreted. Higher global LNG prices do not automatically mean unlimited upside for U.S. export volumes. The report explicitly points to operational bottlenecks, deferred maintenance decisions, and the pace of new project ramp-ups as the main sources of incremental flexibility.
The report also adds a capacity roadmap. It says 0.9 Bcf/d of additional U.S. nameplate export capacity is expected to come online in 2Q26, including Corpus Christi Stage 3 Train 5 and Golden Pass Train 1, and notes a 0.5 Bcf/d export authorization increase for Plaquemines LNG in March. Those are concrete operating details, not generic LNG enthusiasm.
For equity readers, that keeps the focus on infrastructure and execution rather than broad commodity beta alone. Export terminal operators, gas-focused midstream names, and companies tied to incremental Gulf Coast capacity are more directly linked to the report's logic than a blanket assumption that every gas producer wins equally from the scenario.
How Market Readers Should Read This STEO
The cleanest way to use the April 2026 STEO is as a scenario map with explicit assumptions, not as a narrative shortcut. The report supports a near-term case for elevated Brent, firmer refined-product pricing, and sustained pressure on global LNG balances. But those calls are only as durable as the supply disruption and reopening assumptions that sit underneath them.
That means there are three separate questions to track from here. The first is whether actual Strait of Hormuz flows recover on anything close to the report's timeline. The second is whether diesel and gasoline markets loosen as quickly as the EIA expects once crude trade adjusts. The third is whether U.S. LNG capacity additions and utilization rates can keep export volumes near the forecast path without creating a larger domestic gas price shock.
The value of this report is not that it eliminates uncertainty. It is that it shows exactly where the uncertainty sits: in shut-in duration, in the speed of shipping normalization, and in how much export systems can stretch before they hit hard physical limits. For market readers, that is more useful than a headline oil number because it points to where the next forecast error is most likely to emerge.