Energy & Commodities
Strait of Hormuz Flow Data Frames the Oil and Risk-Asset Stress Test
Hormuz flow exposure is verifiable; the rest is scenario risk. A 2026 map of how oil, LNG, inflation, and risk-asset transmission connect — kept apart from the headlines.
Thesis
(Source: EIA Today in Energy - Amid regional conflict, the Strait of Hormuz remains critical oil chokepoint)
An operation name on one side; on the other, EIA's June 16 and June 24, 2025 chokepoint briefs, which put hard numbers on the exposure — 20 million b/d of petroleum, about one-fifth of global LNG trade — and date when traffic was and was not blocked. That contrast decided the method here. The two briefs carry the load-bearing flow evidence; the operation-name framing was deliberately set aside as a scenario label. We also refused to let TradingView's live Brent feed stand in for structural claims. And where a figure lived only in EIA page text rather than a clean chart, we kept it as a linked source note instead of cropping a thin screenshot.
Related reading: The EIA Release Calendar Puts Crude Risk and Energy Stocks on a Clock | What ChatGPT, Gemini, and Claude Can't Replace in Stock Research | Verify Your Broker Before You Pick a Single U.S. Stock
Headlines can jolt markets on a scenario label alone, but that is the wrong thing to anchor on for Hormuz. The useful question is whether official flow evidence supports a durable oil, LNG, inflation, and risk-asset stress channel. Any dramatic operation label should be treated as a scenario label unless it is verified by primary sources.
The framework below uses primary evidence from EIA and IEA to map what the market should monitor if Hormuz transit risk escalates. It avoids a deterministic closure forecast and keeps the analysis tied to official chokepoint data, LNG transit exposure, and release schedules.
A key anchor from EIA's June 16, 2025 brief: traffic through Hormuz was not reported as blocked at that time, but the channel remained systemically critical to global oil flows. That distinction matters. Markets can price risk premia long before a full physical shutdown is confirmed.
Source Evidence Snapshot
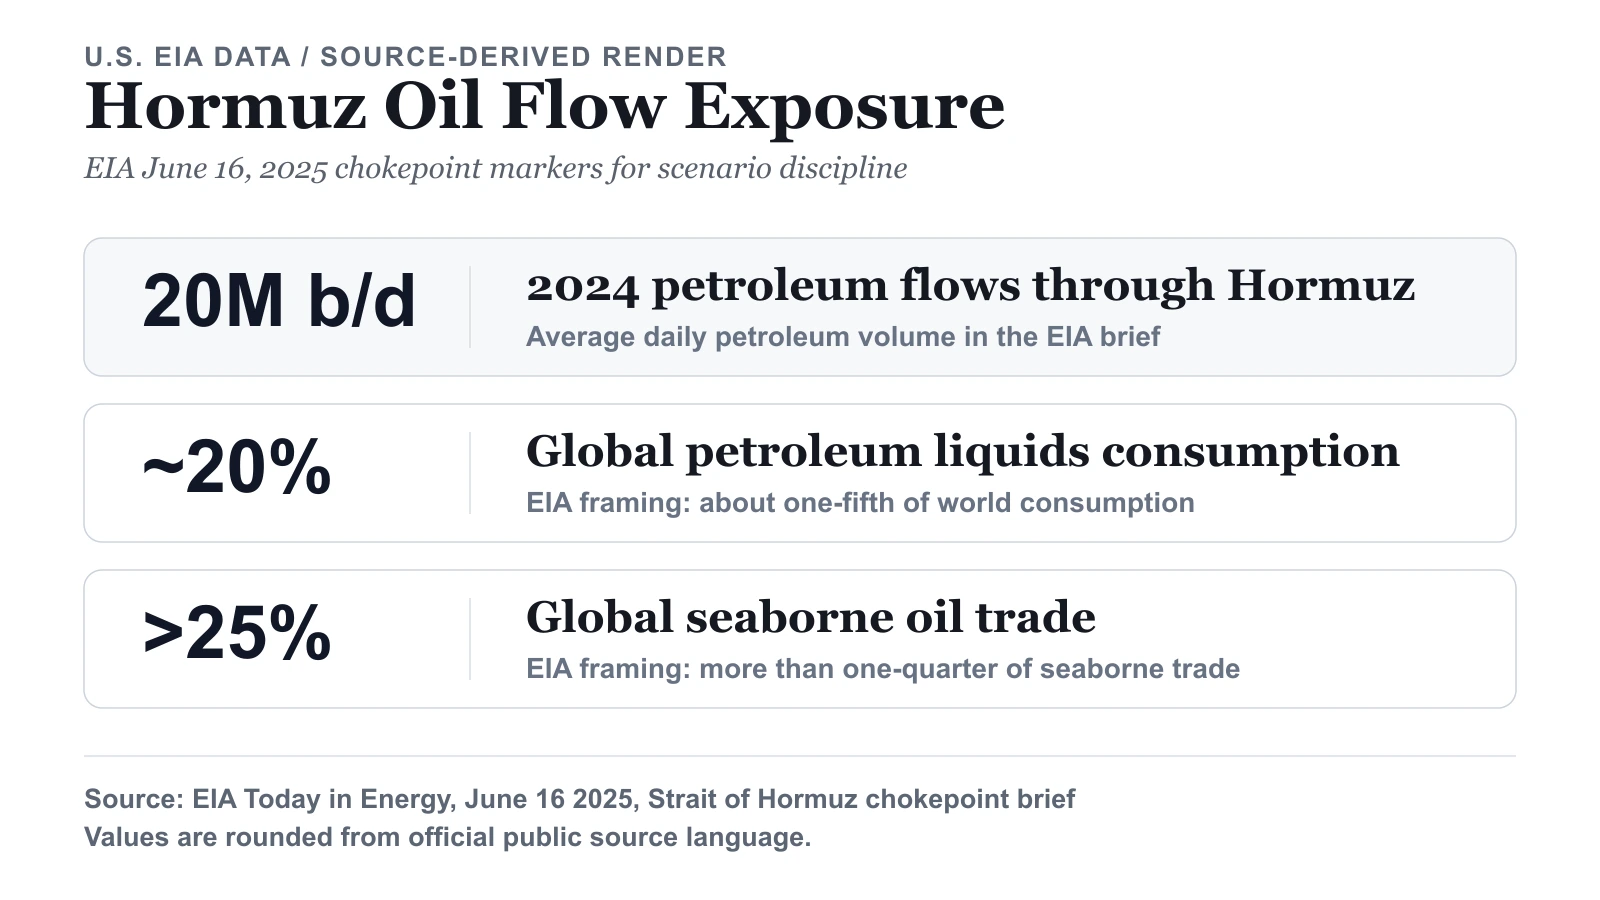
The lead visual carries a source-derived petroleum-flow exposure card. The paragraph-level EIA facts are kept as linked source notes rather than another narrow screenshot: EIA's June 16, 2025 brief says 2024 Hormuz petroleum flows averaged 20 million b/d, equal to about 20% of global petroleum liquids consumption, and also describes Hormuz as more than one-quarter of global seaborne oil trade. The LNG exposure is summarized in the source-derived EIA card below.
One read worth making explicit from those same EIA figures: Hormuz's grip on waterborne crude is tighter than its grip on demand. Its share of global seaborne oil trade (more than one-quarter, so >25%) runs above its share of global petroleum consumption (about 20%) — a gap of more than 5 percentage points, or a ratio above 1.25x. Read against the LNG leg (about one-fifth, ~20% of global LNG trade), seaborne crude is the higher-concentration exposure of the two commodities, by at least a similar ~5-point margin. The practical implication is direct: the chokepoint bites hardest on the cargoes that have no pipe to fall back on, which is exactly where a freight-and-availability premium would show up first. The reader should pull EIA's spare-capacity and bypass-pipeline figures to size how much of that 20 million b/d could actually reroute — that input is not in this post.
 Source-derived card using EIA Today in Energy - About one-fifth of global liquefied natural gas trade flows through the Strait of Hormuz, captured 2026-04-06. The percentage is the source's; the layout is ours.
Supporting text checks used in this article, but not kept as standalone screenshot panels, include the EIA publication headers for the June 16 and June 24 source pages, the EIA Weekly Petroleum Status Report schedule release-window text (after 10:30 a.m. and after 1:00 p.m. ET on Wednesday), and the IEA Oil Market Report data product page monthly publication schedule. The standalone OMR schedule capture is left to the crude-oil scenario page so this article's visual evidence stays focused on Hormuz flow exposure.
What This Evidence Proves and What It Does Not Prove
What the captured evidence supports:
- Hormuz is still a high-concentration transit channel for both oil and LNG.
- Even without a confirmed full closure, risk repricing can be rational because alternatives are limited.
- LNG transmission risk is not secondary; it is part of the same macro shock path.
What the evidence does not support by itself:
- a confirmed multi-month closure event,
- exact future oil-price targets,
- reliable timing for military escalation scenarios.
That is why this page is framed as a monitoring and scenario workflow rather than a deterministic forecast.
Market Pricing Context
Transmission Map: From Chokepoint Risk to Portfolio Outcomes
1) Oil Benchmark and Freight Risk
If transit risk rises, markets tend to price a freight and availability premium quickly. The first reaction is often in front-month pricing and shipping-sensitive spreads, not in perfect long-horizon forecasts.
2) LNG and Regional Power Markets
Because EIA documents sizable LNG transit through Hormuz, the risk path extends into gas-fired generation costs and import-dependent utility systems, especially where LNG procurement is spot-linked.
3) Inflation and Central-Bank Reaction Function
A supply-driven energy move can complicate policy assumptions. If headline energy costs rise while growth confidence weakens, policy signaling can become less linear than standard soft-landing templates assume.
4) Equity Dispersion Instead of One-Way "Risk Off"
In geopolitical supply shocks, energy and defense-linked names diverge from broad-index weakness rather than moving with it. So the question is not how loud the headline is; it is whether official flow and inventory data confirm sustained stress.
Data-Update Workflow (Exact Calendar Anchors)
Use fixed checkpoints rather than ad-hoc social feeds:
- Weekly: EIA WPSR release windows on Wednesday (
after 10:30 a.m.ET and additional filesafter 1:00 p.m.ET). - Monthly: IEA OMR publication cycle (
10:00 Paris time) with scheduled release dates. - Episodic: EIA Today in Energy chokepoint updates when new transit or rerouting evidence is published.
This cadence helps avoid two common mistakes: overreacting to unconfirmed geopolitical headlines and underreacting when official flow data actually shifts.
Scenario Grid for Risk Management
Scenario A: Risk Premium Without Physical Interruption
- Signal: headlines remain elevated but throughput indicators remain broadly intact.
- Market implication: higher volatility and periodic spikes, but no persistent supply-gap pricing.
- Focus: option hedging discipline and selective cyclic exposure sizing.
Scenario B: Sustained Transit Friction
- Signal: repeated shipping disruptions, rerouting constraints, and tighter prompt balances.
- Market implication: oil and LNG risk premium stays sticky across multiple reporting cycles.
- Focus: energy-input sensitivity by sector, margin compression risk, and position concentration controls.
Scenario C: Hard Disruption Window
- Signal: official evidence points to meaningful throughput loss and insufficient bypass capacity.
- Market implication: broad cross-asset repricing, with inflation and growth channels both under pressure.
- Focus: liquidity planning, hedge execution timing, and strict downside rules.
What Changes the Hormuz Risk Read
For this topic, evidence discipline is the edge. Use primary-source flow data and release schedules to validate whether the market move is a temporary fear shock or a durable supply regime change.
Related reads: