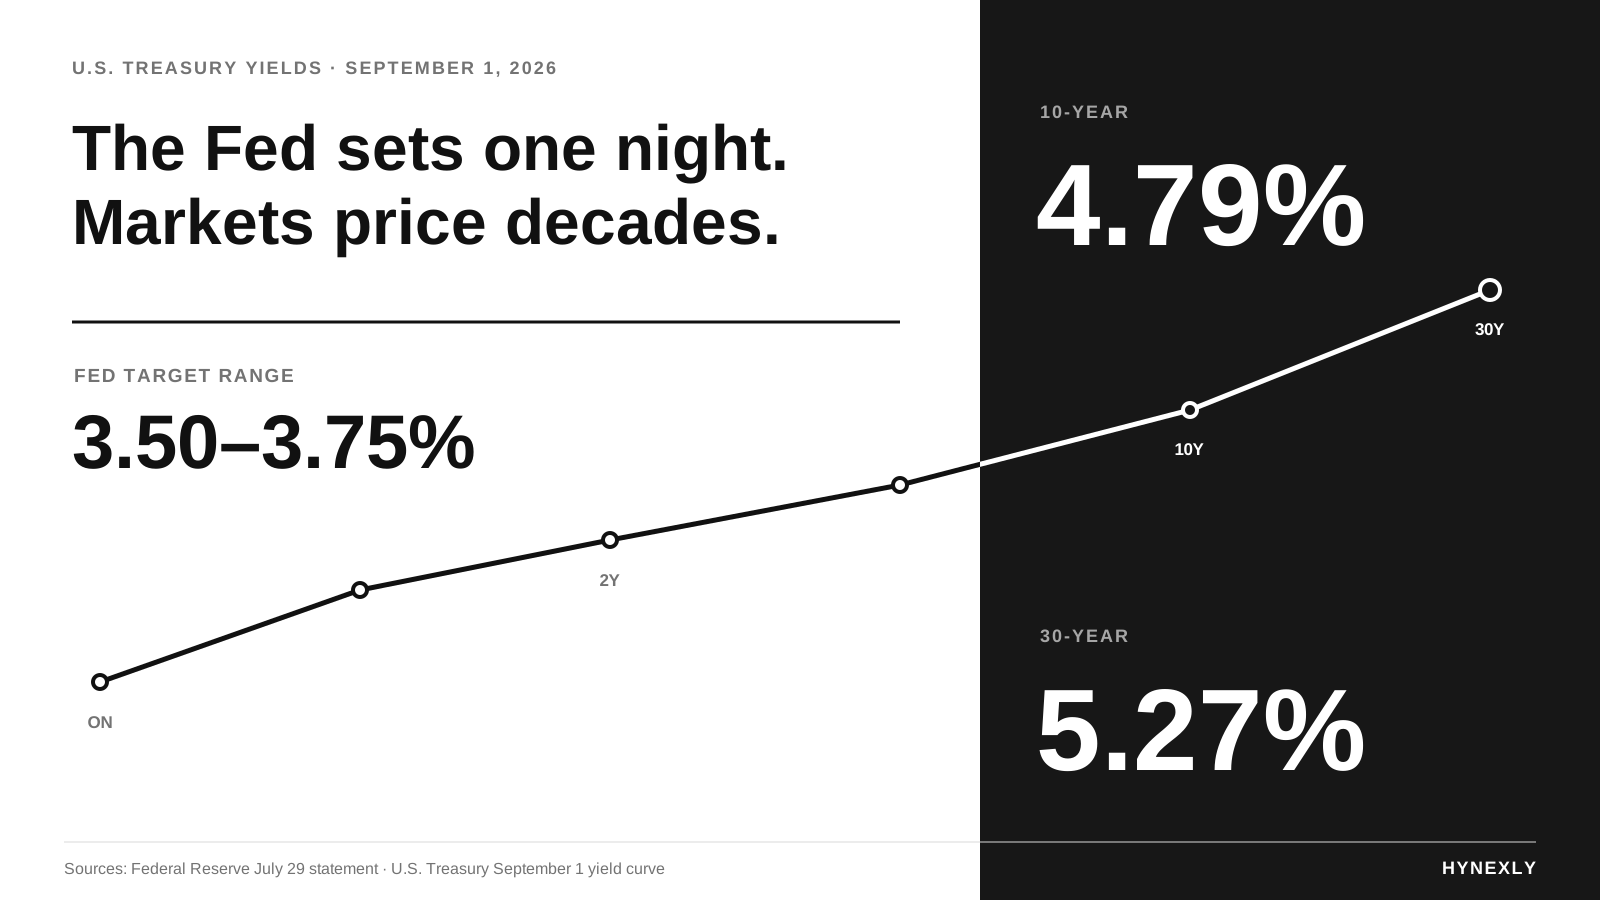
Why Long Treasury Yields Can Stay High Even if the Fed Cuts
A source-grounded guide to the 10-year and 30-year Treasury yield through real rates, expected short rates, term premium, and issuance supply.
Only evidence-ready Hynexly articles about Market & Macro appear here.
Compare current revenue, undisclosed product mix, and future targets on one evidence scale.
 Nvidia: compute and networkingSeparate product mix and growth contribution inside already-reported revenue.
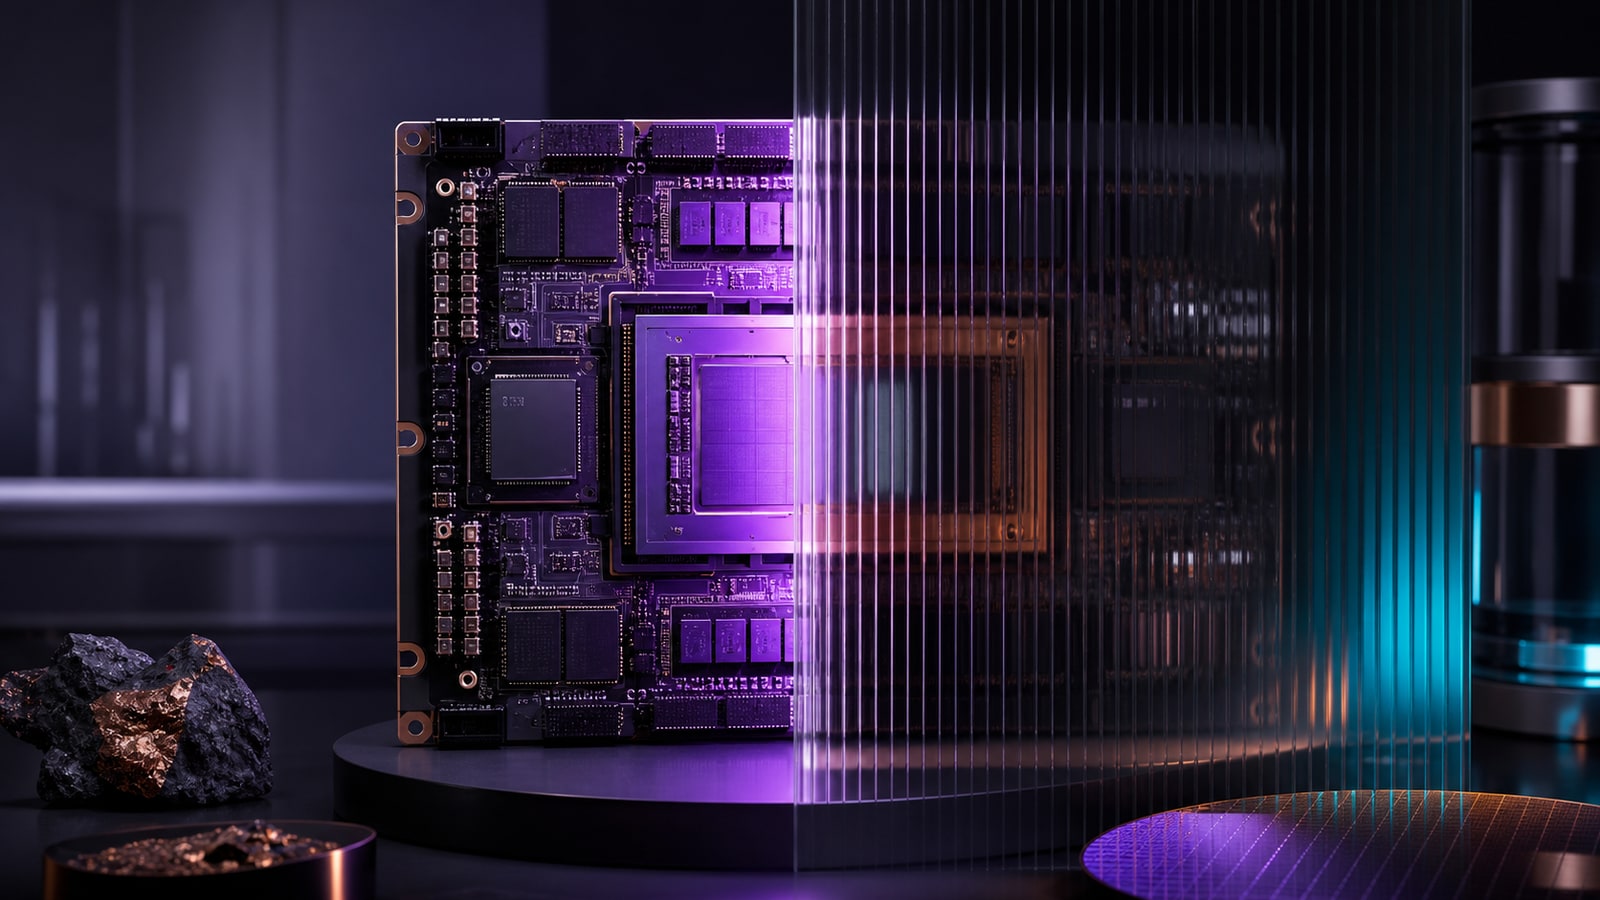 Broadcom: AI growth and the disclosure gapRead company-scale AI revenue together with the product mix investors still cannot see.
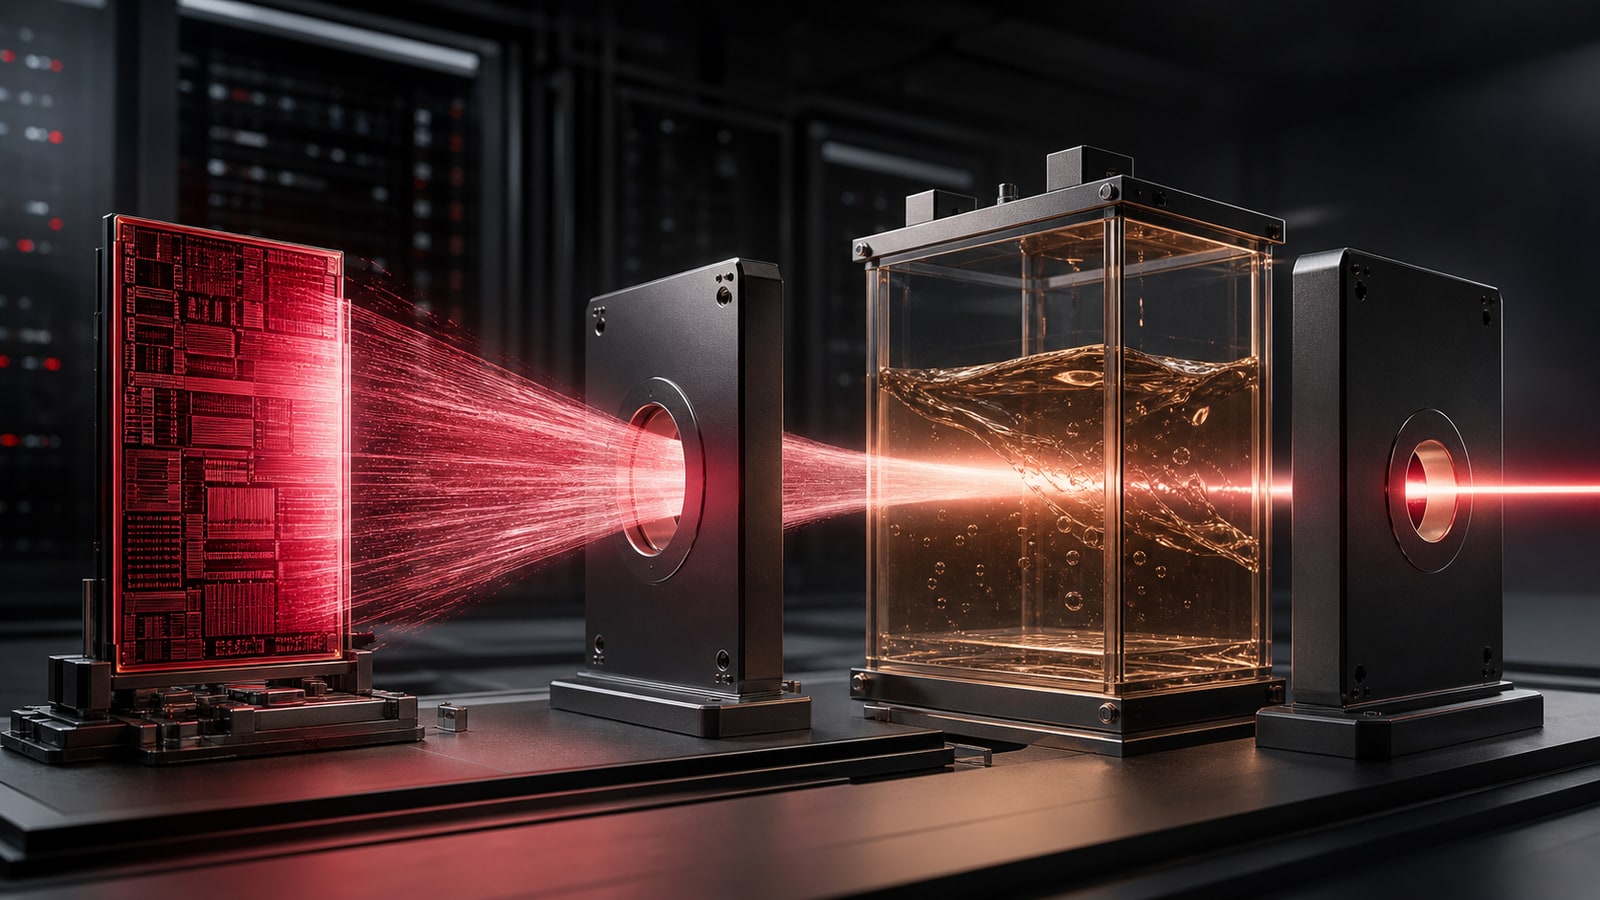 AMD: the data-center profit testTest whether reported growth reached operating profit and cash.
Separate normalized returns, revenue mix, and cost conversion behind the same EPS headline.
 JPMorgan: adjusted ROTCERemove significant items, then test repeatable returns and dependence on Markets growth.
 Bank of America: the $4.1B bridgeTrace how NII, fees, and Markets divided the incremental revenue pool.
 Citi: returns and cost captureTest how much revenue growth converted into expenses and returns on tangible equity.
A source-grounded guide to the 10-year and 30-year Treasury yield through real rates, expected short rates, term premium, and issuance supply.
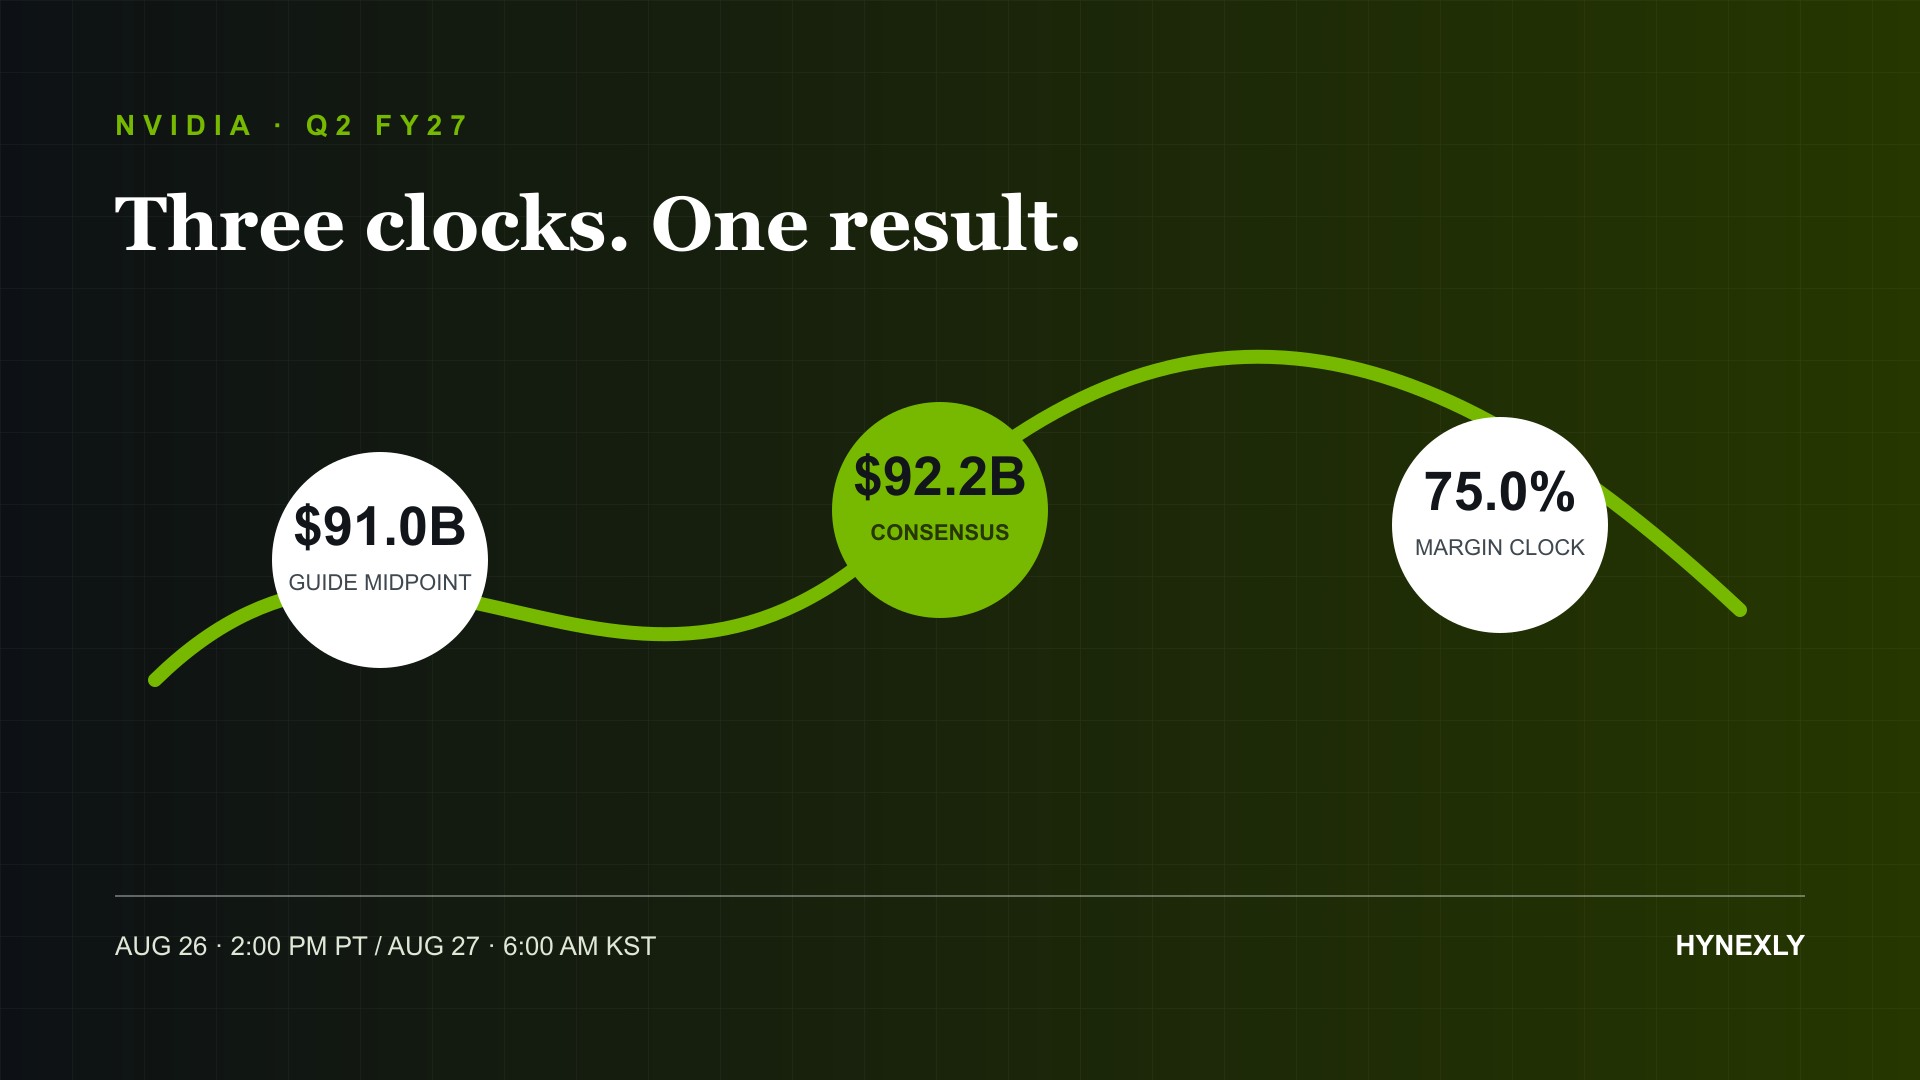
Nvidia reports Q2 FY2027 on August 26. The guide, consensus, margin bridge, Data Center mix, China boundary, and Q3 test in one evidence-led scorecard.
A filing-led review of CRCL's Q2 income statement, balance sheet, cash flow, valuation, Arc launch, trust-bank approval, and the evidence the rally still needs.
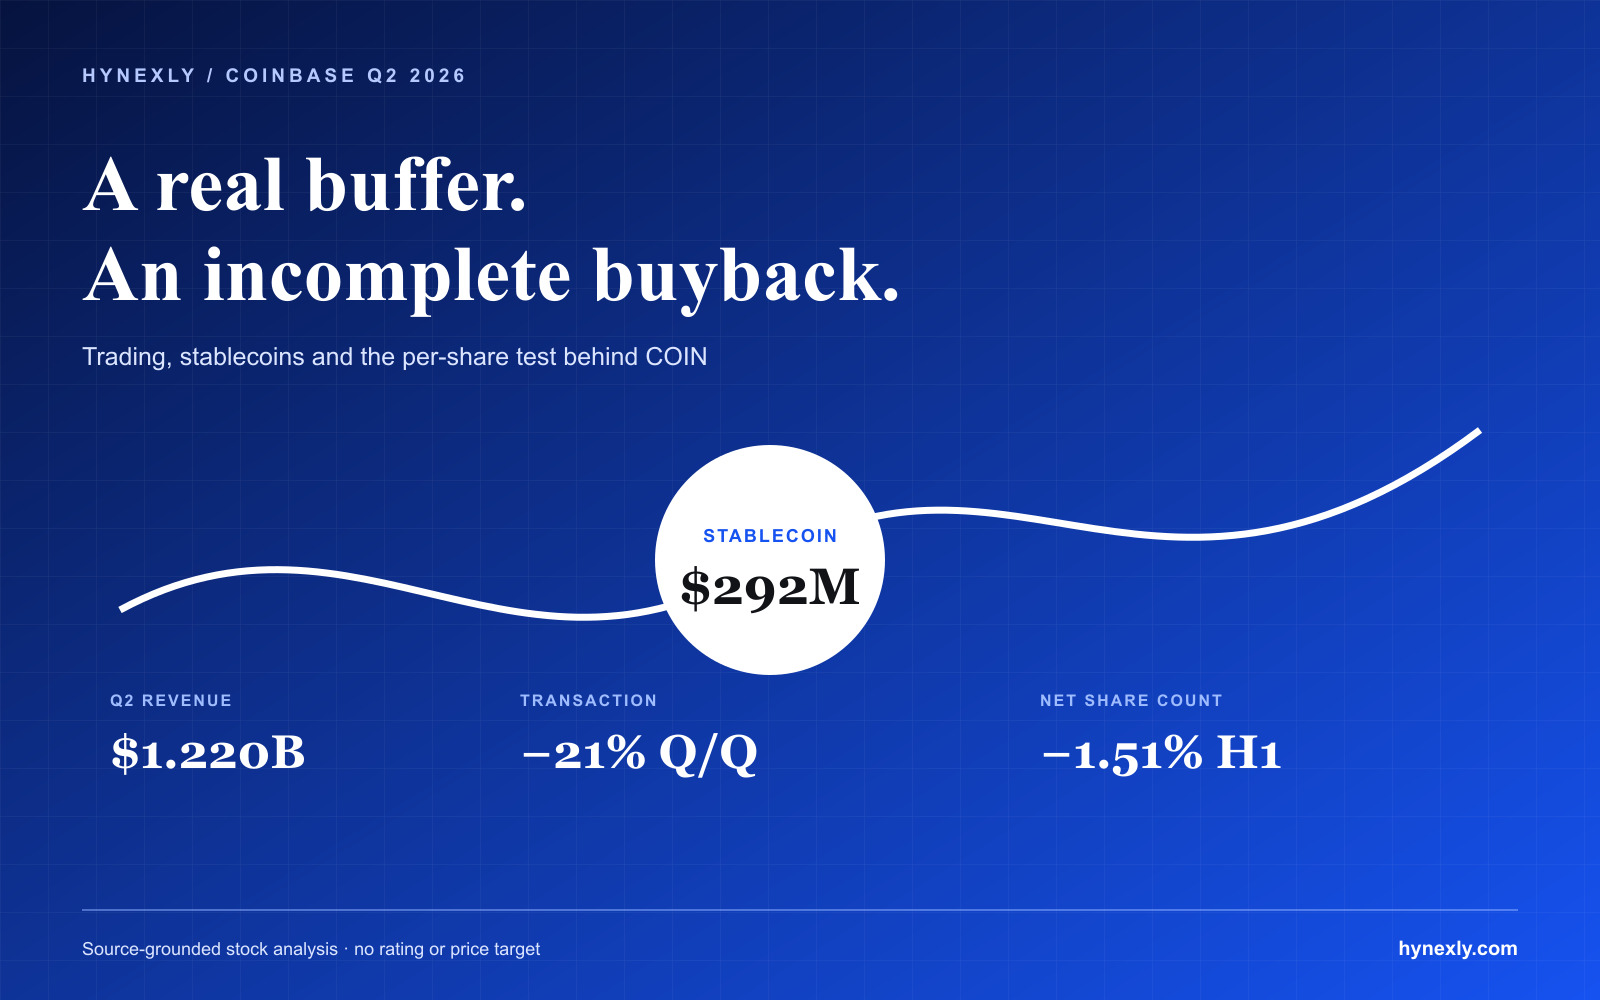
Coinbase Q2 trading revenue fell 21%, stablecoin revenue held at $292M, and a large repurchase produced only a 1.5% net share-count decline. Here is what COIN must prove next.
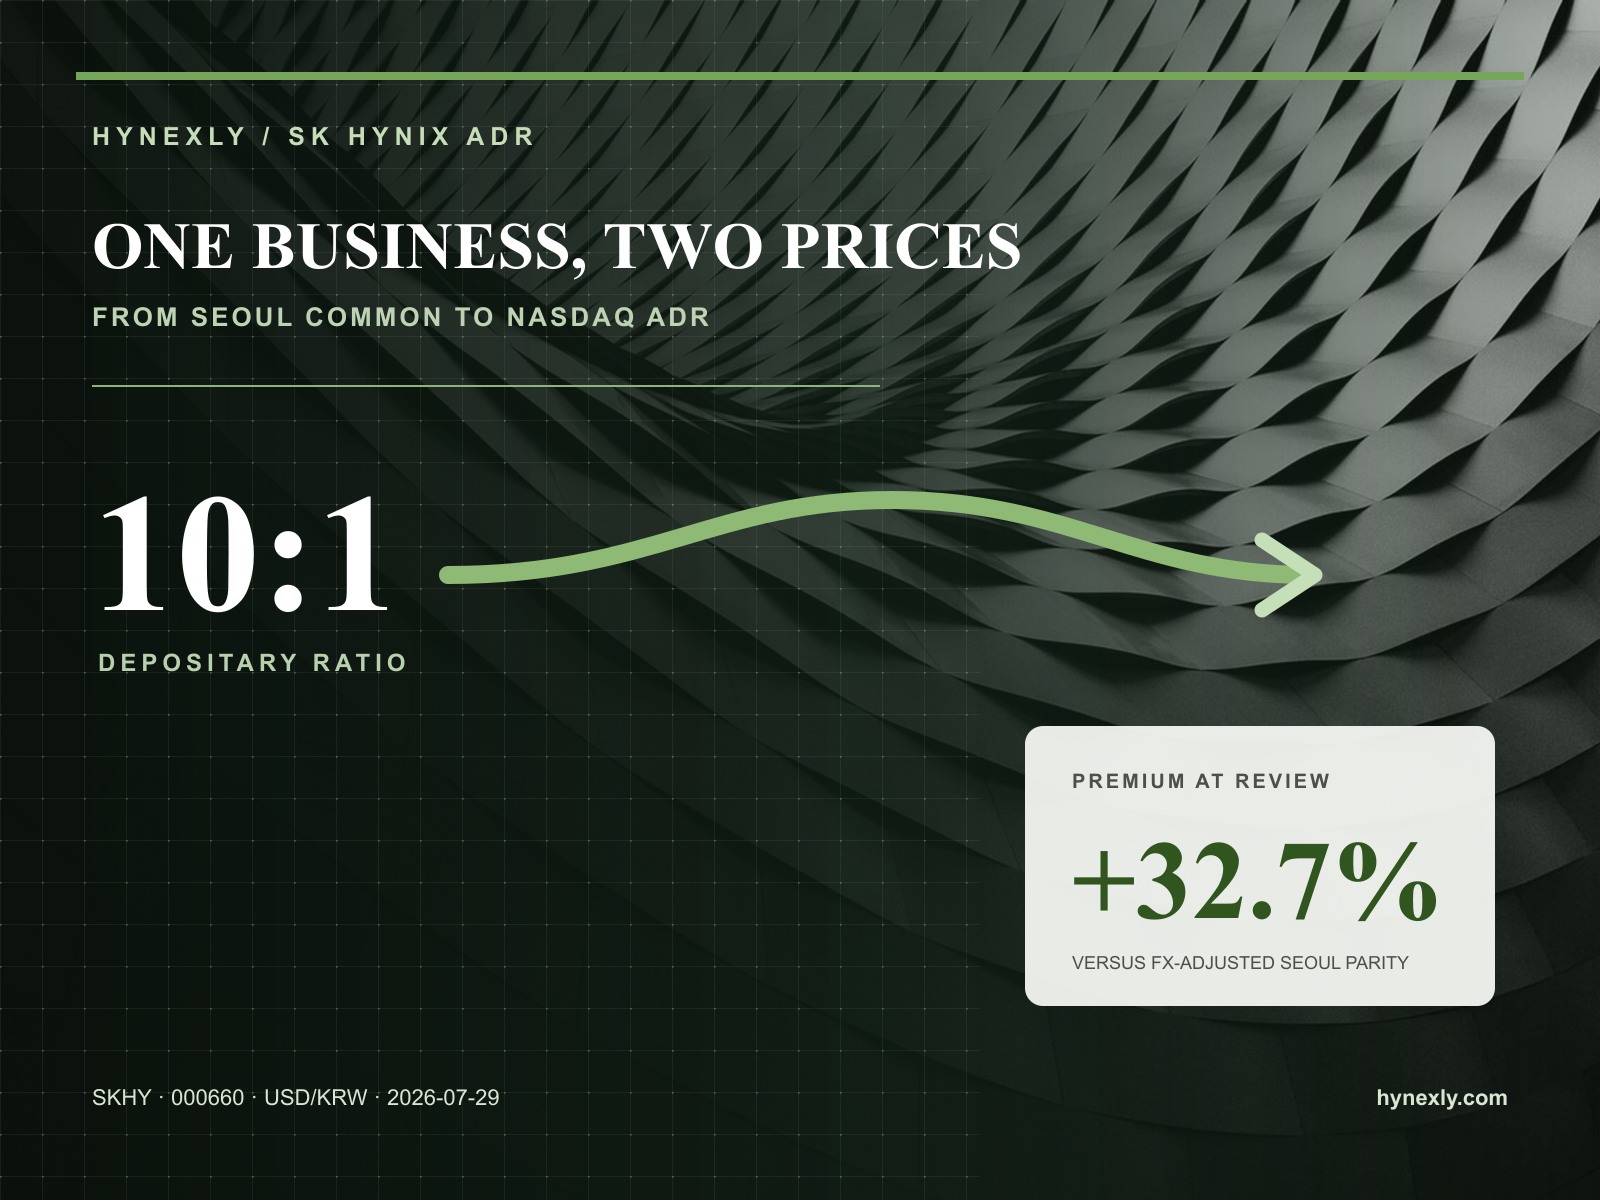
Ten SKHY ADRs equal one SK hynix share. The U.S. wrapper recently traded about 33% above FX-adjusted Seoul parity; this is what can close—or preserve—the gap.
Nvidia Q1 revenue rose 85.2% and company-defined FCF 85.8%, while inventory used $4.420B of operating cash. August 26 tests the Blackwell ramp.
Micron FQ3 revenue rose 74% and adjusted FCF reached $18.3B, but shipments rose only single digits. Sixteen contracts add floors and ceilings; the cycle remains.
A disclosure-aware Netflix scorecard for revenue quality, operating margin, advertising, and free cash flow after subscriber additions stopped being the lead metric.

Tesla's Q2 filing shows the delivery beat converted into $28.236B of revenue and $4.697B of operating cash flow, but 16.8% GAAP gross margin and -$1.092B of non-GAAP free cash flow keep the conversion case unresolved.
Bank of America added $4.115B of Q2 revenue. Follow the bridge from NII and recurring fees to the faster Global Markets accelerator, then test what can repeat.
Citi reached 13.0% Q2 RoTCE and absorbed only 20.6% of incremental revenue with higher expense. The next test is turning one strong quarter into a durable system.

Goldman's Q2 ROE reached 23.5%, but one division supplied 93.6% of revenue growth. Follow the return engine and the evidence that can make it repeat.

A five-gate field guide for reading JPMorgan, Bank of America, and Citi without mixing adjustments, revenue engines, cost conversion, or credit denominators.
Remove $4.219B of after-tax gains and JPMorgan's Q2 ROTCE falls from 29% to 23%. Markets supplied 46.4% of adjusted revenue growth; five Q3 checks follow.
AMD's Q2 Data Center revenue and margin cleared the profit test, but free cash flow fell as operating cash flow softened and capital spending doubled.
Broadcom AI semiconductor revenue reached $10.8B, about 48.7% of Q2 FY2026 revenue and roughly 88.5% of annual growth, but accelerator, networking, margin, and customer concentration remain hard to separate.

A reader-friendly worksheet for separating reported AI revenue, company guidance, and long-range targets before comparing businesses.

Why NVIDIA's $75.2B quarter, Broadcom's $10.8B quarter, and Qualcomm's >$15B FY2029 target belong in separate comparison lanes.
Nvidia networking was 19.7% of Q1 FY2027 Data Center revenue and 27.3% of its year-over-year growth. The new Hyperscale/ACIE reporting lens changes what investors can verify next.
Your privacy choices
Choose whether Hynexly may use Google Analytics and personalized AdSense cookies. Necessary cookies always stay on. Change your choice anytime in our Privacy Policy.