Companies. Markets. What the numbers mean.
Independent research / EN · KO
Latest analysis
One ETF Page, Four Percentages: What SEC Yield, Trailing Yield, YTM and Total Return Each Answer
On September 24, TLT showed a 5.41% SEC yield, a 4.90% trailing yield and a −6.15% year-to-date total return. What each number measures, why they differ, and the calculation that ties yield to rate risk.
Read the story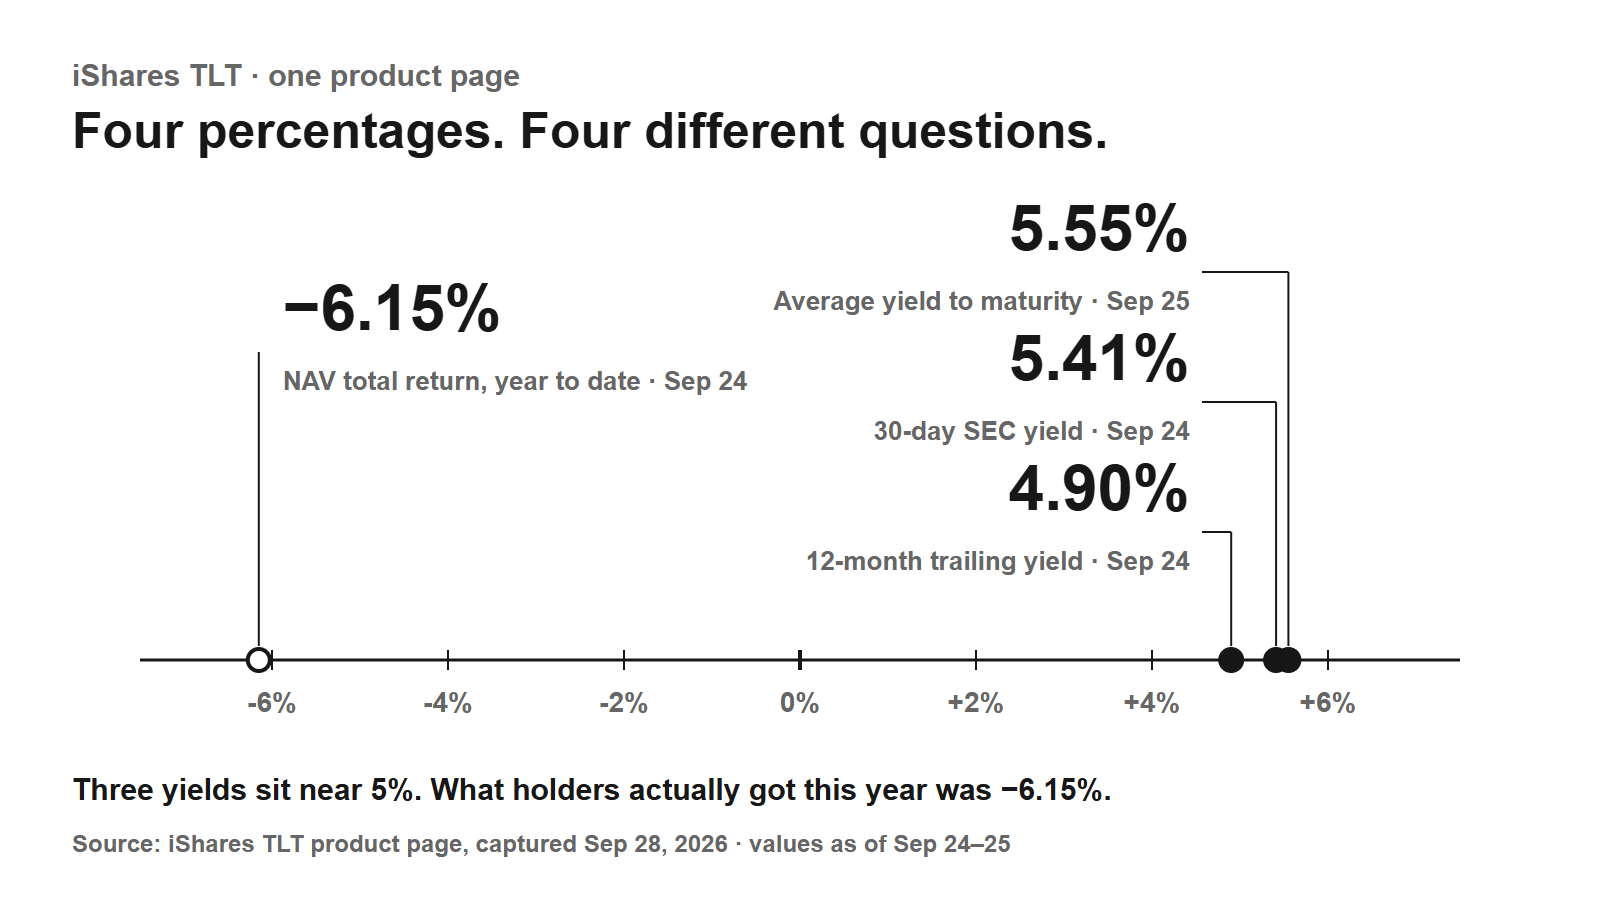
In the journal
All articles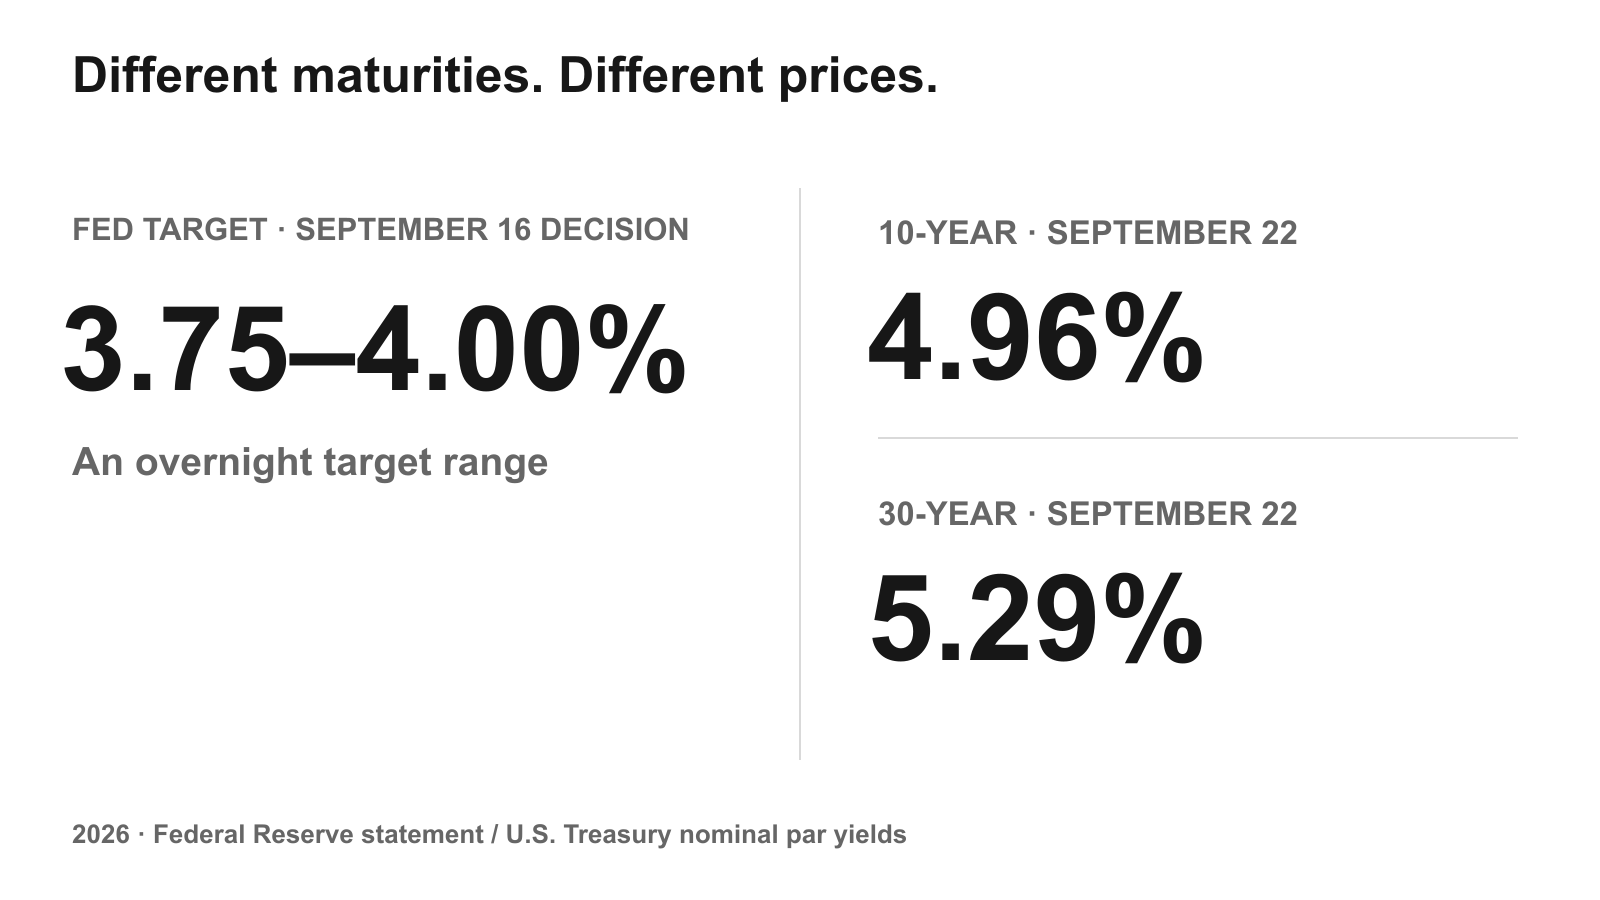
Why the Fed Rate Doesn't Tell the Whole Treasury Story
The Fed's September hike and the Treasury curve tell different stories. A matched nominal-versus-real yield comparison shows what changed—and what it cannot prove.
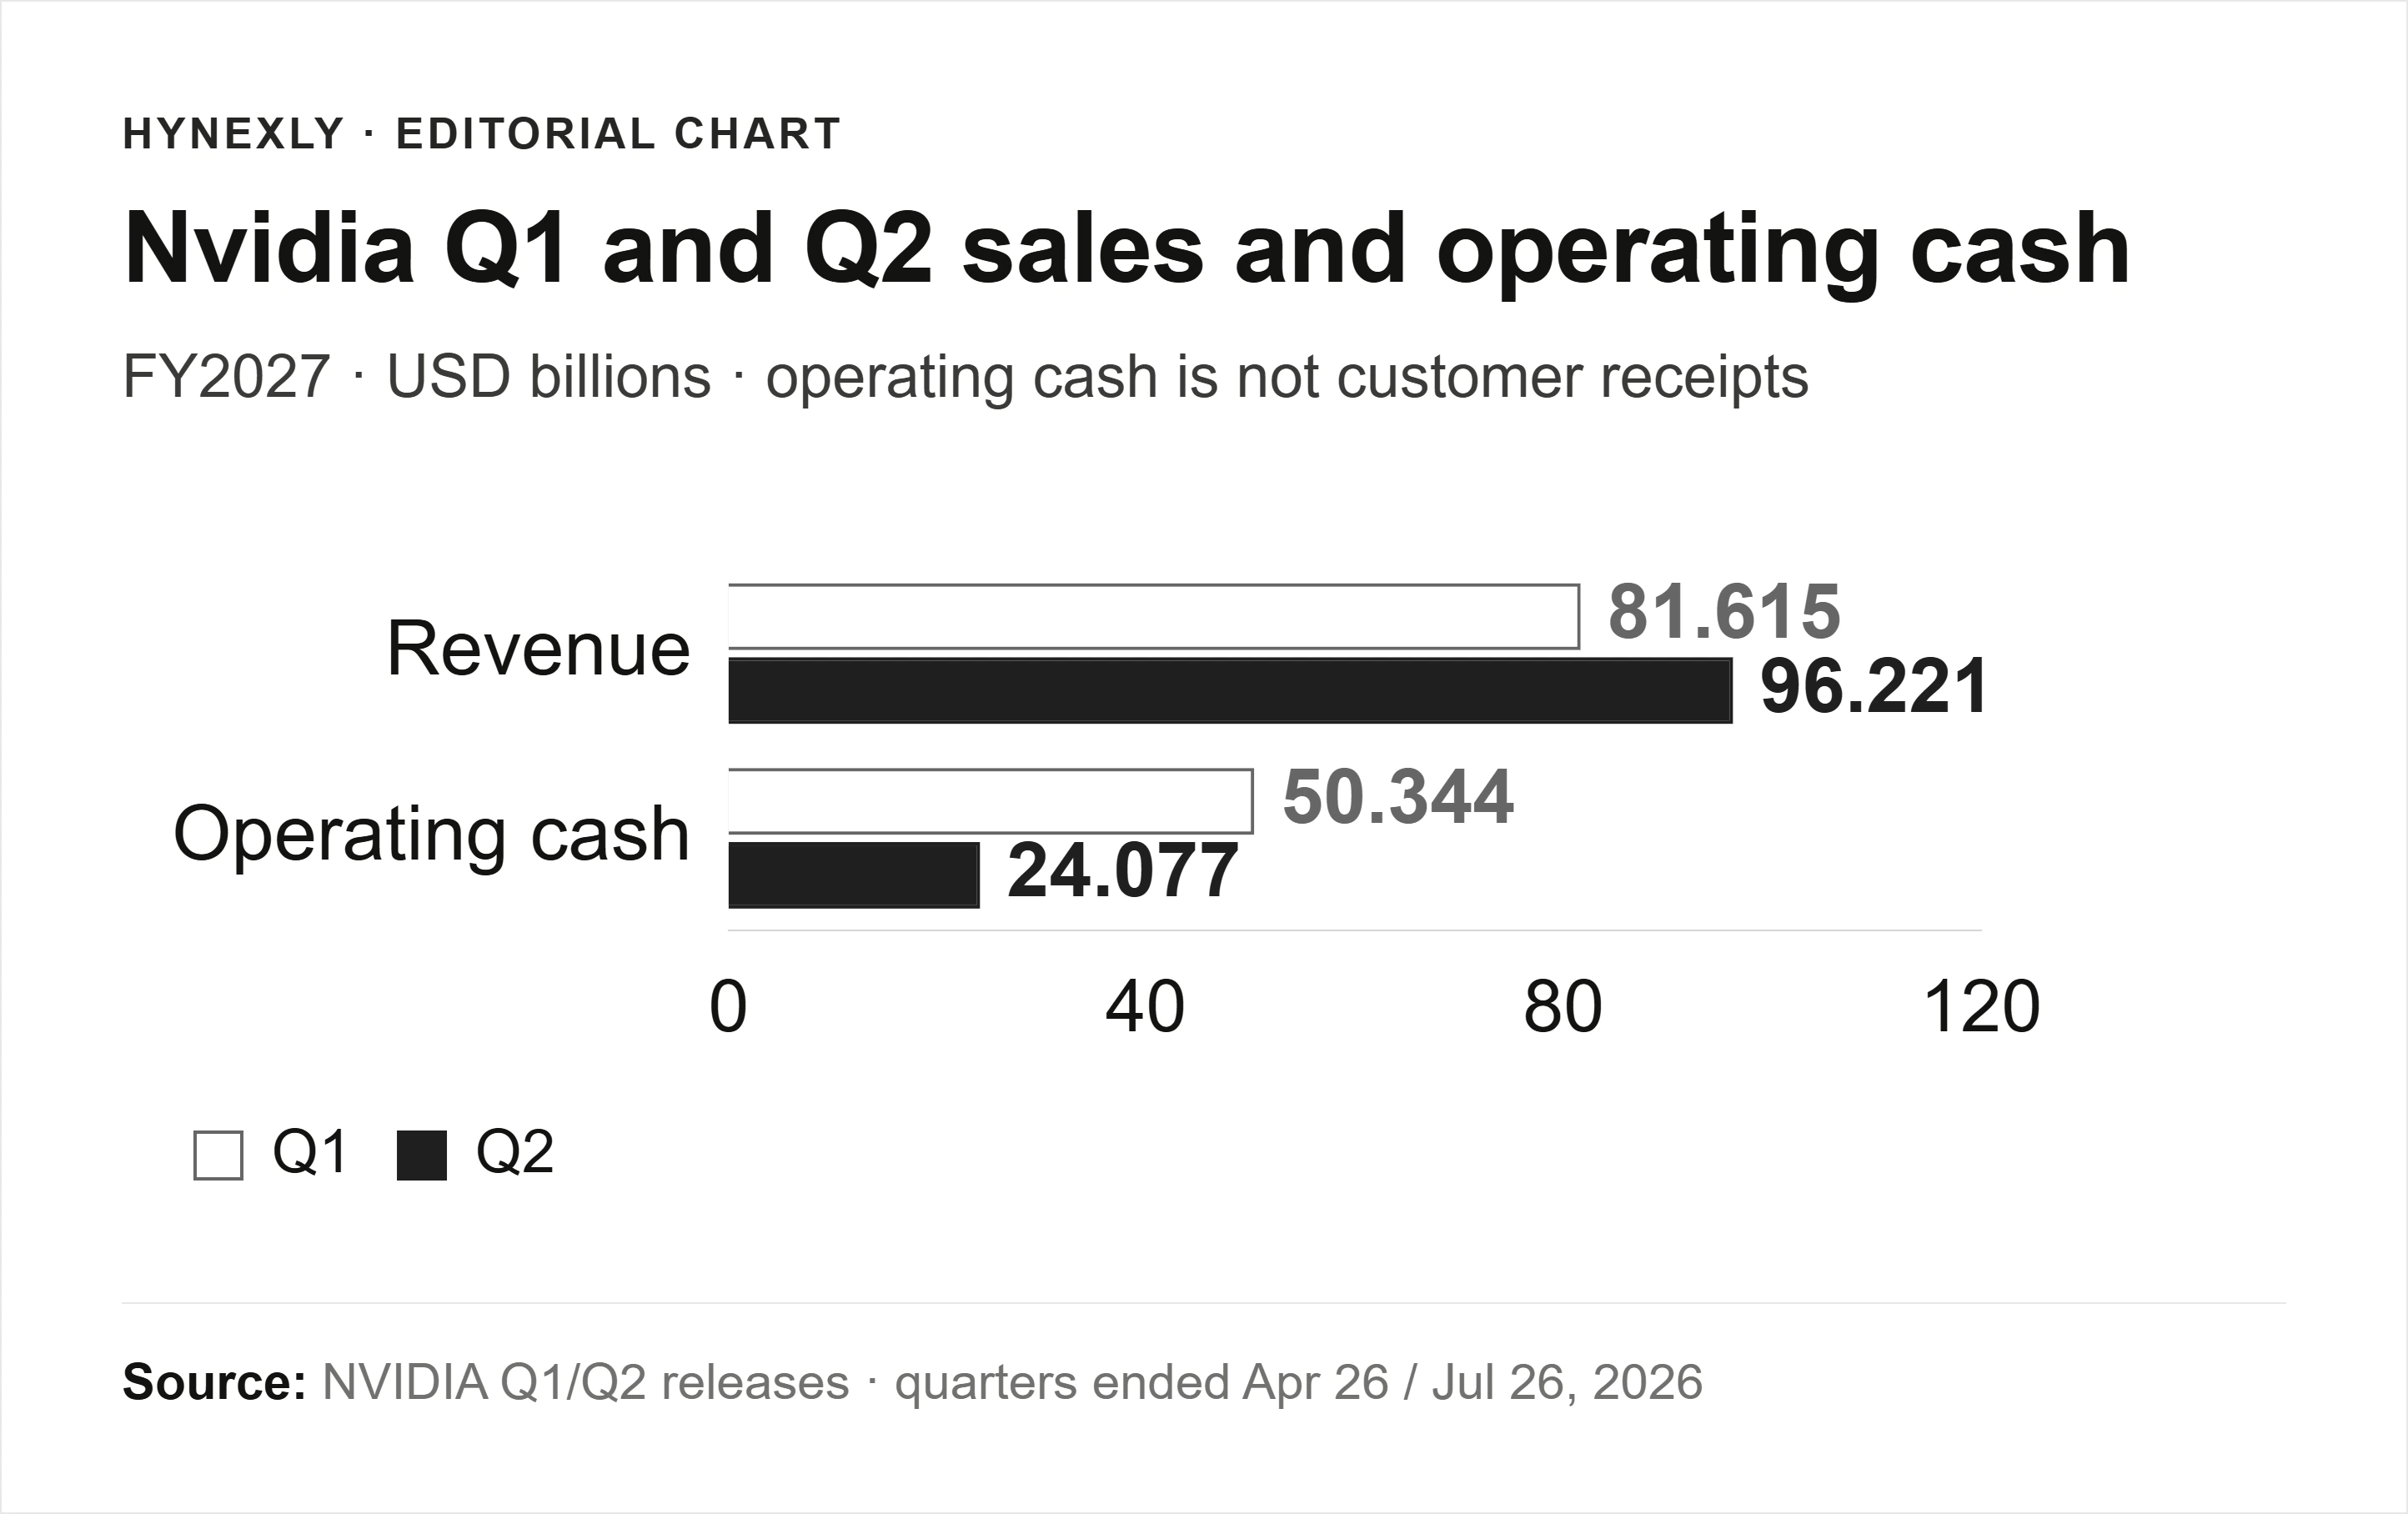
Nvidia's Sales Grew. Why Did Operating Cash Flow Halve?
Nvidia's Q2 sales rose while operating cash fell. A $20.1B increase in receivables-related cash use explains much of the gap, without proving customer default.
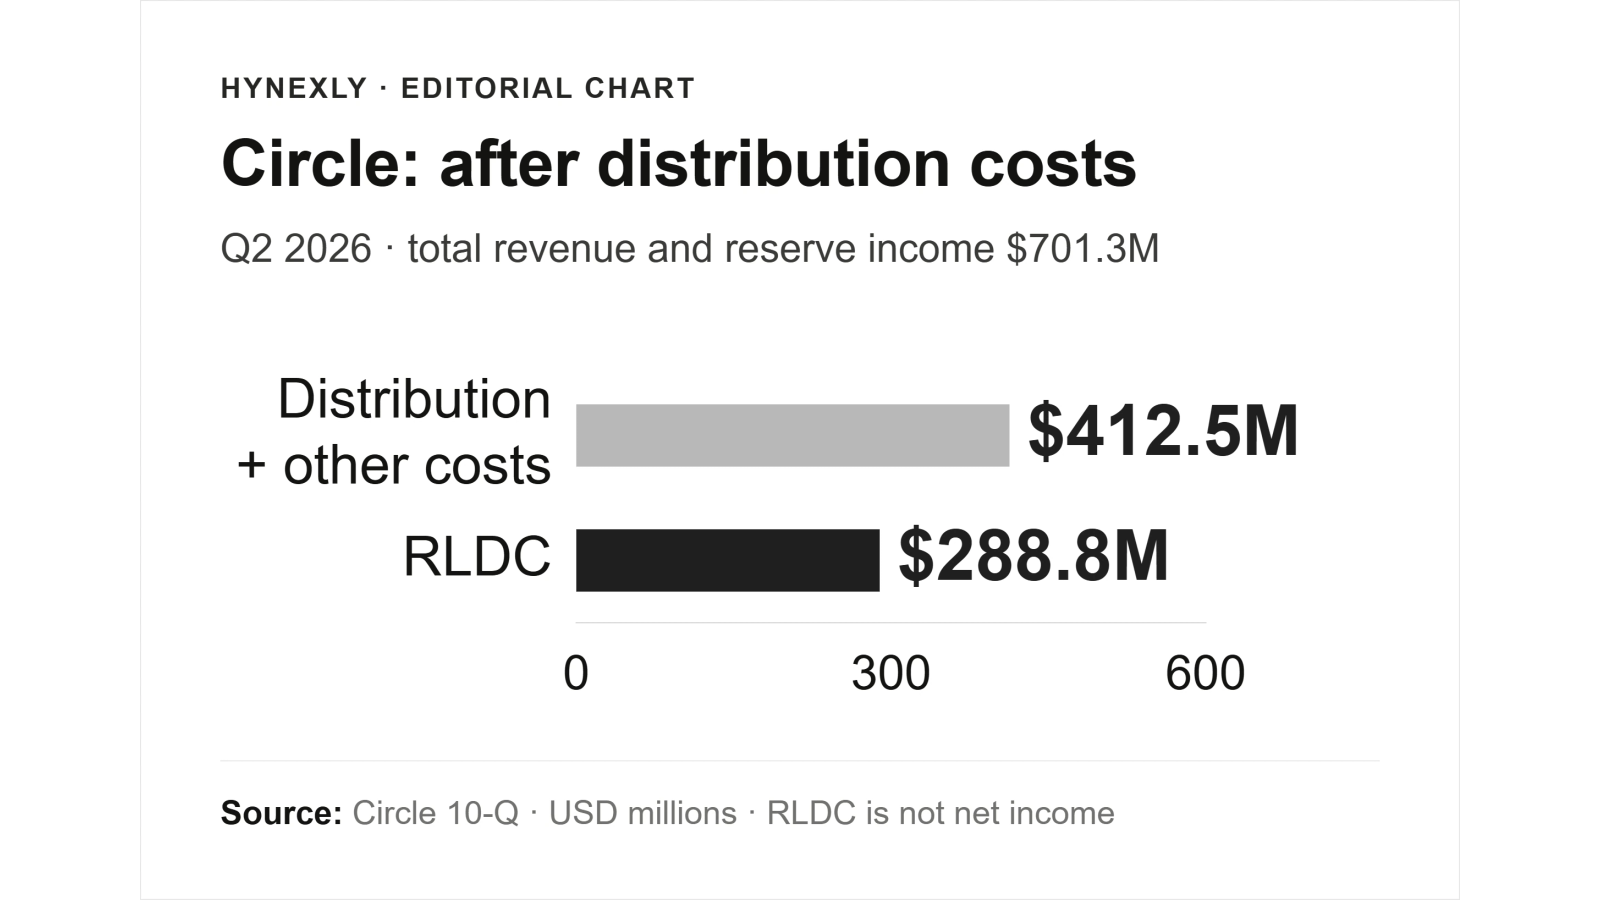
Circle Gets Binance's Investment—and Pays for Distribution
Binance's $100M investment and Arc's launch are real milestones. Circle's filings show why funding, paid distribution and repeatable earnings need separate tests.
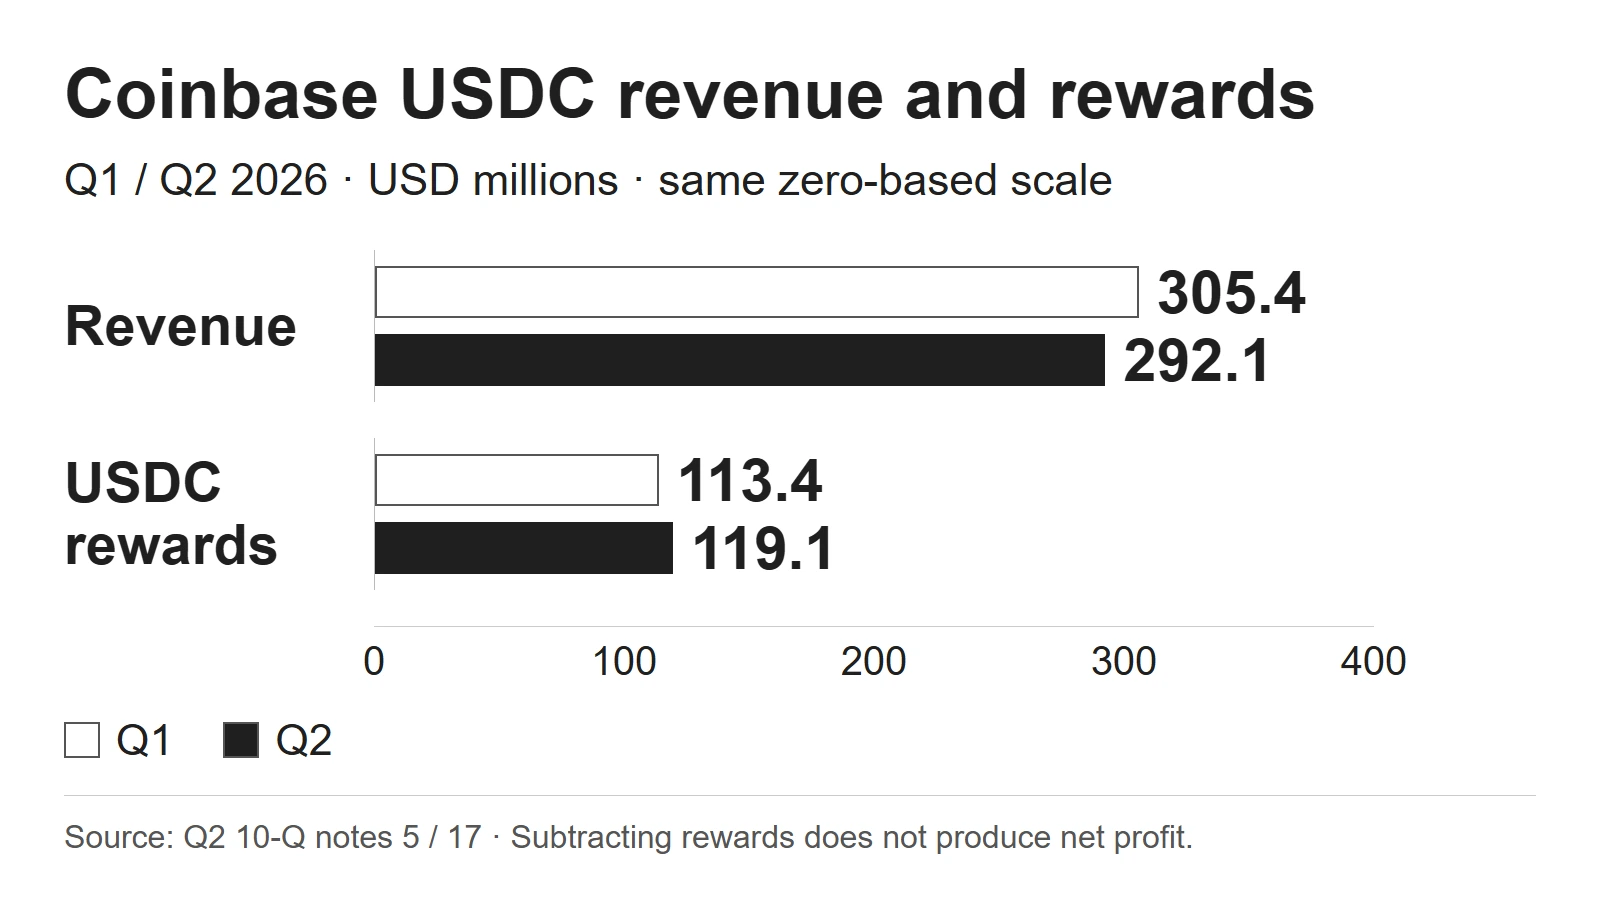
Coinbase's USDC Revenue Chart Leaves Out a Key Cost
Coinbase's stablecoin business cushions trading, but customer rewards and new shares complicate the benefit to shareholders. A Q2 filing check explains both.
A better way to read the numbers
Start with a question. Learn what to check in the next filing.
You should be able to check our work.
We link to the original documents, show our calculations, and explain what could change our view. Analysis is not a personal investment recommendation.
How we research