Green Transition
Carbon Credit Prices Separate Policy Signal From Proxy Risk
EU MSR policy design, report-grade price dispersion, and listed-proxy behavior don't tell one story. A 2026 read on what's actually moving carbon prices.
Thesis
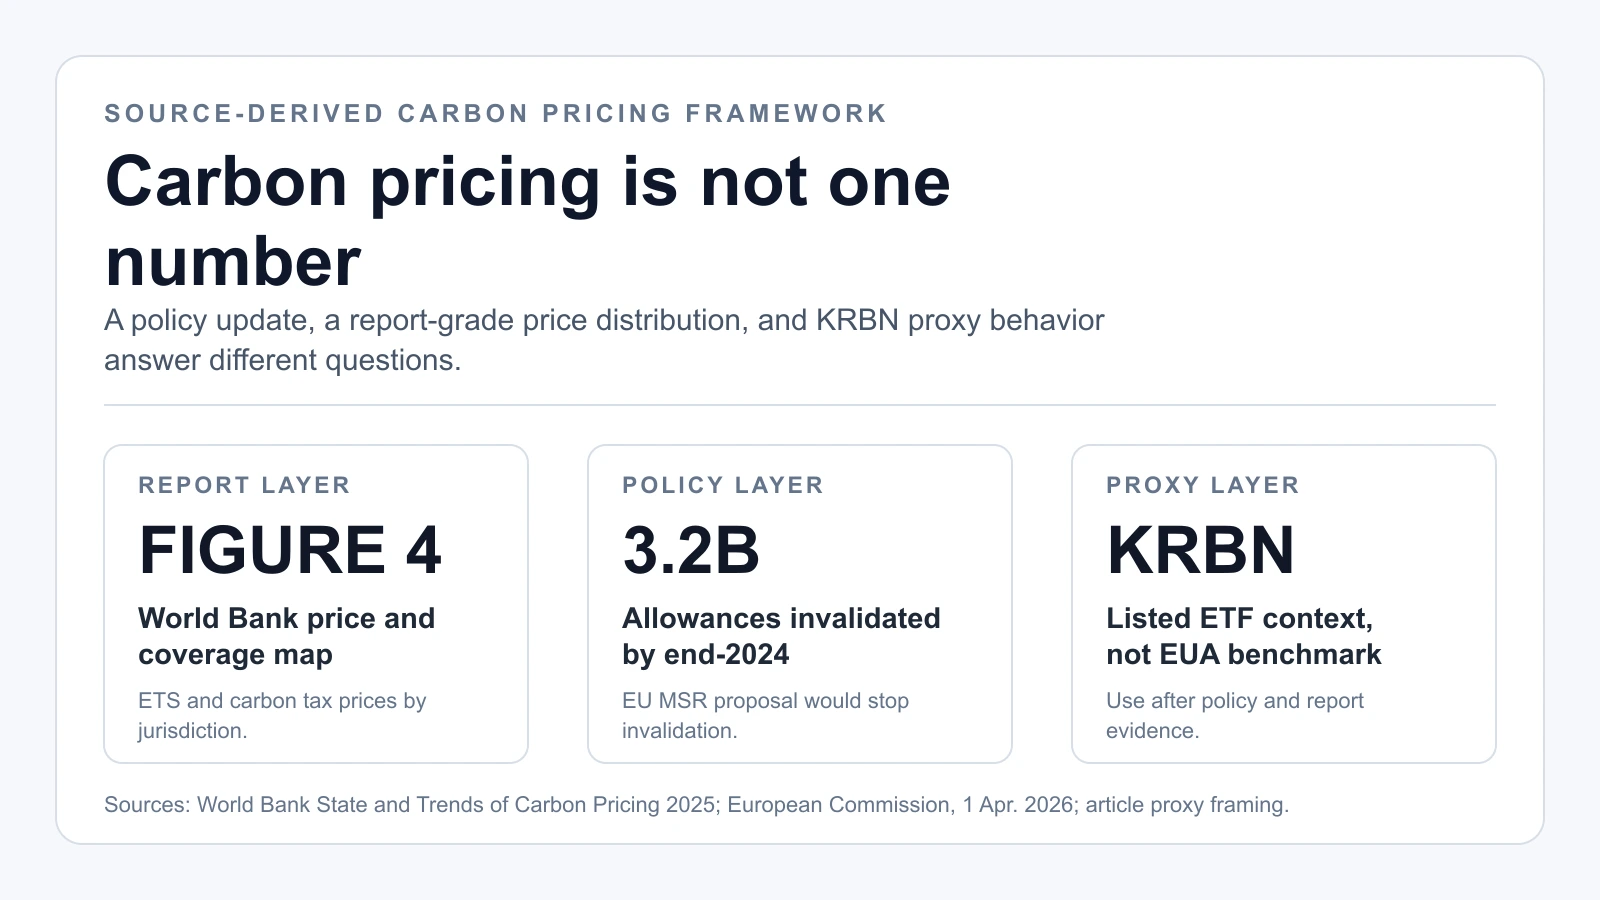
The headline version speaks of a carbon price, singular; page 28 of the ICAP Status Report 2025 shows 2024 covered emissions split across distinct price bands, which a single benchmark number flattens into nothing. That contradiction set the order of work. The European Commission's 1 April 2026 MSR update was checked against World Bank Figure 4 price-and-coverage context and the source-derived framework card now used as the hero, with KRBN held strictly to its role as a listed proxy. Only after we had pinned each of those layers separately did the comparison below read as fair rather than a blended headline.
Most coverage of carbon credits collapses three distinct questions into one:
- what policy architecture says,
- what market-structure reports show,
- what listed-market proxies are currently pricing.
Keeping those layers separate reduces the risk of treating a policy update, a coverage statistic, and a proxy-price move as the same repeatable signal.
Source Evidence Snapshot
The hero image now uses a source-derived framework card, so this section keeps the body evidence focused on policy design and price-band dispersion.
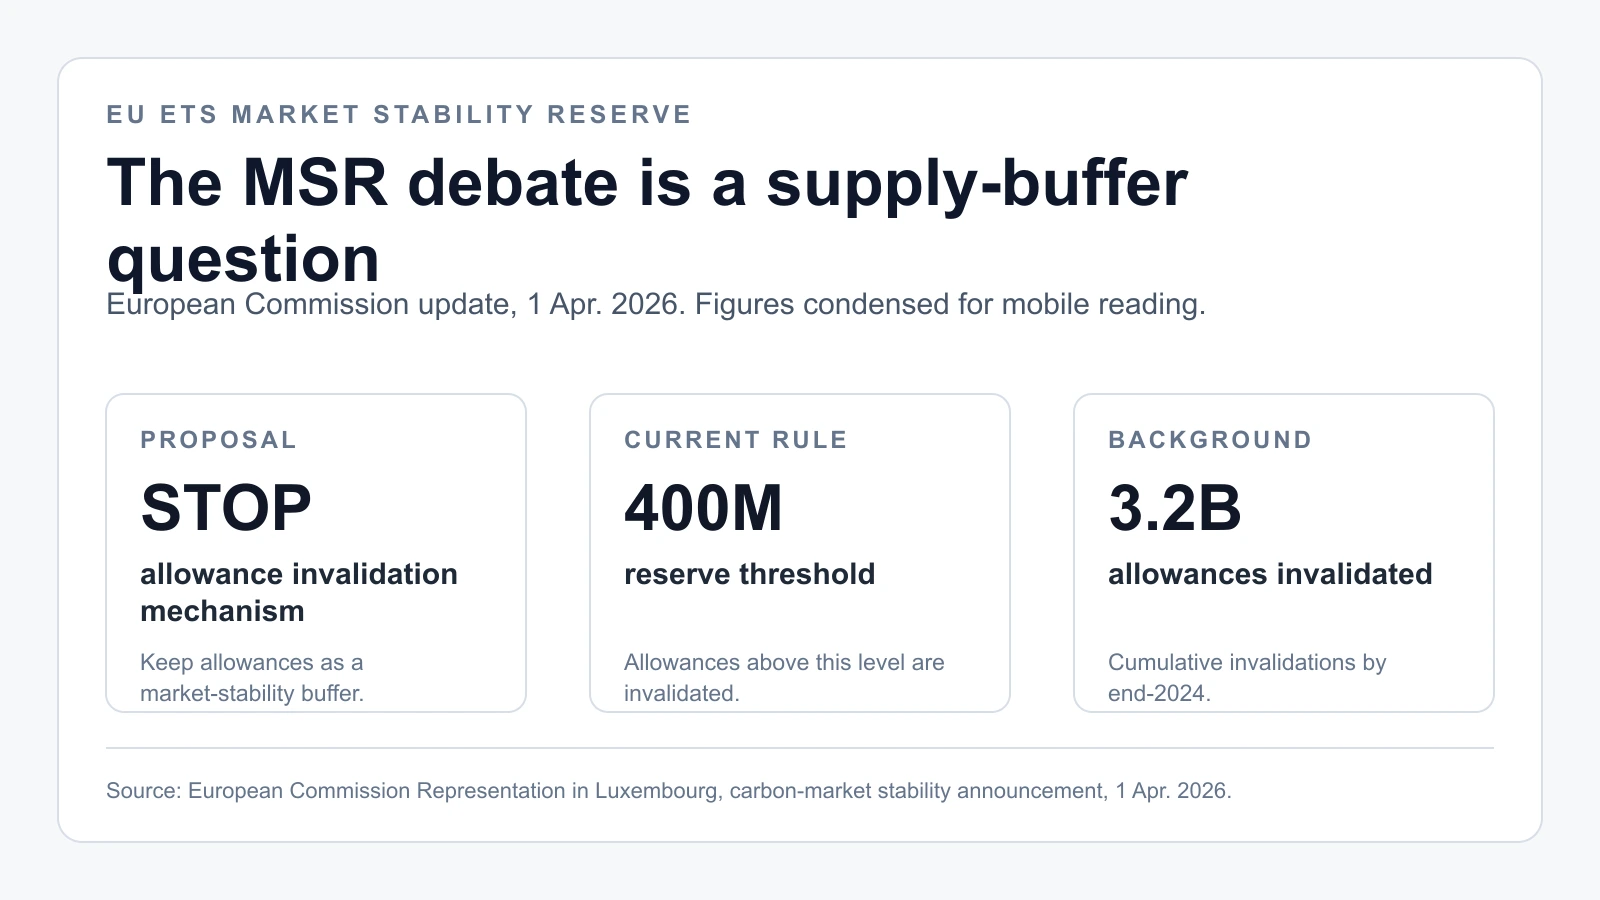
Source-derived render based on the European Commission's carbon-market stability announcement, 1 April 2026: the proposed MSR amendment to stop allowance invalidation, the 400-million reserve threshold, and the 3.2 billion allowances invalidated by end-2024. The wording and numbers are the source's; the layout is ours.
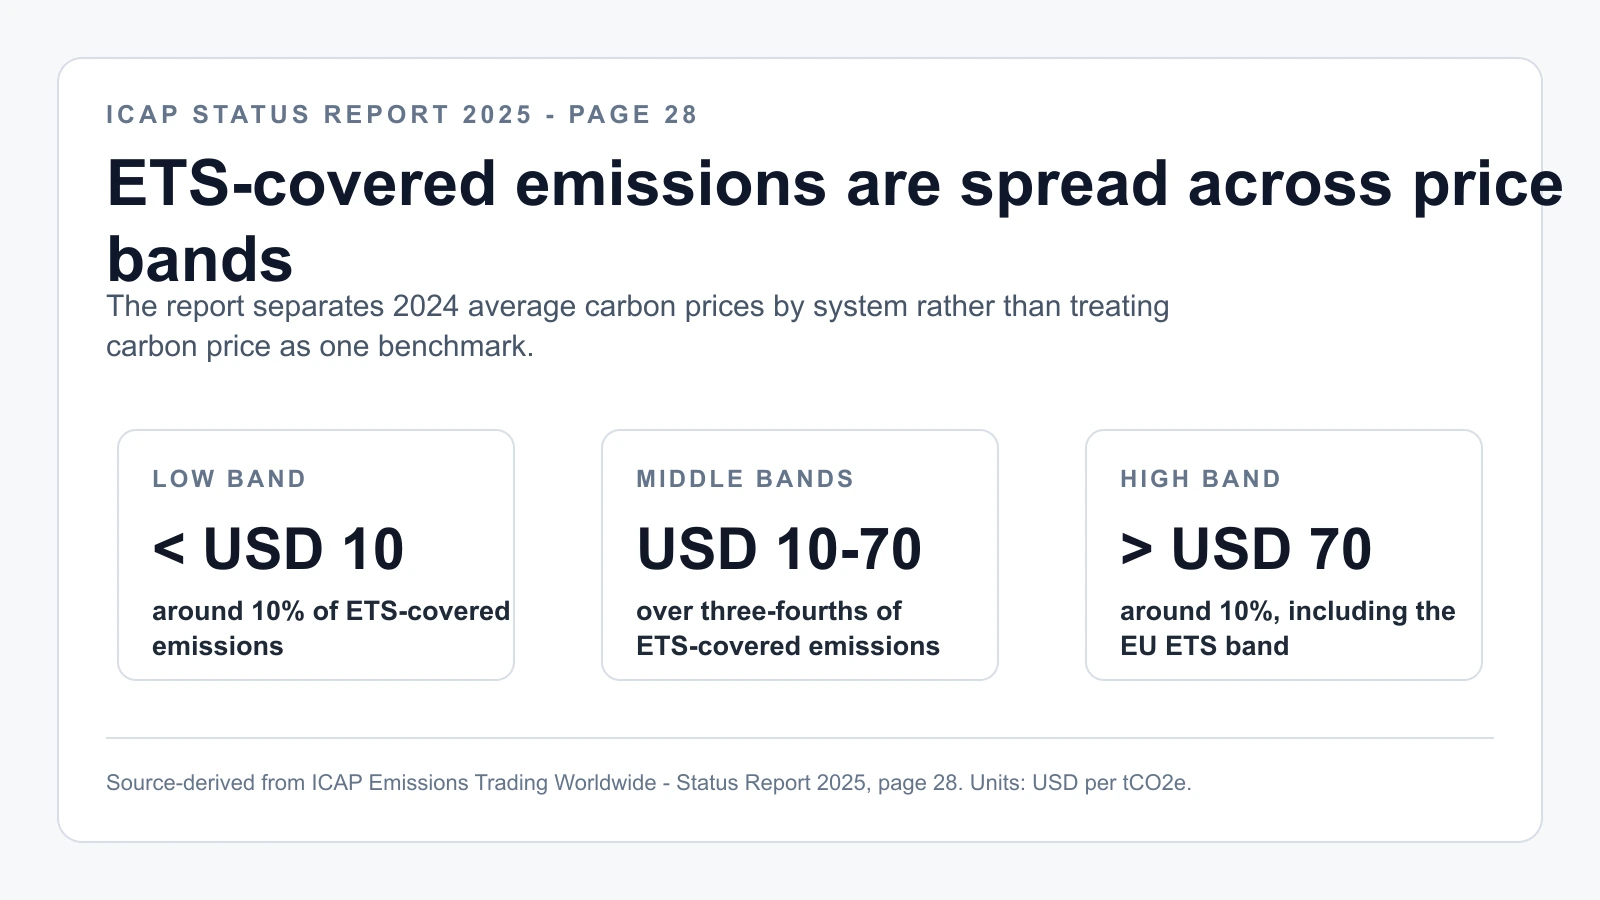
Source-derived card using ICAP Emissions Trading Worldwide - Status Report 2025 (PDF), captured 2026-04-09, page 28, which shows 2024 price-band distribution across ETS-covered emissions. The price bands and percentage wording are the source's; the layout is ours.
The ICAP Status Report's page 21 world ETS map is kept as linked context rather than another image: Source note: ICAP Emissions Trading Worldwide - Status Report 2025 (PDF), checked 2026-04-08 for systems in force, under development, and under consideration.
The World Bank dashboard is kept as a linked source note rather than a fourth map-style capture: Source note: World Bank Carbon Pricing Dashboard, checked 2026-04-08 for instrument-count and jurisdiction context.
This narrower visual set is intentional. The article does not need every available map on the page; it needs one policy layer, one price-dispersion layer, and a clear boundary between report-grade evidence and listed-proxy behavior.
What These Captures Support
1) Policy transmission remains active, not static
The April 2026 Commission source-page update documents an explicit MSR amendment pathway and reiterates rules-based architecture. That matters because pricing paths in compliance markets respond to expected future supply management, not only to current-year emissions prints.
2) Coverage and instrument breadth are not anecdotal
The World Bank Figure 4 source context and ICAP report note keep coverage grounded in report-grade sources rather than a single carbon-price headline. Implementation status still varies by jurisdiction and system stage, which is why policy design matters before proxy-price interpretation.
3) Carbon-price dispersion across systems is wide
The hero framework card, World Bank Figure 4 source context, and ICAP price-band card show meaningful cross-system dispersion. Treating "carbon price" as a single number without system context is analytically weak.
One number in the policy capture is large enough to anchor the supply-management read on its own: the Commission background line states 3.2 billion allowances were invalidated by end-2024. That figure is the cumulative stock the MSR has already removed, not an annual flow — so the right way to size it is per year. Spread evenly across the roughly nine years from the MSR's 2015 legislative origin through end-2024, that is about 3.2 billion ÷ 9 ≈ 0.36 billion, or on the order of 350-360 million allowances withdrawn per year as a rough average. The mechanism is not a one-off headline; it is a recurring drain that compounds. To turn that withdrawn stock into a true share-of-supply, the reader should pull one input the post does not contain — the EU ETS total cap or annual auction volume for the same window — and divide; we deliberately do not supply that denominator here rather than invent it. Until that figure is in hand, the defensible statement is the directional one: the invalidated stock is measured in billions, so expected-supply management is a first-order price input, not a footnote.
4) Listed proxy behavior is a separate layer
KRBN can help readers observe listed-market carbon exposure, but it remains a proxy layer. It should be read after the policy and report evidence, not as a direct substitute for EUA benchmark pricing or system-specific allowance data.
Listed Proxy Context
Risk Framing Before Price Interpretation
- Policy-risk timing: market pricing can move ahead of finalized legislative adoption.
- Cross-system basis risk: multiple compliance systems do not move identically.
- Proxy mismatch risk: listed ETF behavior can diverge from single-contract benchmark behavior.
- Liquidity and positioning shocks: short windows can overstate directional conviction.
Quarterly Evidence Refresh Workflow
A practical way to keep this page decision-useful is to run the same evidence loop each quarter instead of rewriting the thesis from scratch:
- Recheck European Commission carbon-market updates for changes to MSR design, buffer logic, and timeline language.
- Recheck report-grade updates (World Bank, ICAP, and equivalent system-level sources) for changes in coverage, instrument counts, and cross-system price dispersion.
- Recheck listed proxy behavior only after policy and structure checks are complete, so price action is interpreted in context rather than treated as stand-alone proof.
- Record what changed versus what did not change, and update scenario weights only when source text or source figures actually moved.
This routine helps avoid a common error in carbon coverage: treating every short-term move in listed products as a structural policy signal. In many cases, policy architecture is unchanged while positioning and liquidity are driving the tape.
What This Package Does Not Prove
- It does not prove a single deterministic path for EU allowance prices.
- It does not prove that all compliance systems will converge to one price regime.
- It does not prove that KRBN should track benchmark EUA futures one-for-one in every market regime.
What it does provide is a reproducible foundation for separating policy updates from proxy-market noise. That distinction usually improves risk framing and prevents overconfident interpretation of listed-product moves.
What Changes the Carbon-Price Read
A useful 2026 carbon-pricing workflow is to separate policy documents, report-grade system data, and listed proxy behavior. The captures above make that separation explicit and auditable.
Related reads: