Green Transition
NextEra Energy's clean-energy scale is only worth what its backlog actually converts
Clean-energy scale isn't automatically equity evidence. A filing-anchored read on NextEra's FPL/NEER structure, backlog, and the policy and rate risks around it.
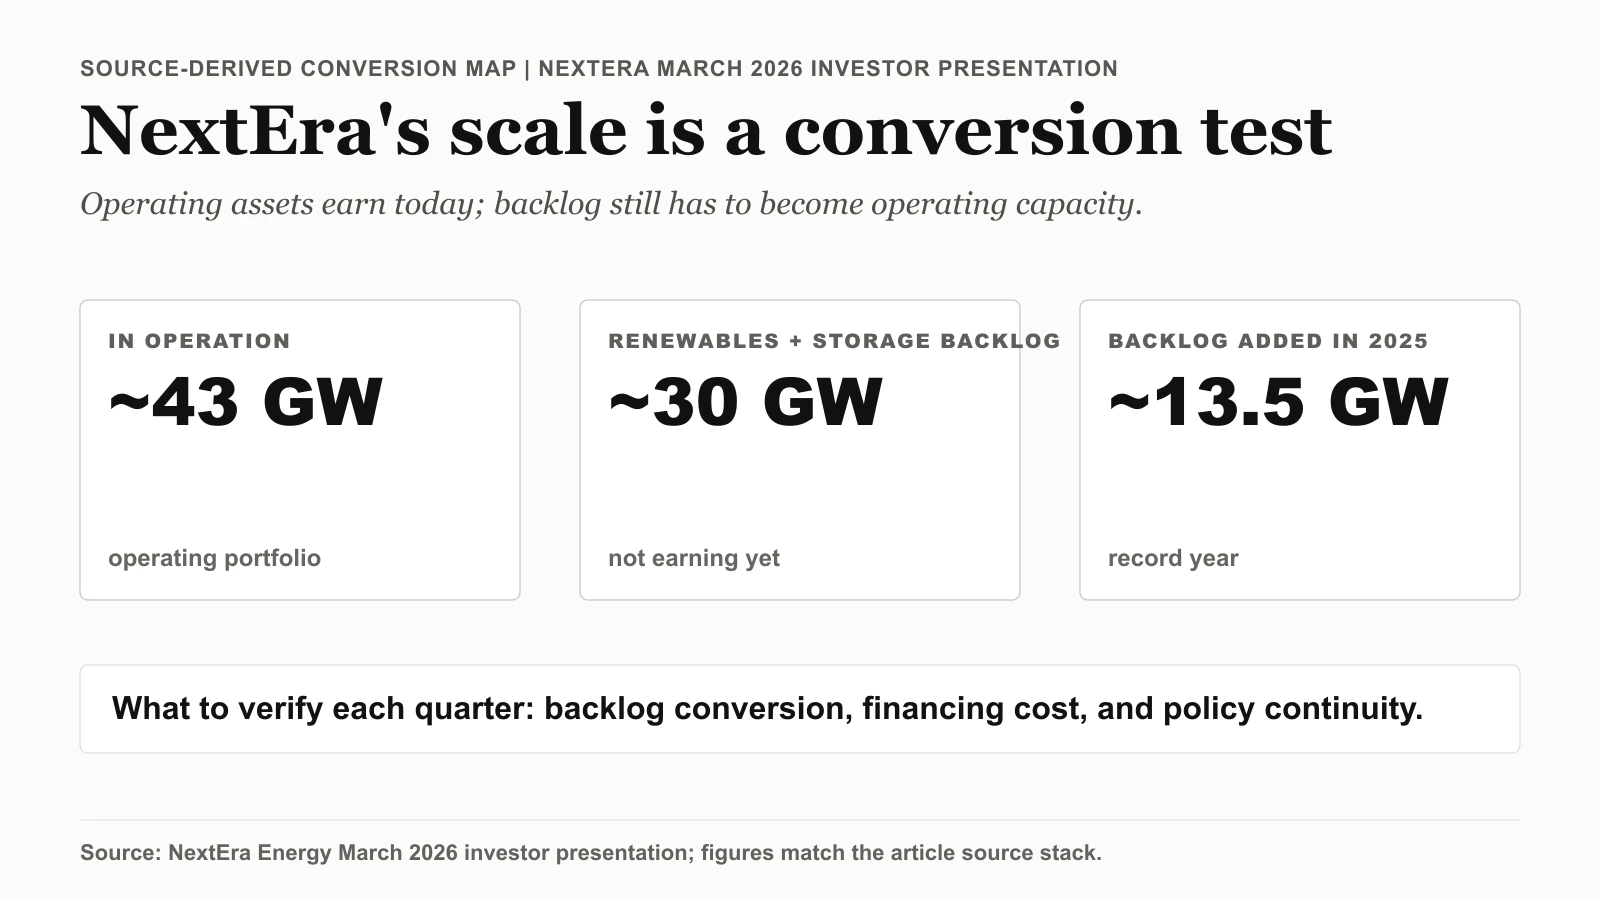
Roughly 30 GW of renewables and storage backlog — earning nothing yet — sits on the same March 2026 investor-presentation slide as the approximately 43 GW already in operation. That one slide is what settled a headline framing that had been pulling in two directions, and it set the order in which we worked the primary documents. First the SEC-filed 2024 annual report, to separate FPL from NEER. Then the January 27, 2026 Q4 release, to check the backlog figure and the $3.92 to $4.02 adjusted EPS range against a $3.71 base. The policy-incentives and interest-rate-risk sections we left as linked annual-report notes instead of re-cropping them; the open question here is conversion, not narrative.
Thesis
NextEra Energy reads more cleanly as a conversion problem than as a broad clean-energy slogan. The filing-grade evidence separates the regulated utility base (FPL) from the renewables and storage development engine (NEER), while the issuer materials size the backlog that still has to become operating assets.
That makes the 2026 question concrete: whether the disclosed renewables and storage backlog can convert through financing, policy, and execution constraints without blurring the utility and development stories into one generic theme. This refresh anchors that question on filing-grade and issuer-grade evidence:
(Source: SEC EDGAR - NextEra Energy 2024 Annual Report PDF)
- SEC annual-report structure and risk disclosures,
- investor-presentation operating and pipeline visuals.
Source Evidence Snapshot
The hero card already carries the March 2026 operating-portfolio and backlog figures, so the evidence stack below keeps two roles visible: legal business structure and near-term backlog/guidance. Policy and rate-risk disclosures remain linked source notes rather than extra full-page text crops.
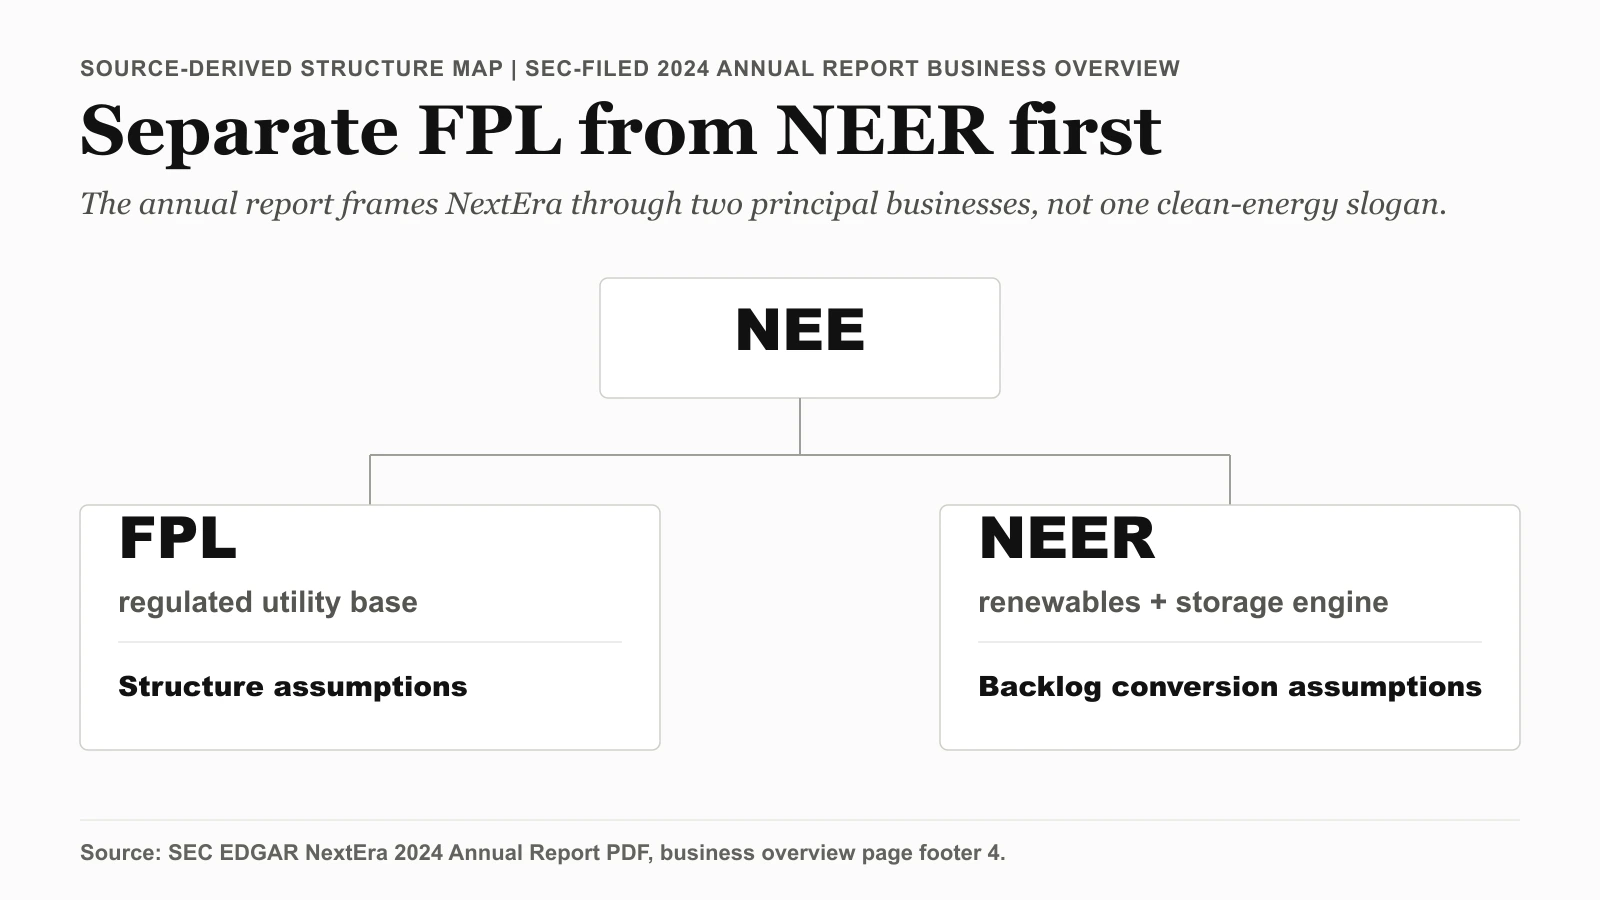
Source-derived structure map based on SEC EDGAR - NextEra 2024 Annual Report PDF, captured 2026-04-07, business overview page (footer 4) stating value creation through two principal businesses (FPL and NEER) with organizational chart. The source defines the structure; the layout is ours.
Policy and financing sensitivity are kept as cited filing notes instead of two additional full-page text captures: Source note: SEC EDGAR - NextEra 2024 Annual Report PDF, captured 2026-04-07, policy-incentives section page (footer 15) and Interest Rate Risk subsection page (footer 54).
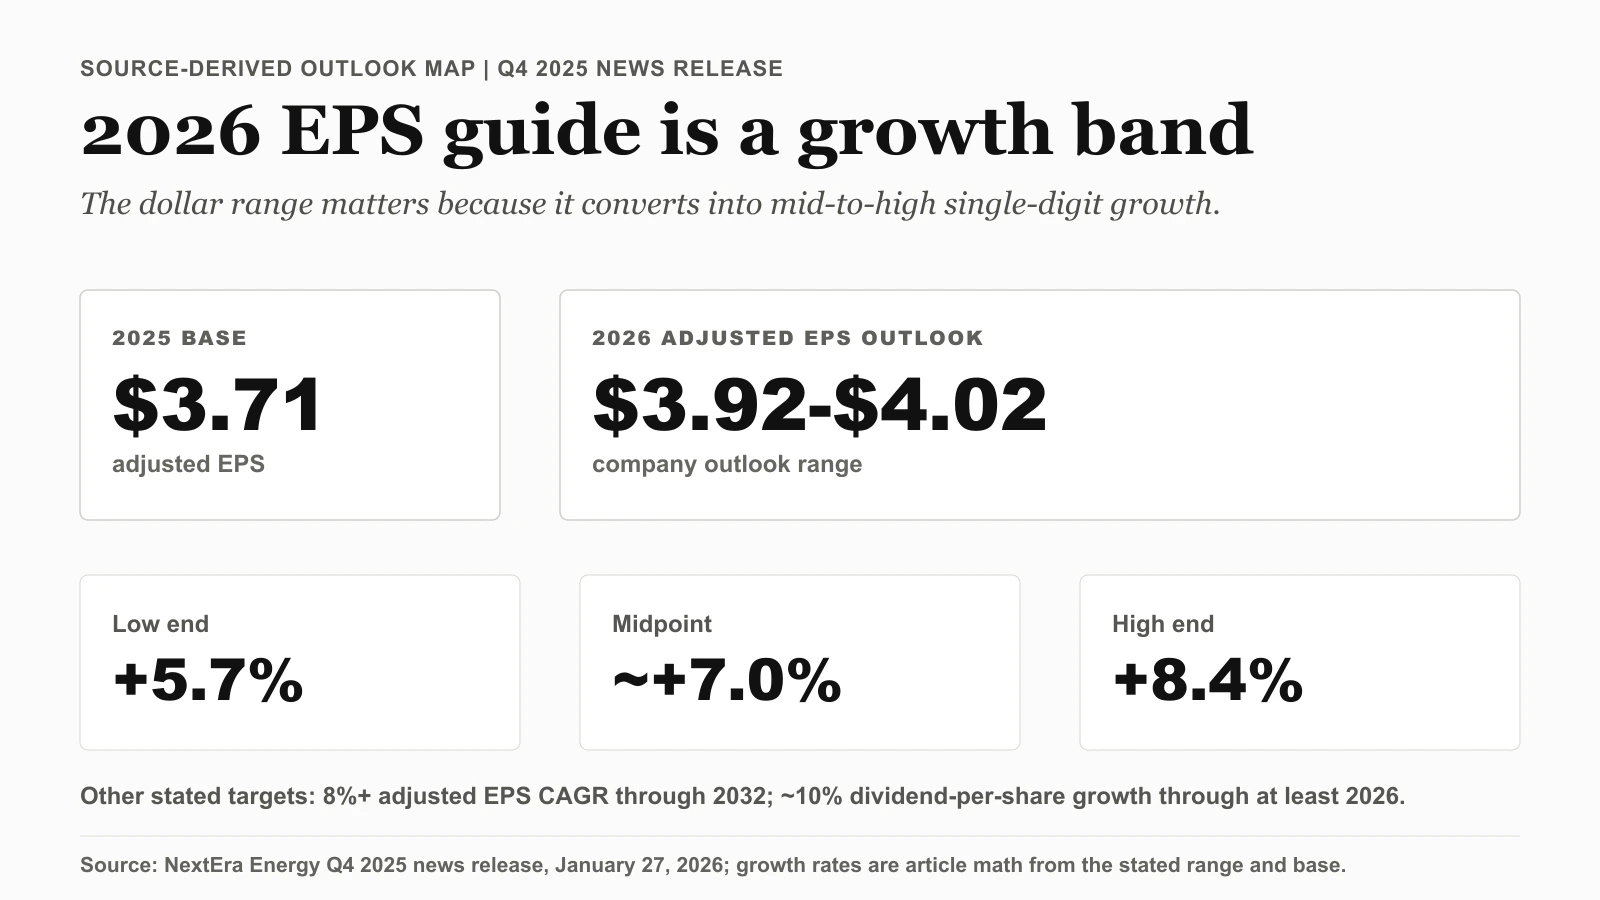
Evidence card based on NextEra's 2026 outlook: figures from the Q4 2025 news release (PDF), captured 2026-04-09 (2026 adjusted EPS $3.92-$4.02 off a $3.71 2025 base; 8%+ EPS CAGR through 2032; approximately 10% dividend-per-share growth through at least 2026). The growth rates are article math from those figures; the layout is ours.
What These Captures Support
1) Structure is explicit, not inferred
The SEC-filed annual-report overview page directly frames NextEra through its two principal businesses (FPL and NEER) and provides an organizational chart. This is the baseline for segment-level modeling.
2) Backlog and demand messaging are currently management-led and quantified
The Q4 2025 news release reports a renewables and storage backlog near 30 GW, and the March 2026 investor presentation shows approximately 43 GW already in operation along with roughly 9 GW of large-load discussions on the FPL side. These are issuer-stated figures from dated documents, not analyst estimates. They size the conversion question; they do not by themselves prove how much of the backlog will reach commercial operation or on what timing.
3) Policy and financing sensitivity are documented in separate disclosure channels
The annual report has a dedicated policy-incentives section for clean-energy credits and a dedicated interest-rate-risk section. Keeping them as cited disclosure notes avoids a cluttered evidence wall while preserving the analytical distinction.
4) Near-term earnings range is stated, but still conditional
The Q4 2025 release states a 2026 adjusted EPS outlook range of $3.92 to $4.02 off a 2025 base of $3.71. Work that band against its own base and the guidance stops being a flat reference point: $3.92 / $3.71 is roughly +5.7% at the low end, $4.02 / $3.71 is roughly +8.4% at the high end, and the $3.97 midpoint implies about +7.0% adjusted-EPS growth. So the entire guidance range is one of mid-to-high single-digit growth — there is no scenario inside the band where 2026 earnings merely hold flat. The $0.10 spread between the rails is about 2.7 percentage points of growth, and that gap is precisely what backlog conversion, financing cost, and policy continuity decide; the floor is already a growth number, the question is only how much growth converts. This is a stated guidance band from a dated filing, not a guaranteed outcome — but reading it as a range of growth rates, rather than a static dollar figure, is what makes drift within the band decision-useful.
What the Street is Pricing
What This Package Does Not Prove
- The captures do not prove what fraction of the disclosed backlog will reach commercial operation, or on what timing.
- They do not prove a specific valuation output or exact share-price conclusion for
NEE. - They do not prove that policy or financing conditions will stay constant across the forecast horizon.
Keeping this distinction visible separates issuer disclosures from modeled outcomes.
Evidence-to-Model Mapping
A practical way to use this page is to connect each evidence block to one explicit model assumption:
- Structure assumption: use the SEC business-overview page to keep
FPLandNEERpathways separate in forecasts. - Backlog assumption: use the dated Q4 2025 release figures and March 2026 presentation numbers as the issuer-stated input, then apply explicit conversion haircuts in the model.
- Rate sensitivity assumption: use the filing's interest-rate-risk section to stress test funding-cost effects on returns.
- Policy sensitivity assumption: use the filing's clean-energy policy-incentives section to map upside and downside around tax-credit continuity.
This mapping framework is useful because it forces each thesis component to stay tied to a named source instead of generalized clean-energy sentiment.
Quarterly Verification Workflow
To keep this page decision-useful, update it on a fixed cadence with the same evidence checks each quarter:
- Recheck the most recent quarterly news release for backlog and earnings-range updates.
- Recheck updated investor-presentation slides for changes in portfolio mix, demand framing, and large-load pipeline language.
- Recheck the latest filing set for risk-factor language drift in policy incentives and financing exposure.
- Record what changed and what did not change, then revise scenario weights only where evidence moved.
Running the same checklist each quarter reduces confirmation bias. It also helps separate true operating change from temporary market narrative shifts.
Risks to the Thesis
For editorial tracking, keep three distinct scenario buckets:
- Base case: filings and presentations remain consistent with current backlog framing and disclosed earnings range, and conversion runs roughly in line with stated timing.
- Financing-stress case: rate or capital-cost moves outside the range implied by current disclosures, slowing project economics or shifting funding mix.
- Policy-stress case: implementation-level changes around incentives create slower conversion or narrower economics for portions of the pipeline.
This structure does not predict exact prices. It creates a repeatable process for tying thesis updates to source changes rather than to single headlines.
What Flips the Call
NextEra's 2026 setup is best tracked as a three-part evidence loop: business structure (FPL/NEER), pipeline conversion signals, and financing-policy sensitivity. The strongest updates come from filing-grade and issuer-grade refreshes, not from headline-only sentiment.
Related tools: use the dividend reinvestment calculator to separate dividend-growth mechanics from stock selection, and the portfolio rebalancing calculator to keep utility exposure aligned with a target weight as rate sensitivity changes.
Related reads: