Green Transition
Enphase Already Fixed Its Income Statement While SolarEdge Is Still Repairing Its Own
Enphase posted positive Q4 2025 net income; SolarEdge's earnings repair is still unfinished. Where ENPH and SEDG actually diverge in 2026.
(Sources: Google Finance - Enphase Energy, Google Finance - SolarEdge Technologies, Enphase Energy 2024 Form 10-K, SolarEdge Q4 and Full Year 2025 Financial Results)
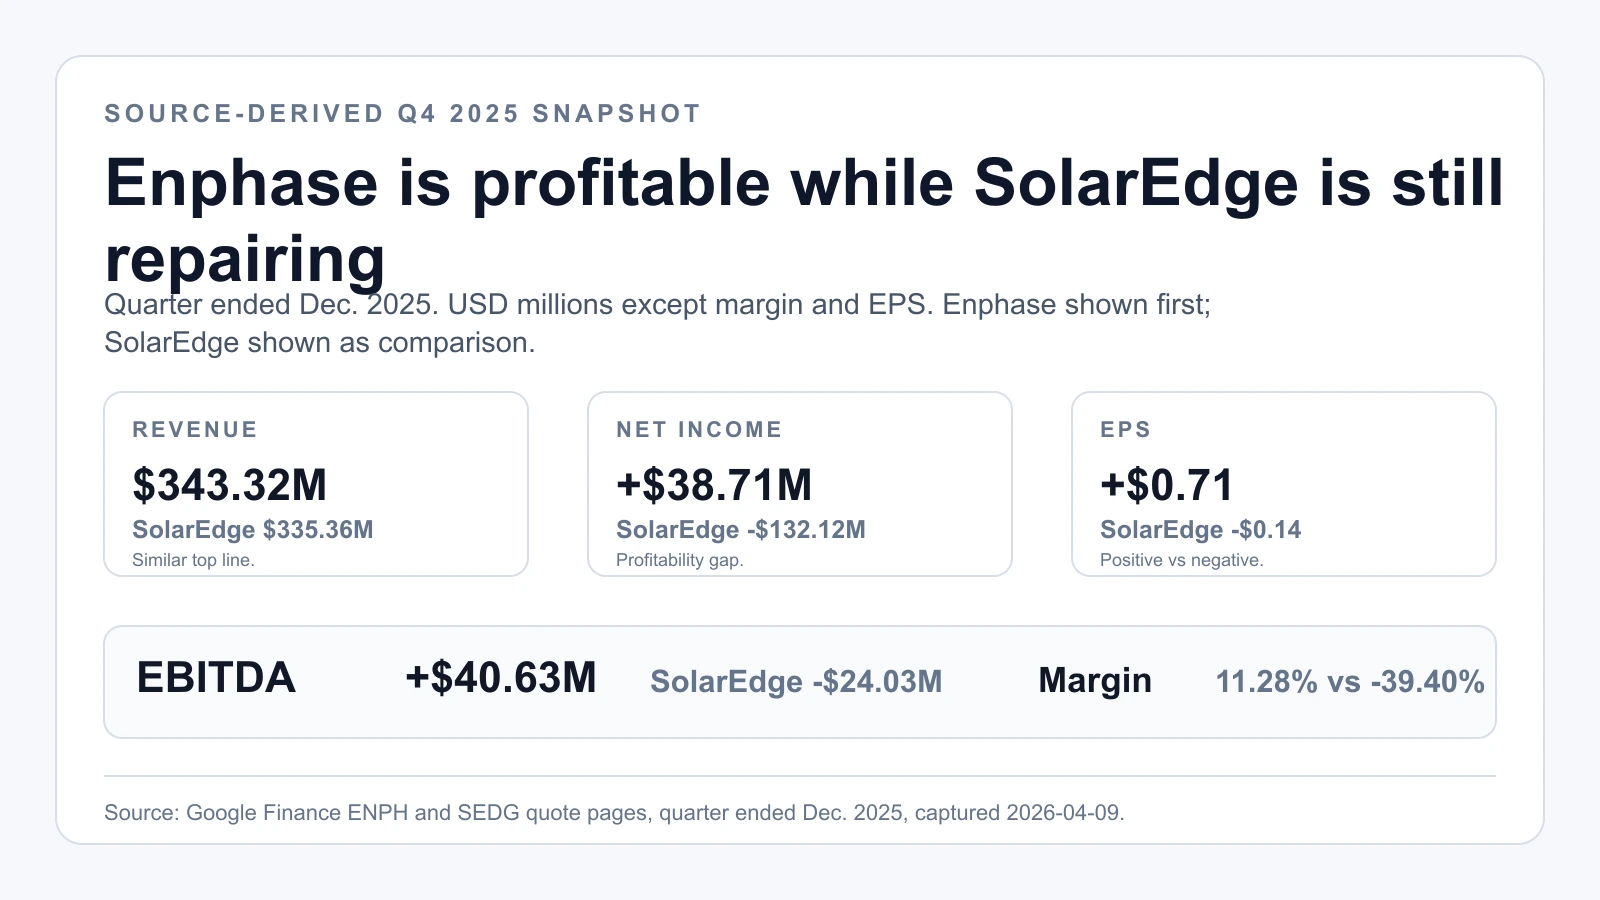
Are Enphase and SolarEdge even in the same financial condition anymore? Their Google Finance quote pages, captured side by side on 2026-04-09, answer that in three rows. Revenue says yes — $343.32 million against $335.36 million, close enough to compare directly. Net income says no: $38.71 million for Enphase, -$132.12 million for SolarEdge. Whether that one gap is structural or a one-quarter artifact was the question we carried into Enphase's 2024 Form 10-K and SolarEdge's February 18, 2026 release.
Related reading: The KRBN Wrapper Is the First Check Before Carbon Credit Exposure | What the 2026 FOMC Calendar Says About When Fed Cuts Can Come | Verify Your Broker Before You Pick a Single U.S. Stock
Thesis
The point of putting Enphase next to SolarEdge in 2026 is not to crown whichever ticker has the louder rebound story. It is to separate the company that has already repaired the income statement from the one still asking the market to underwrite a turnaround.
The latest public snapshots make that gap unusually easy to see. On the Google Finance captures taken on 2026-04-09, Enphase showed Q4 2025 revenue of $343.32 million, net income of $38.71 million, and EPS of $0.71. SolarEdge showed Q4 2025 revenue of $335.36 million, net income of -$132.12 million, and EPS of -$0.14.
That is why the comparison matters. These are two companies exposed to the same residential-solar slowdown, the same financing headwinds, and the same installation-cycle uncertainty. But one is still posting positive earnings in the quarter, while the other is still trading on the promise that better revenue and cash flow will eventually become durable profitability.
Source Evidence Snapshot
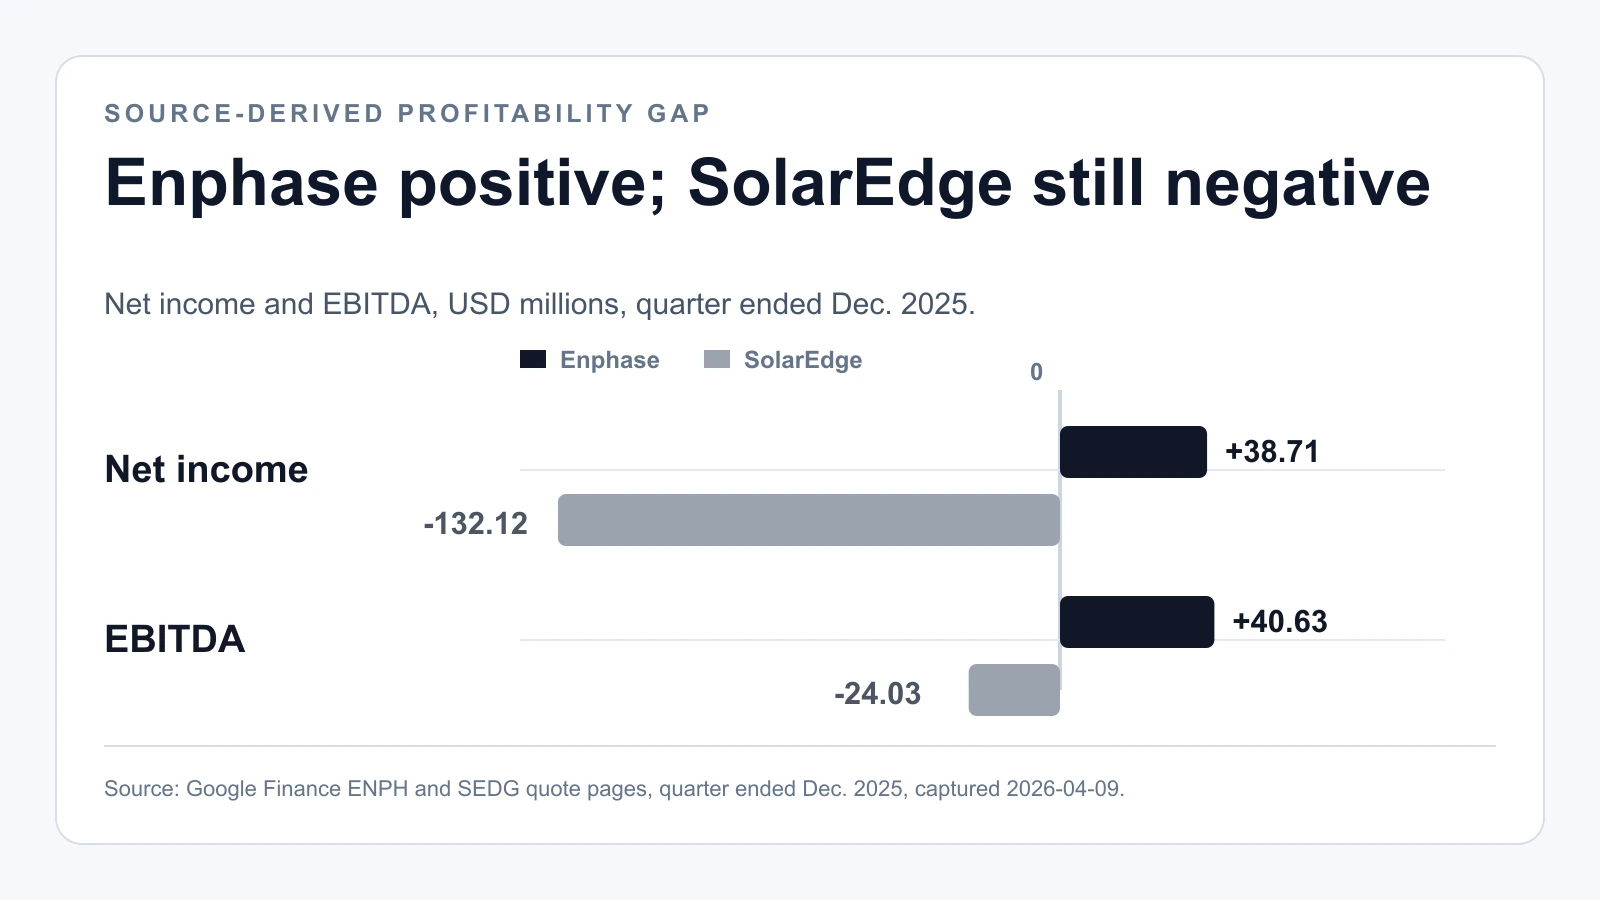
Source-derived chart of the profitability gap — figures from Google Finance - Enphase Energy and Google Finance - SolarEdge Technologies, quarter ended Dec 2025 (captured 2026-04-09): Enphase net income +$38.71M / EBITDA +$40.63M versus SolarEdge −$132.12M / −$24.03M. The numbers are the source's; the layout is ours.
The high-level takeaway from the side-by-side capture is simple. Revenue is now similar enough to compare directly, but profitability is not. Enphase stayed positive on both net income and EPS. SolarEdge did not.
The repeated single-company quote captures are intentionally removed from the body because the paired panel already isolates the same three rows. Enphase's side of that panel shows a profitable quarter despite weak end-market conditions. SolarEdge's side shows that the rebound was real enough to monitor, but not complete enough to call earnings repair finished.
What Enphase's Official Filing Says About the Downturn
The official filing matters because Enphase's quarter snapshot alone does not explain why the equity setup became so controversial. Its 2024 Form 10-K does.
In the annual report, Enphase said net revenue fell to $1.33 billion in 2024 from $2.29 billion in 2023. The filing explicitly says net revenue decreased by $960.4 million, or 42%, and that the decline was driven primarily by a 58% drop in microinverter units shipped. The same discussion points to high interest rates, elevated channel inventory, and California's NEM 3.0 transition as the core demand headwinds.
That context is important because it explains why Enphase can still look better than SolarEdge on current profitability while still being far from an easy setup. The company's problem is not that the market doubts the product category exists. The problem is that the category remains stuck in a financing- and inventory-heavy downturn.
So the Enphase resilience case in 2026 is narrower than it used to be. It is not "solar is back." It is "the company with the cleaner balance sheet and the still-profitable quarter should survive the demand trough better than weaker peers."
What SolarEdge's Official 2025 Release Actually Supports
SolarEdge's official February 18, 2026 release is stronger than the simple downside case admits. The company said fourth-quarter 2025 revenue was $335.4 million, that this marked 70% year-over-year revenue growth, and that operating cash flow reached $52.6 million while free cash flow reached $43.3 million. The same release said cash and investments net of debt rose to $244.2 million by year-end 2025.
Those are real improvement signals. They explain why the stock still gets treated as a live turnaround candidate rather than a dead business.
But the same official release also says GAAP net loss was $132.1 million in the quarter. That is the discipline investors still need. Revenue recovery and free-cash-flow improvement are not the same as completed earnings repair. SolarEdge has clearly moved away from the worst part of the collapse, but it has not yet crossed into clean profitability.
That is why the stock can look optically cheap and still remain fragile. The market is not just pricing a rebound in shipments. It is pricing the odds that better volumes, cleaner margins, and tighter cost control eventually line up in the same quarter.
What the Street is Pricing
The captured Google Finance pages also help on valuation framing. At the 2026-04-09 snapshot, Enphase traded around $32.56 with a market cap of about $4.29 billion, while SolarEdge traded around $43.52 with a market cap of about $2.63 billion.
The important point is not the nominal share price. It is that the market is still assigning the larger equity value to Enphase even after its multi-year slowdown — and that the premium is visible once you anchor each market cap to the revenue each company actually reported.
Annualize the captured Q4 2025 revenue and the two valuations separate cleanly. Enphase's $343.32 million quarter runs to about $1.37 billion at a four-quarter pace, so its $4.29 billion market cap is roughly 3.1x annualized sales. SolarEdge's $335.36 million quarter annualizes to about $1.34 billion, so its $2.63 billion cap is closer to 2.0x. The two are now selling almost identical revenue, yet the market pays about half again as much per dollar of Enphase's top line. That is the premium, quantified: it is being paid for the profitable quarter, not for the revenue, because the revenue is effectively the same.
SolarEdge, by contrast, still trades like a turnaround repair case, and its own cash number shows why the multiple is lower. Annualizing the $43.3 million of Q4 free cash flow gives about $173 million, which against the $2.63 billion cap is roughly 15x free cash flow, or about a 6.6% free-cash-flow yield. That is not an expensive multiple on cash generation — but it sits next to a $132.1 million quarterly GAAP net loss. So the market is explicitly paying for cash flow it can already see while withholding payment for earnings it cannot yet see. That asymmetry is the turnaround bet: more operating leverage if reported profit catches up to the cash flow, and a vulnerable equity if demand softens again or margin repair stalls before it does.
Risks to the Thesis
The most honest comparison is:
- Enphase is still the better "quality under pressure" stock.
- SolarEdge is still the better "if the turnaround works, the equity can rerate fast" stock.
That does not mean Enphase is low risk. The 10-K makes clear that the end market stayed weak through 2024 and that the pressure came from real installation economics, not a temporary headline shock. If residential solar financing stays tight, Enphase can remain operationally sound while the stock still disappoints.
It also does not mean SolarEdge should be dismissed. The official Q4 2025 release shows enough operational improvement to justify tracking the name closely. But it is still a turnaround case, not a restored compounder.
What Flips the Call
The public evidence supports a cleaner conclusion than the market chatter usually does.
Enphase still looks like the financially healthier company in a difficult residential-solar market. SolarEdge still looks like the more speculative turnaround case because revenue and cash flow are improving faster than many investors expected, but earnings repair is not finished.
So the 2026 comparison is not really "which company has the better story." It is whether the cleaner profitability case or the still-unfinished turnaround case receives stronger confirming evidence quarter after quarter.