Green Transition
Three Variables Decide the 2026 U.S. Clean Energy Read — Demand, Grid Queues, and Tax-Credit Execution
EIA demand signals, LBNL interconnection-queue friction, and IRS 48E/45Y tax-credit execution rarely move together. A 2026 read on where US clean-energy winners and losers actually split.
Thesis
(Source: EIA Press Release 582 (January 13, 2026))
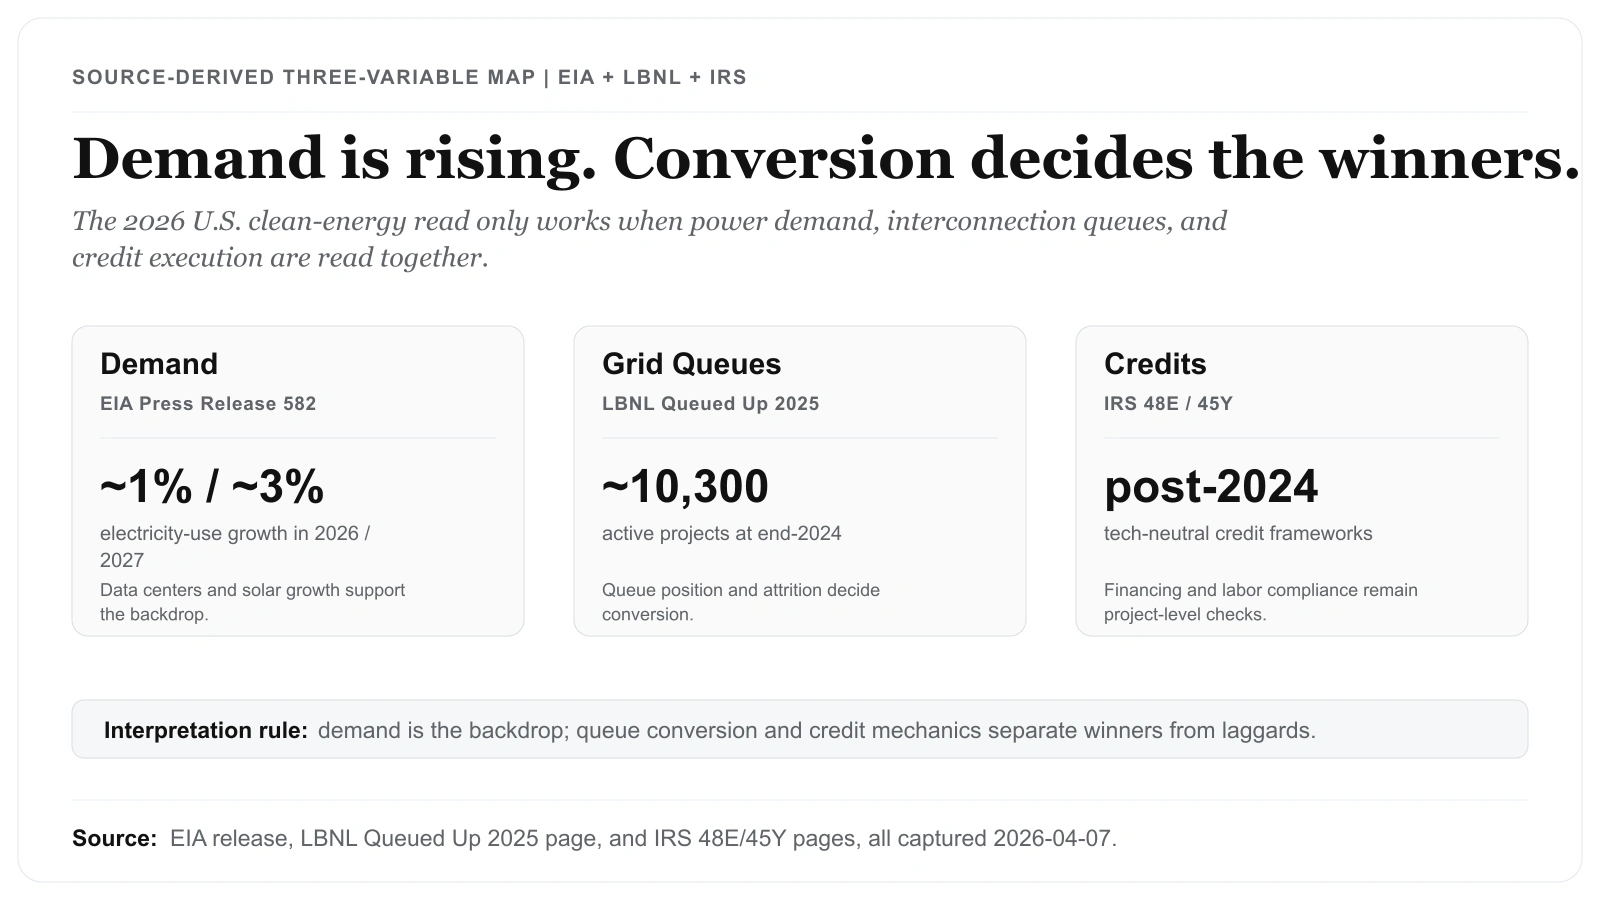
Does stronger power demand, on its own, settle the clean-energy call? The source pages say no. EIA's January 13, 2026 release — the first document opened in this round of reporting — puts its electricity-demand language next to data-center context, and that pairing is what made a one-line "clean energy is up" framing look thin. From there the file grew: the LBNL Queued Up: 2025 Edition page (around 10,300 active projects in queues at end-2024) and the IRS 48E and 45Y pages went up alongside it, all captured 2026-04-07. Lined up, those three primary pages settled the structure, because demand alone never resolved which business models actually convert.
Rather than treat clean energy as a single theme, we read it through three layers that have to agree before any subsegment call holds up:
- demand-side power growth signals,
- grid-connection friction metrics,
- policy-credit mechanics that influence project returns.
That triad explains why the same demand backdrop can help some clean-energy business models while exposing others to financing, queue, or compliance friction.
Source Evidence Snapshot
The lead card now places the EIA demand signal, LBNL queue bottleneck, and IRS credit mechanics into one three-variable map. This section keeps the execution filter as the body visual and leaves the remaining source pages as linked notes, so the article does not stack multiple narrow text captures that repeat the same demand-grid-credit framework.
Source capture: EIA Press Release 582, captured 2026-04-07; the source-derived three-variable map also uses LBNL Queued Up: 2025 Edition and IRS 48E/45Y pages checked the same day. The figures and framework labels come from the cited source pages and article text; the layout is ours.
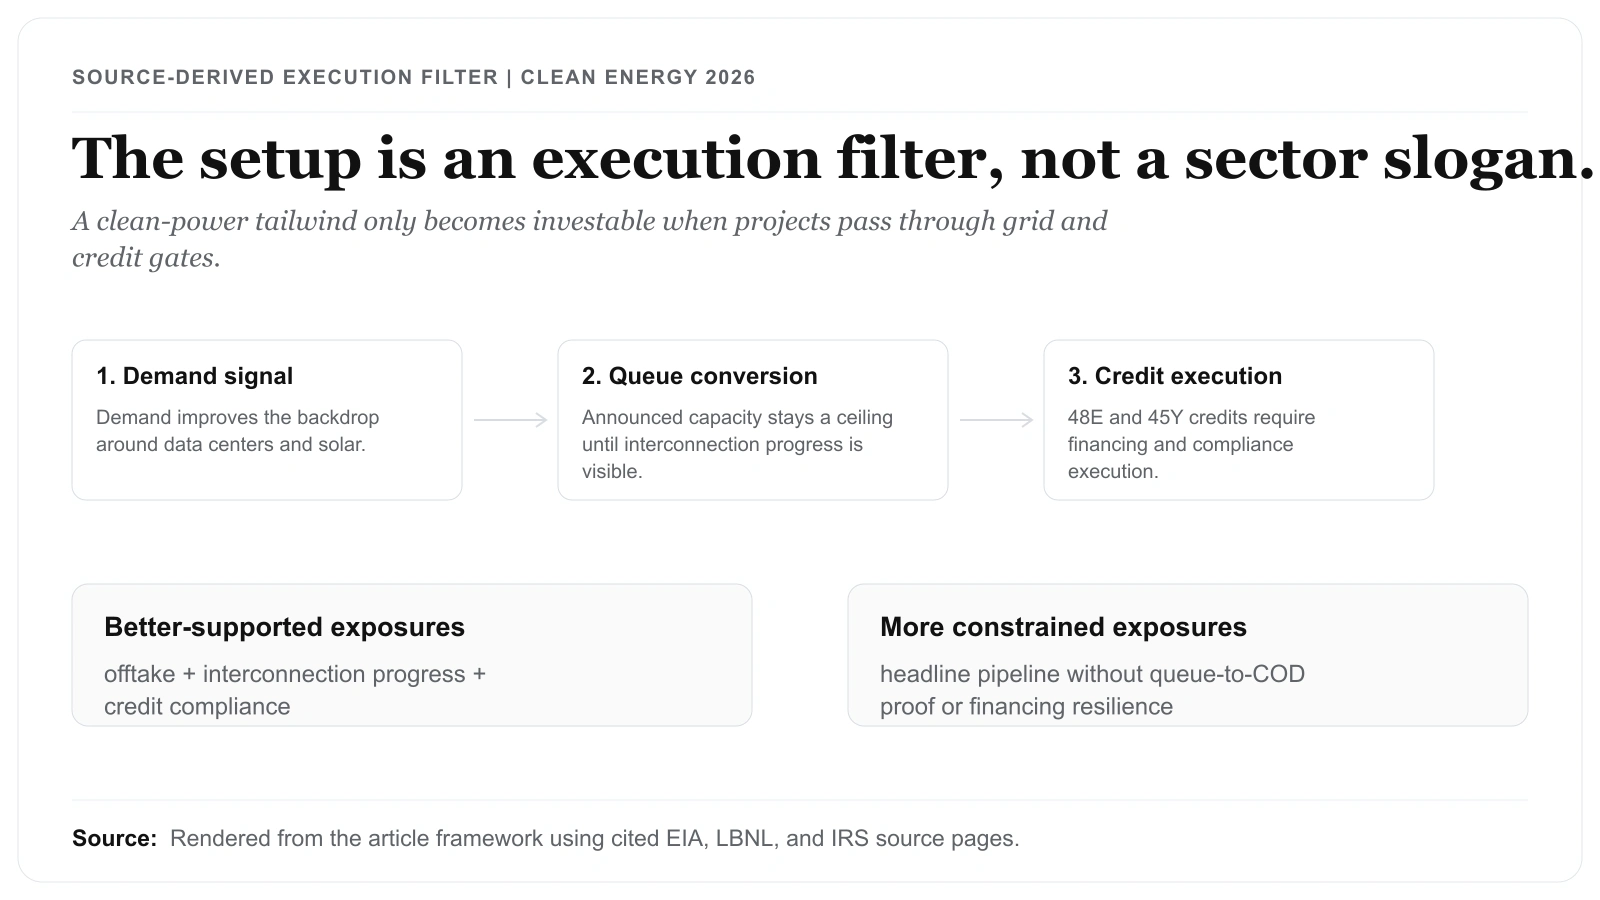
Rendered from the article framework using cited EIA, LBNL, and IRS source pages. The visual separates demand growth, interconnection bottlenecks, and post-2024 clean-electricity credit mechanics from the company-level execution filters that decide which exposures are better supported.
Supporting source notes used in this article, but kept as text rather than additional screenshot strips:
- EIA Press Release 582, captured 2026-04-07: the release cites stronger U.S. electricity demand growth, explicitly references data-center demand, and flags strong solar generation growth in 2026 and 2027.
- LBNL Queued Up: 2025 Edition, captured 2026-04-07: the page also highlights longer interconnection timelines and high historical withdrawal rates.
- IRS - Clean Electricity Investment Credit (48E), captured 2026-04-07: the page describes 48E as the post-2024 tech-neutral replacement for the legacy ITC and explains the base 6 percent amount with higher-rate conditions.
- IRS - Clean Electricity Production Credit (45Y), captured 2026-04-07: the page describes 45Y as the post-2024 tech-neutral production-credit framework and lists the base-rate structure plus small-facility language.
What the Evidence Supports in 2026
Demand Tailwind Is Real, but It Is Not the Whole Story
EIA's January 13, 2026 release points to a notable demand setup: U.S. electricity use growth in 2026 and 2027, with large computing facilities explicitly cited as a driver. The same source also flags strong forecast growth in solar generation.
This supports a constructive medium-term backdrop for utility-scale clean power and related infrastructure. It does not, by itself, guarantee uniform equity performance across all clean-energy subsegments.
Interconnection Friction Is a Material Constraint
The LBNL Queued Up: 2025 Edition highlights make the bottleneck hard to ignore: around 10,300 active projects in interconnection queues at end-2024, alongside longer median timelines and significant historical attrition. That queue is the denominator the whole conversion question hangs on. Treat the 10,300 as the announced-pipeline ceiling, not the buildable base: the page also flags high historical withdrawal rates, so the projects that actually reach commercial operation are 10,300 minus whatever attrition the reader applies. The post does not carry a withdrawal percentage, so do not assume one — pull the historical withdrawal rate straight from the LBNL page and multiply it against the 10,300 to size the realistic survivor set before trusting any developer's headline pipeline.
This is the part that turns a demand tailwind into a stock-selection problem. The same 10,300-project queue is shared across every developer claiming a slice of it, so a name's standing is its position within that queue, not the raw megawatts it advertises.
Tax-Credit Design Still Matters for Project Math
IRS 48E and 45Y pages show post-2024, tech-neutral framework design with structured base rates and potential increases tied to labor requirements. That means financing and compliance execution remain part of the investment equation, not just technology cost curves.
Segment-Level Exposure Framework
Better-Supported Exposures
- utility-scale developers with bankable offtake and credible interconnection progress,
- storage-enabled portfolios that can support delivery reliability under higher demand,
- developers and owners that can operationalize credit-related compliance requirements.
More Constrained Exposures
- projects with weak queue-to-COD conversion visibility,
- business models highly sensitive to financing and execution slippage,
- names that rely on headline pipeline size without evidence of permitting/interconnection throughput.
This is not a one-line "bullish" or "bearish" call. It is a conversion-efficiency regime, where project quality and timeline control can dominate top-line capacity announcements.
Market Pricing Context
What This Package Does Not Prove
- It does not prove every queued project will be built.
- It does not prove that one policy variable fully determines clean-energy equity outcomes.
- It does not replace company-level balance-sheet and contract analysis.
It does provide a defensible baseline for comparing subsegments and stress-testing assumptions.
Operational Update Routine
To keep this page current and verification-safe:
- Recheck EIA release updates for demand/generation revisions.
- Recheck the latest LBNL queue edition for queue size, timing, and attrition updates.
For company-level research, use this page as a filter before moving into filings or investor presentations. A developer with signed offtake but weak interconnection evidence should not be treated the same as a developer with visible queue progress and the same demand backdrop. A manufacturer tied to domestic content or credit-sensitive projects also needs a separate check on whether the customer base can actually use the tax-credit structure described by the IRS pages.
The key discipline is to update the three layers in order. If EIA demand language improves while LBNL queue friction worsens, treat the setup as a mixed regime rather than a clean acceleration story. If IRS credit mechanics change without better interconnection evidence, the project-finance case still needs company-level confirmation.
What Changes the Clean-Energy Read
The 2026 U.S. clean-energy landscape is not just a "technology adoption" story. It is a three-variable system: demand acceleration, grid-connection friction, and credit-structure execution. Readers and operators who track all three with primary-source discipline tend to make better decisions than those who rely on thematic headlines alone.
Related reads: