Energy & Commodities
Constellation at $256: What 147M MWh of Nuclear Optionality Must Prove
At the $256.18 price snapshot, Constellation trades at 22.3x its 2026 adjusted-EPS midpoint. The real test is converting 147M MWh of available or PTC-supported clean output into durable per-share cash flow.
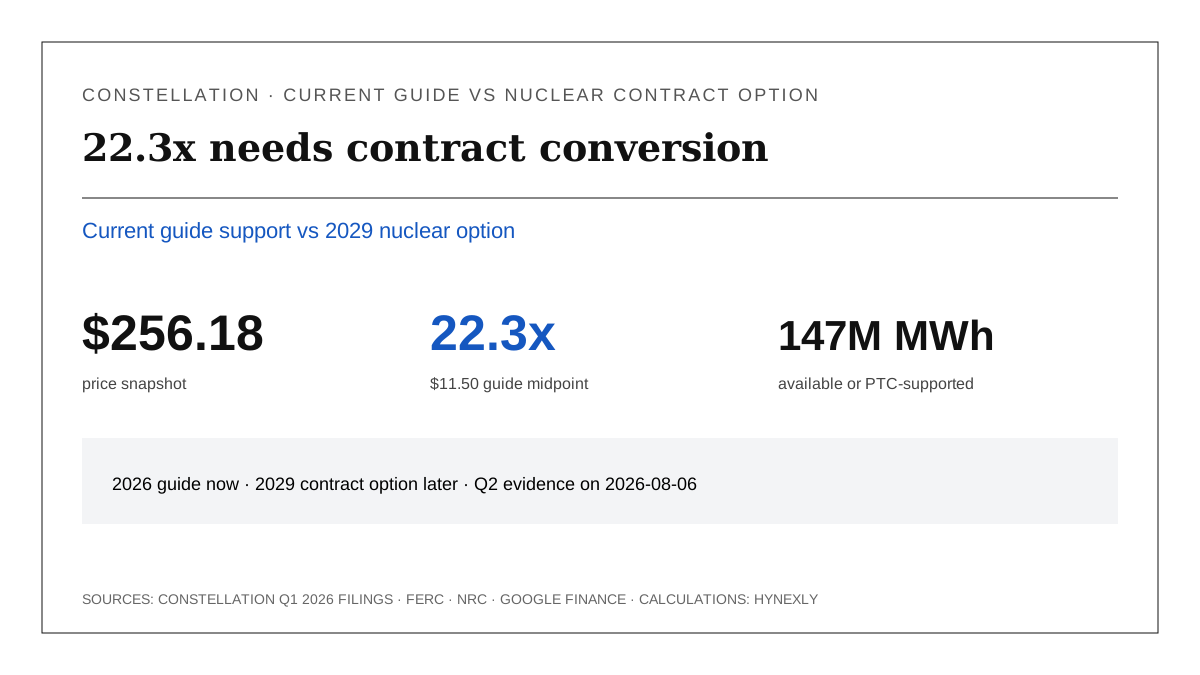
At the $256.18 price snapshot, Constellation's $11.00-$12.00 adjusted operating earnings guide implies a 21.3x-23.3x price-to-guidance range and 22.3x at the $11.50 guide midpoint. That is current support, not the whole story. The Q1 presentation also shows 147M MWh of expected 2029 clean baseload generation as PTC-supported or available for long-term agreement.
The investment question is whether that output becomes premium, durable cash flow without letting Calpine integration, growth capital, deleveraging or outages absorb the benefit. The thesis weakens if the 2026-08-06 Q2 report cuts guidance, shows weaker nuclear operations, leaves Calpine economics opaque or treats company-modeled 2029 opportunities as if they were already contracted.
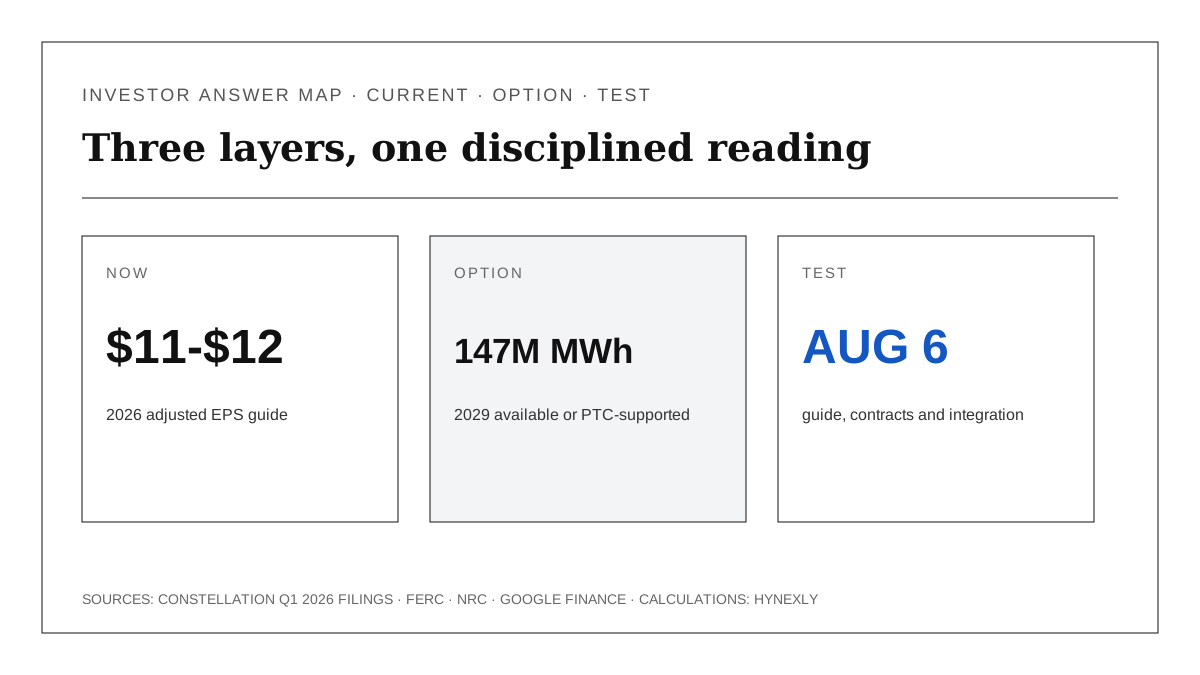
Source-derived answer map: Constellation Q1 2026 presentation, Google Finance and article calculations. Adjusted operating earnings and FCFbG are company non-GAAP measures.
| The 30-second answer | Verified input | Boundary |
|---|---|---|
| Current guide has earnings support | $11.00-$12.00 adjusted EPS | Company non-GAAP guidance |
| Midpoint multiple is 22.3x | $256.18 / $11.50 | Price-to-guidance calculation, not fair value |
| Contract inventory is large | 147M MWh | PTC-supported or available, not all contracted |
| Next evidence date is close | 2026-08-06 | Q2 must test operations, integration and capital |
Thesis
Constellation's current valuation requires more than an affirmed 2026 guide. A 22.3x midpoint multiple can be supported if the combined nuclear, gas, geothermal and retail platform converts its scarce generation into rising per-share earnings and cash. It becomes fragile if investors capitalize every available MWh as a premium contract before terms, timing and capital needs are visible.
The strongest evidence is the separation between base and option. Constellation affirmed $11.00-$12.00 of 2026 adjusted operating EPS, while its 2029 framework describes 147M MWh that remain PTC-supported or available for long-term agreement. The company illustrates what one 1GW nuclear PPA could add, but explicitly warns that the opportunities may not be additive.
The strongest countercase is that the option is real. Constellation has a fleet that cannot be replicated quickly, a federal nuclear production-tax-credit floor, active hyperscaler demand and regulatory progress at Crane. A company with contractable clean baseload can improve duration and downside protection if it does not trade away too much upside or overfund growth.
This completes a three-part power-infrastructure reading path: GE Vernova tests whether equipment backlog becomes margin and cash, while Vistra tests current before-growth cash yield against staged nuclear PPAs. Constellation adds the contract-inventory and regulatory-execution layer.
Source Evidence Snapshot
The official Q1 slide puts the present case in one frame: GAAP EPS was $4.49 while adjusted operating EPS was $2.74 and full-year adjusted operating EPS guidance remained within the $11.00-$12.00 range. The guide uses expected average diluted shares of 361M, while Q1 used 354M after shares issued for Calpine.
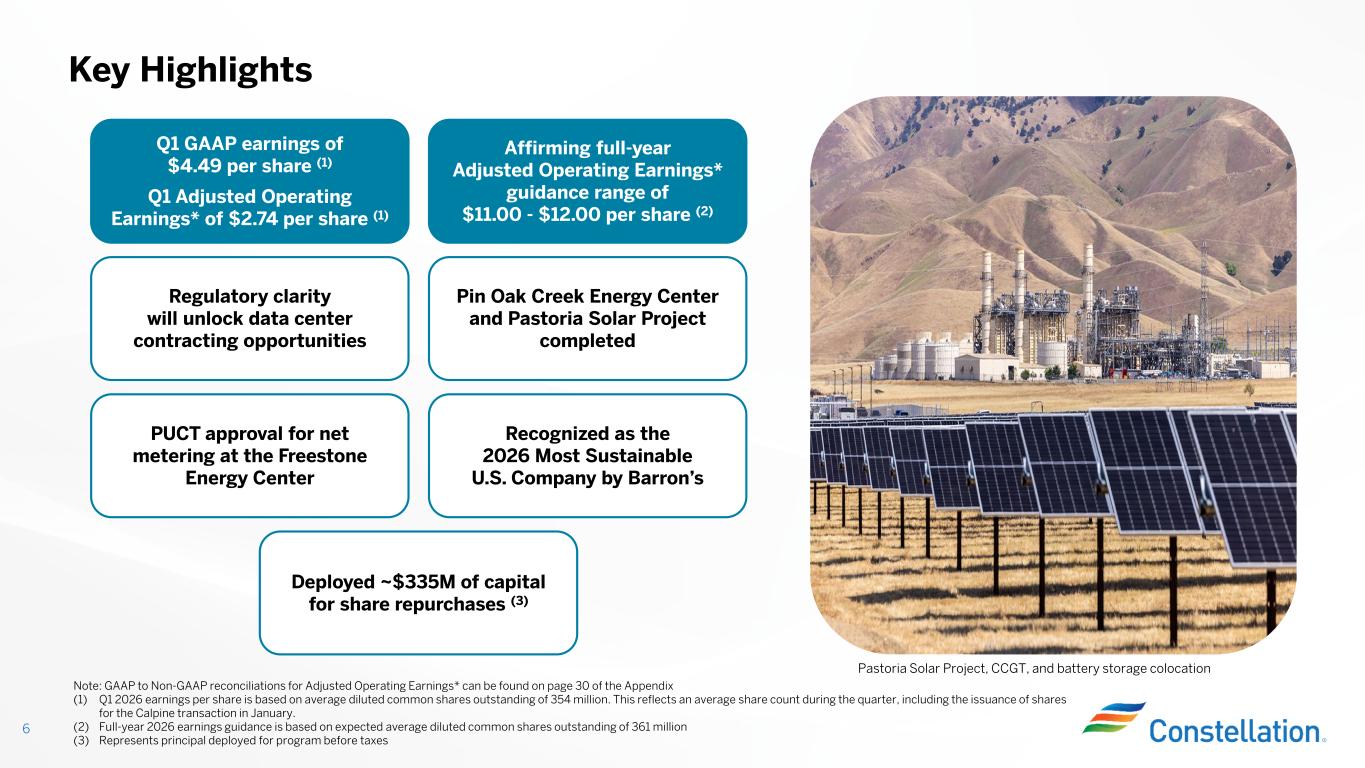
2026-05-11, captured 2026-07-15. Adjusted operating earnings are non-GAAP; the source slide preserves its share-count footnotes.Adjusted EPS moved from the $2.14 level to a $0.60 increase, or 28.0%. Yet the GAAP headline was not a clean run-rate. Common net income was $1.590B, then the bridge removed a $721M unrealized fair-value gain and a $174M decommissioning-related item, added $154M of acquired-contract amortization and $119M of Calpine integration costs, and applied smaller adjustments. The result was $972M of adjusted operating earnings.
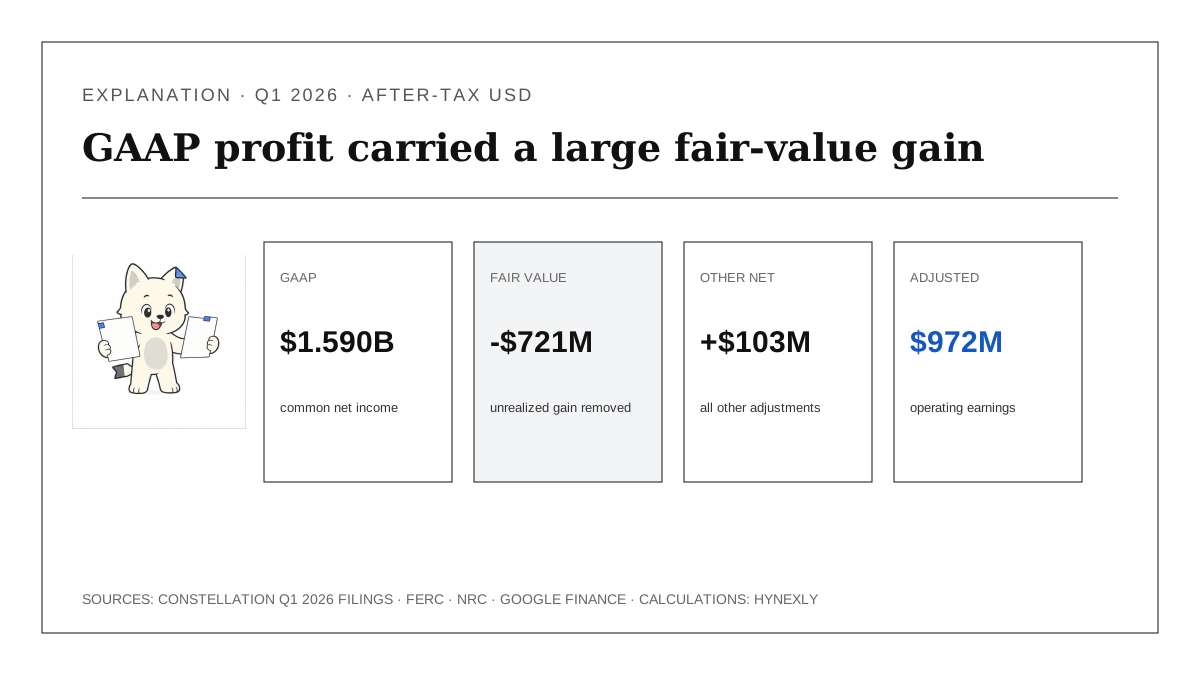
Source-derived explanation: Constellation Q1 2026 presentation, slide 30. The other adjustments net to +$103M; Nex explains the bridge while the unchanged source slide below is the proof.
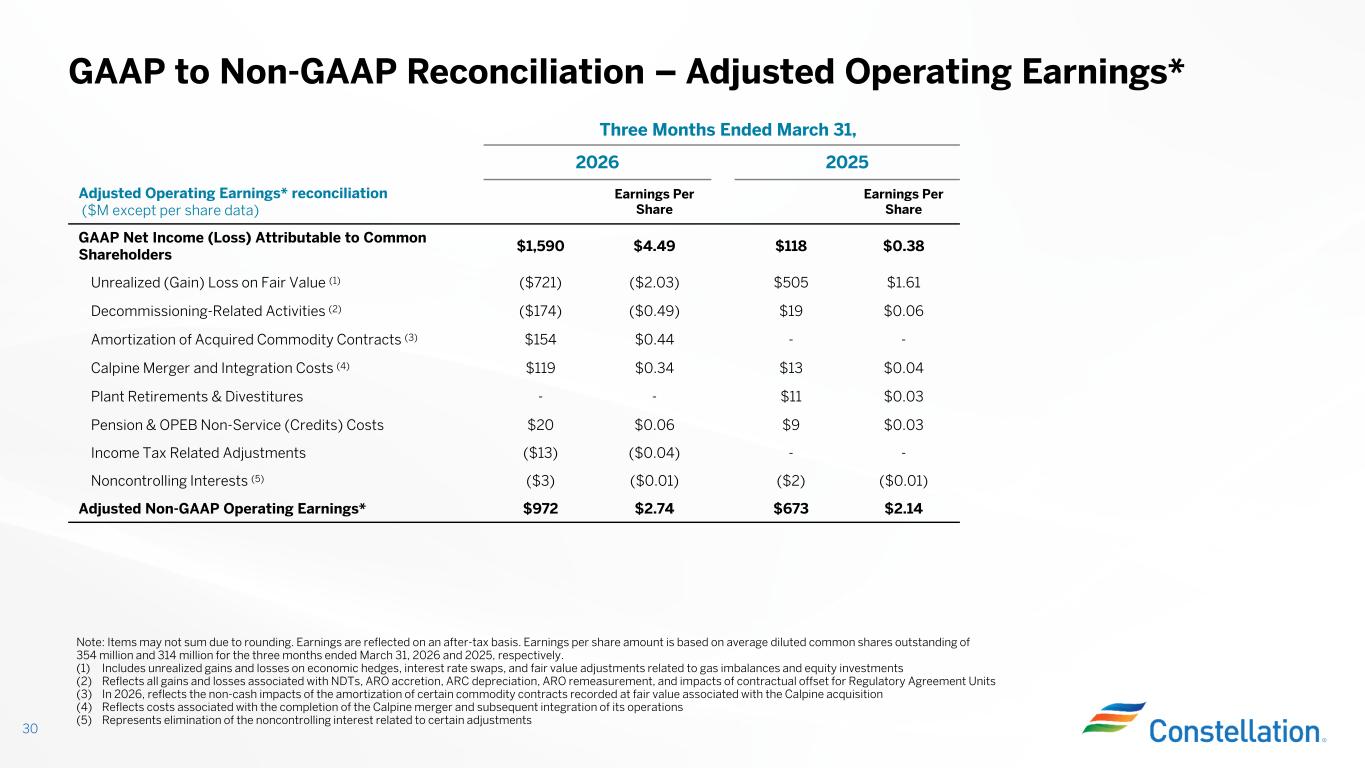
2026-05-11, captured 2026-07-15. Values are after-tax USD millions except per-share data; items may not sum because of rounding.Q1 adjusted EPS was 23.8% of the $11.50 full-year midpoint. That is directionally on pace, but not a mechanical quarterly run rate: power prices, capacity revenue, refueling schedules, weather and Calpine seasonality change through the year. The earnings release also shows nuclear generation of 44,666GWh versus 45,582GWh, capacity factor of 92.3% versus 94.1%, and 99 planned refueling days versus 88 days in the prior period.
What the Street Is Pricing
At 2026-07-14 17:52:09 UTC, the market snapshot showed CEG at $256.18 per share. Dividing that price by the company guide gives 23.3x at the $11.00 guide, 22.3x at $11.50 and 21.3x at the $12.00 guide. The inverse is a 4.3%-4.7% adjusted-earnings yield. These are expectation markers, not a target price.
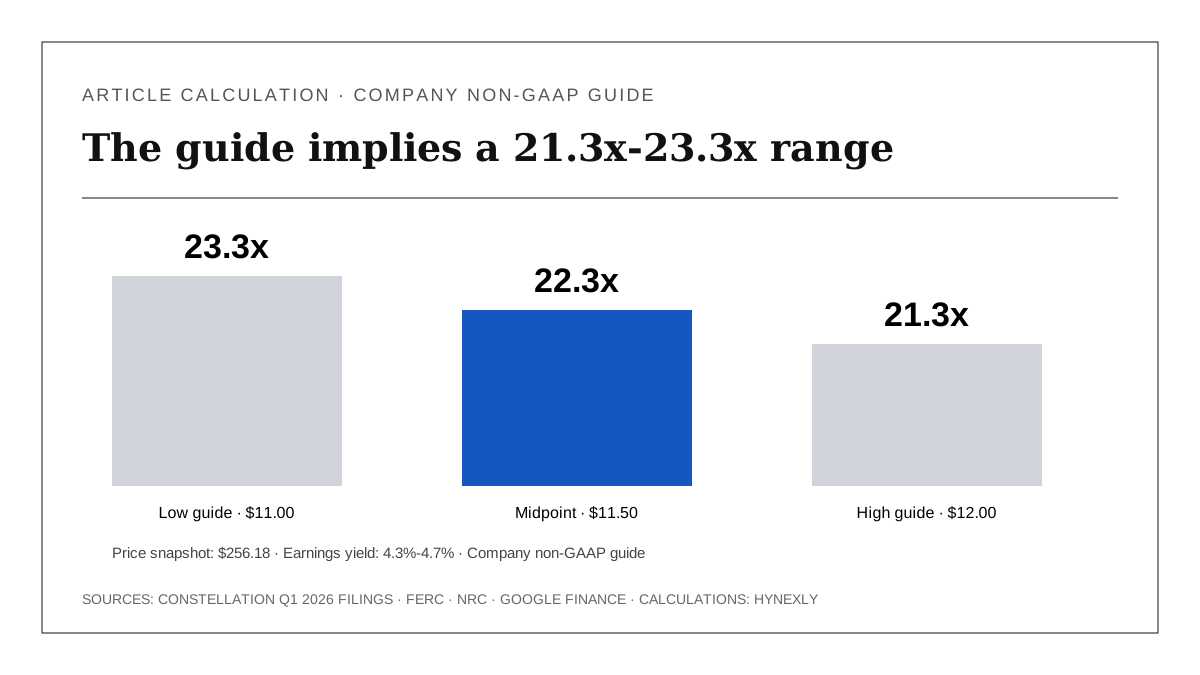
Source-derived market visual: Google Finance and Constellation slide 6. Calculations: $256.18 / $11.00-$12.00. The source timestamp and non-GAAP boundary are disclosed.
| 2026 adjusted-EPS case | Company guide | Price / guide | Earnings yield | Implied adjusted earnings at 361M shares |
|---|---|---|---|---|
| Low | $11.00 | 23.3x | 4.3% | $3.971B |
| Midpoint | $11.50 | 22.3x | 4.5% | $4.152B |
| High | $12.00 | 21.3x | 4.7% | $4.332B |
The denominator matters. Adjusted operating earnings remove fair-value, decommissioning, transaction and other specified items. They are useful for comparing Constellation with its own guidance, but they are not GAAP earnings and need not match cash available to shareholders. The 361M expected average share count also includes the acquisition-related dilution that a simple historical per-share chart can hide.
The 147M MWh Contracting Option
The official capacity slide shows 195M MWh of expected 2029 clean baseload generation, including nuclear and geothermal. It labels 48M MWh contracted and 147M MWh as PTC-supported or available for long-term agreement. That is a 24.6% contracted share and a 75.4% option or policy-supported share.
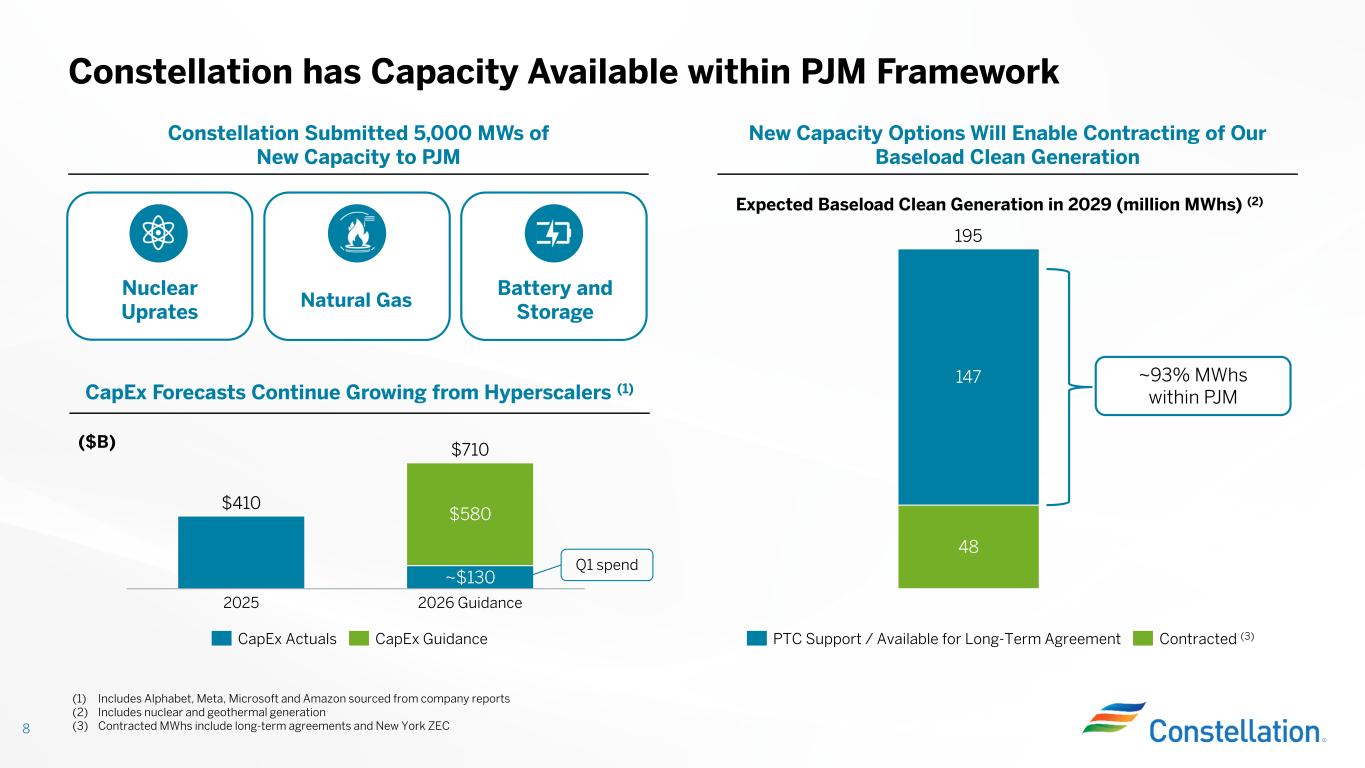
2026-05-11, captured 2026-07-15. The 195M MWh total is expected 2029 clean baseload generation and is not all nuclear output.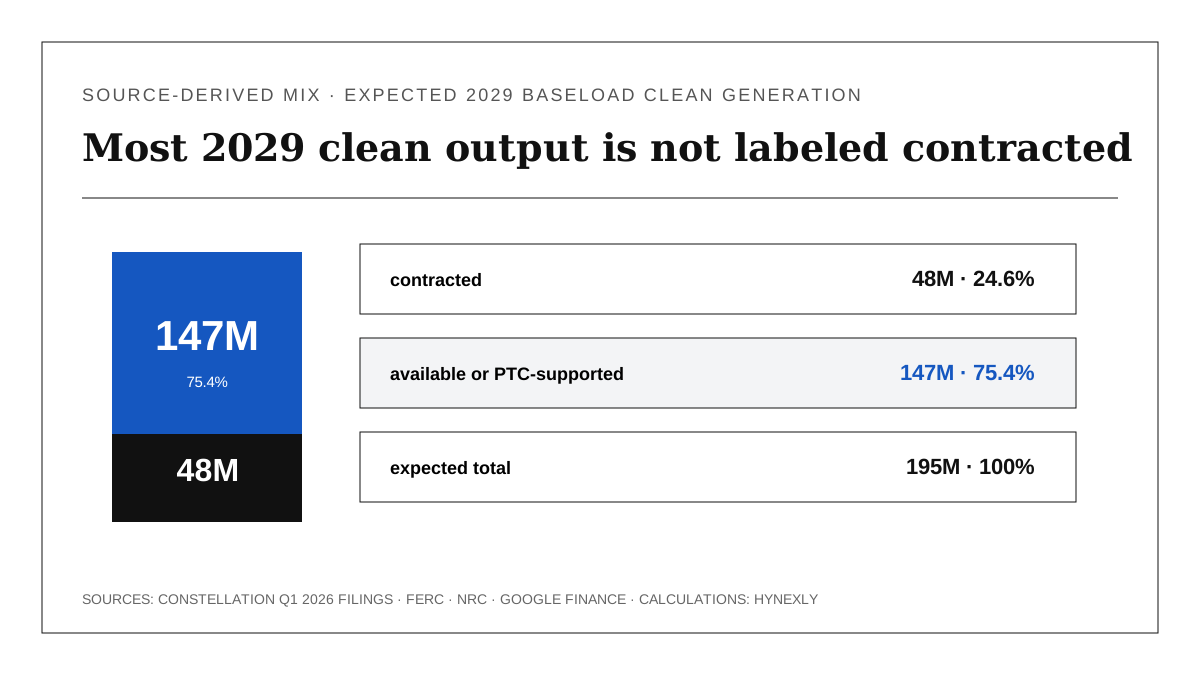
Source-derived explanation: 48M / 195M = 24.6%; 147M / 195M = 75.4%. “Available or PTC-supported” is not equivalent to unhedged, unprotected or guaranteed premium cash flow.
The PTC creates a floor mechanism for qualifying nuclear units when gross receipts are low. A long-term PPA can add duration and a premium above that floor. The company illustrates a 1GW nuclear PPA at a $20-$50/MWh premium as $0.40-$1.00 of 2029 adjusted EPS and $125M-$325M of 2029 FCFbG upside.
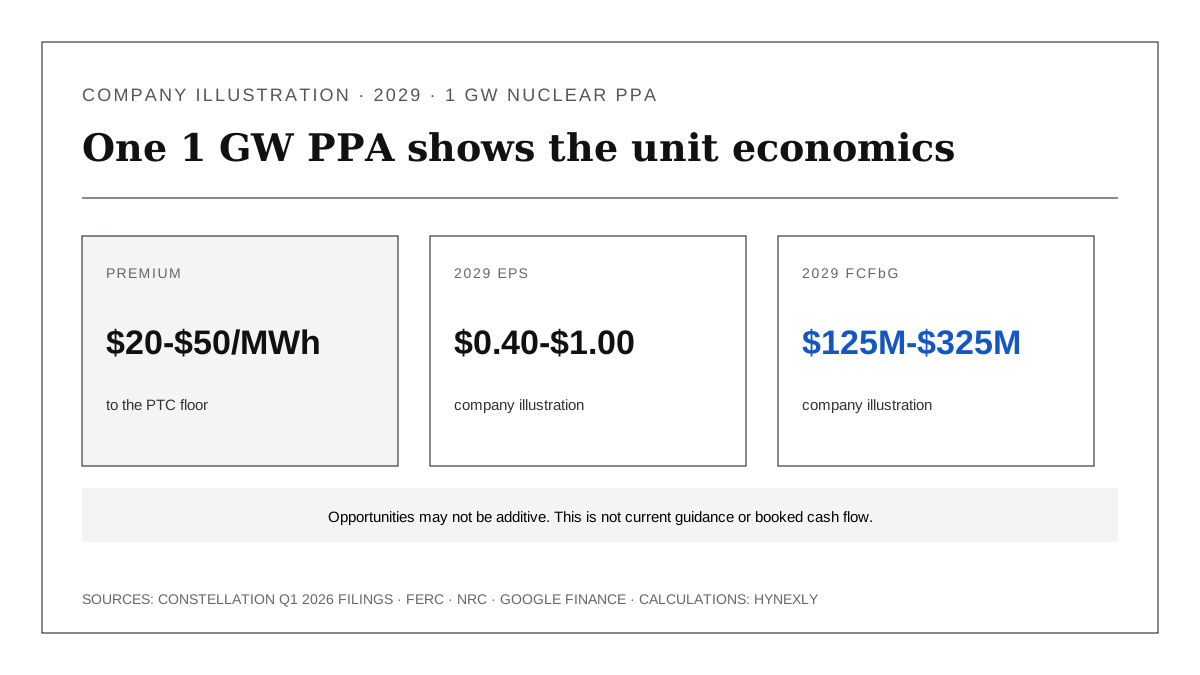
Source-derived explanation of Constellation slide 13. The figures are company illustrations for 2029; opportunities may not be additive and should not be multiplied across all 147M MWh.
The same slide shows $8.4B of cumulative FCFbG for 2026-2027 and $11.5B-$13.0B for the 2028-2029 periods, excluding after-tax asset-sale proceeds. FCFbG is cash from operations less maintenance and nuclear-fuel capex and equity investments, adjusted for collateral and non-recurring costs to achieve. Growth spending remains a separate capital demand.
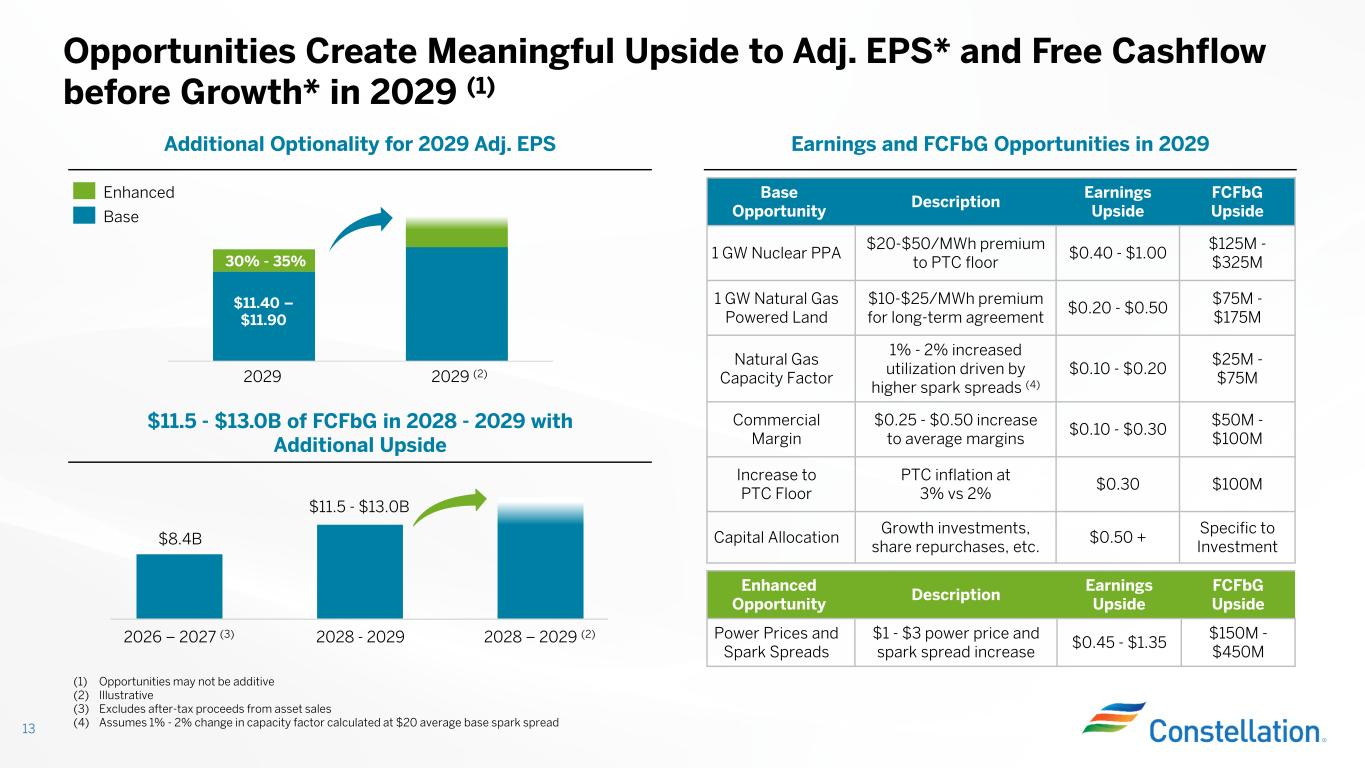
2026-05-11, captured 2026-07-15. The slide states that opportunities may not be additive and labels the 2029 enhanced case as a company scenario.The company therefore owns valuable contract inventory, but 147M MWh is not a valuation shortcut. Contract duration, escalation, credit quality, location, transmission, operating obligations and the retained exposure above the PTC floor determine the economic value of each deal.
Crane Shows Why Regulatory Sequence Matters
Crane is a concrete example of contract demand meeting physical and regulatory execution. The 835MW project has a 20-year Microsoft PPA. FERC granted the requested interconnection-rights waiver on 2026-06-01, removing one obstacle. The NRC issued a draft environmental assessment and draft finding of no significant impact in June, while the final review is projected during the fall 2026 calendar.
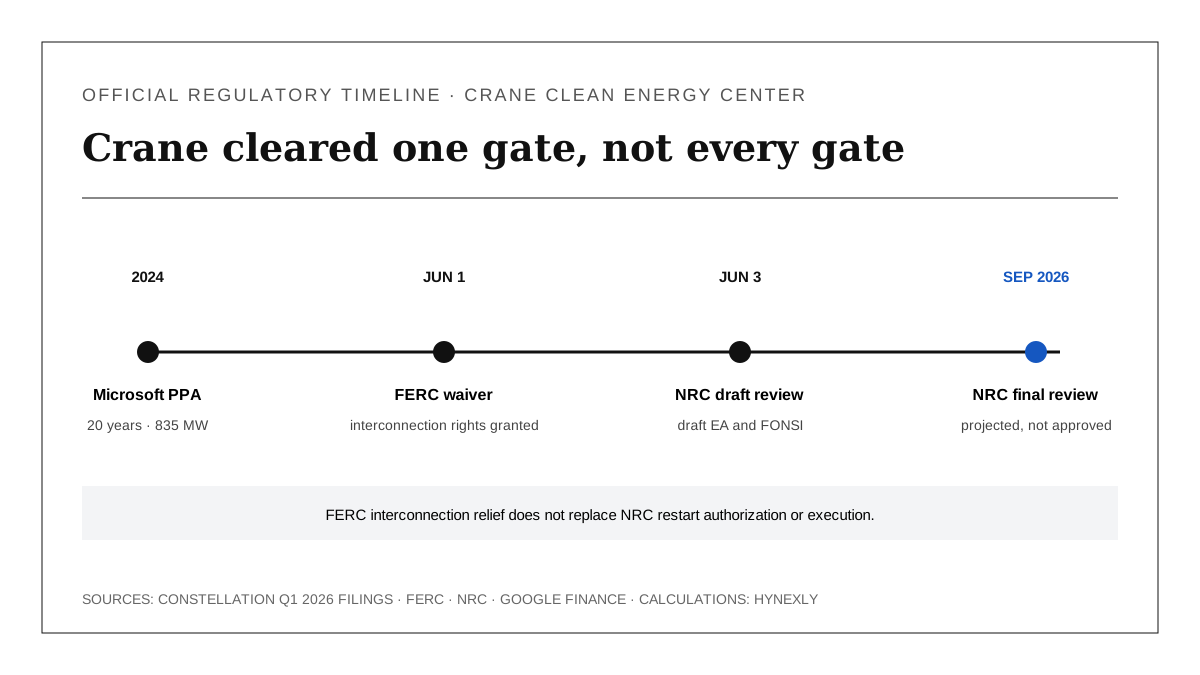
Source-derived regulatory timeline: Constellation Q1 Form 10-Q, FERC docket ER26-2028 and NRC Crane status. A FERC waiver does not equal final NRC authorization or completed restart execution.
The sequence is the point. A signed PPA can support investment, and a favorable grid ruling can improve deliverability, but engineering, licensing, construction and capital deployment still stand between contract value and cash. The same discipline should apply to every premium-contract headline in the 147M MWh opportunity set.
Risks to the Thesis
| Risk | Current evidence | Why it matters | Evidence that would reduce it |
|---|---|---|---|
| Valuation outruns base earnings | 22.3x midpoint guide | More value depends on future conversion | Guide growth without a weaker quality bridge |
| Nuclear operating drag | 92.3% capacity factor and 99 refueling days | Lower availability can consume price gains | Stable outages and improving generation |
| Calpine integration opacity | $21.8B acquisition and 50M new shares | Scale can hide weak per-share conversion | Clear segment contribution and cash conversion |
| Contract-option overreach | 147M MWh is not labeled contracted | Company-scenario premiums can be capitalized too early | Disclosed volume, duration and economics |
| Capital competition | Growth, deleveraging and buybacks share cash | FCFbG is before growth | Returns and funding matched project by project |
| Regulatory execution | Crane still requires NRC completion | Contract does not remove physical gates | Final approvals and on-budget milestones |
The Calpine accounting boundary deserves special attention. The 10-Q records an approximately $21.8B purchase price, including 50M new shares and approximately $4.5B cash. It reports $3.136B of Calpine revenue since the 2026-01-07 close but says standalone earnings were impracticable to determine after integration began. Revenue scale alone cannot prove per-share accretion.
What Flips the Call
The thesis strengthens if the next filing preserves the $11.00-$12.00 guide, makes Calpine contribution and cash uses more visible, keeps nuclear availability on track and converts part of the 147M MWh option inventory into contracts with disclosed, disciplined economics. It weakens if guidance depends increasingly on adjustments while outages, acquisition costs or capital needs rise.
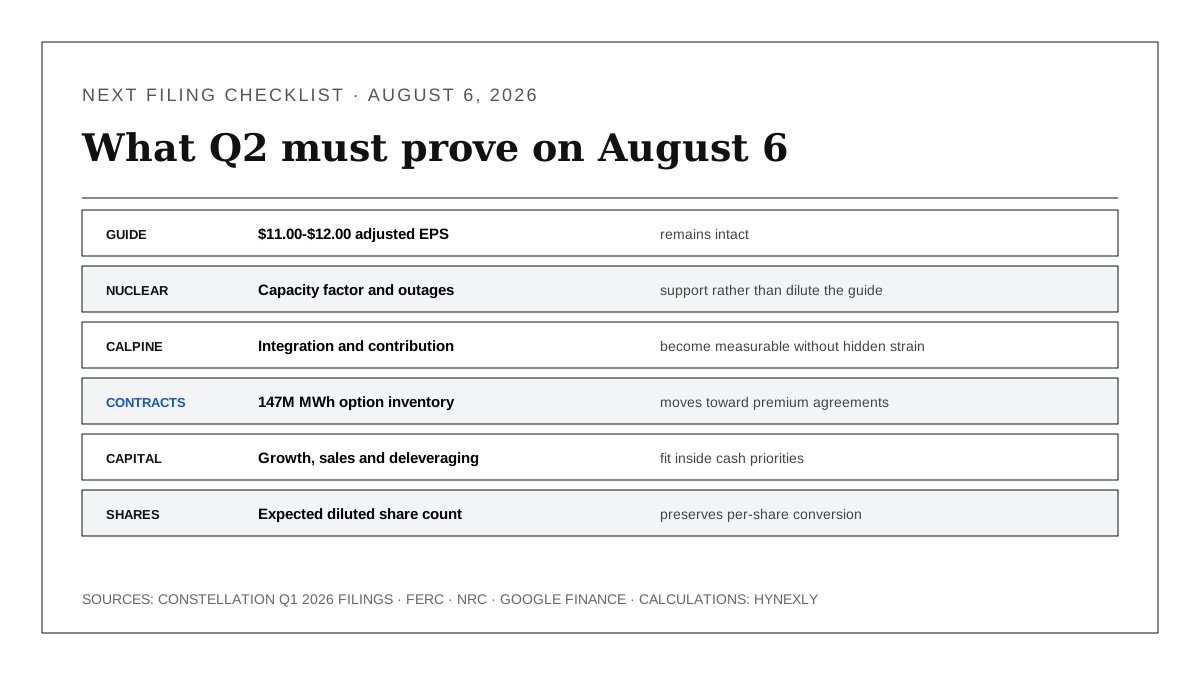
Next evidence date: the Constellation Q2 notice schedules the call for 2026-08-06 at 10 a.m. ET. These are monitoring gates, not a rating or price target.
| Q2 evidence gate | Pass condition | Warning condition | Why it flips the thesis |
|---|---|---|---|
| Adjusted EPS guide | $11.00-$12.00 guide maintained with a clean bridge | Cut or larger recurring exclusions | Changes current earnings support |
| Nuclear operations | Availability supports annual plan | More forced or extended outages | Reduces contractable production |
| Calpine integration | Contribution and cash needs become clearer | Revenue grows while earnings stay opaque | Tests acquisition per-share value |
| Long-term contracts | Disclosed terms improve duration and premium | Headlines without volume or economics | Tests the 147M MWh option |
| Capital allocation | Growth, deleveraging and repurchases fit cash | Projects outrun visible returns | Tests FCFbG quality |
| Expected shares | Per-share conversion stays disciplined | Dilution absorbs operating growth | Tests owner-level outcome |
Methodology, Sources & Disclosure
This article uses only public information available through 2026-07-15. The $256.18 price snapshot is dated 2026-07-14 17:52:09 UTC. The valuation range divides that price by Constellation's $11.00-$12.00 adjusted operating EPS guide. It is not a DCF, target price or investment rating.
The GAAP bridge reproduces the company's after-tax reconciliation. The 24.6% and 75.4% shares divide the official 48M and 147M MWh categories by the 195M MWh expected 2029 generation total. FCFbG and adjusted operating earnings are company non-GAAP measures and may not be comparable with similarly named measures at other companies.
Educational research only; not personalized investment, legal or tax advice. No position is disclosed for this article.