Hynexly

Research archive

Articles

Every Hynexly article that passed source, visual, bilingual, and editorial review.

15 published articles

Constellation evidence ladder separating 48 million contracted megawatt-hours, 147 million available or PTC-supported megawatt-hours, and company-modeled PPA economics
Energy & Commodities7 min read

Constellation's 147M MWh Ladder: Contract, Option, or Cash?

Constellation has 48M MWh under long-term contracts and 147M MWh available for agreements or supported by the nuclear PTC; those are different evidence layers, not one block of guaranteed value.

Hynexly Research
First Solar backlog calendar moving from 50.1 gigawatts through quarterly sales and net bookings to 47.9 gigawatts
Energy & Commodities7 min read

First Solar's 47.9 GW Backlog: A Delivery Calendar, Not a Vault

First Solar's backlog offers years of visibility, but Q1 deliveries outran net bookings and the next proof is whether the calendar converts into guided profit and year-end cash.

Hynexly Research
GE Vernova order-to-cash path from 18.3 billion dollars of Q1 orders through 163.3 billion dollars of RPO to an estimated 42.8 billion dollars recognized within one year
Energy & Commodities7 min read

GE Vernova's $163B Backlog: Follow the Order to Cash

GE Vernova has proved demand with $18.3B of Q1 orders and $163.3B of RPO; the next test is whether that order book becomes delivered equipment, segment margin, and repeatable cash.

Hynexly Research
Vistra evidence calendar separating the current 2026 adjusted FCFbG guide from staged Meta nuclear PPA delivery through 2034
Energy & Commodities8 min read

Vistra's Two Cash Stories: The 2026 Guide and the Meta PPA Calendar

Vistra's $3.925B-$4.725B 2026 adjusted-FCFbG guide is current evidence; the Meta nuclear PPA is a staged delivery story through 2034.

Hynexly Research
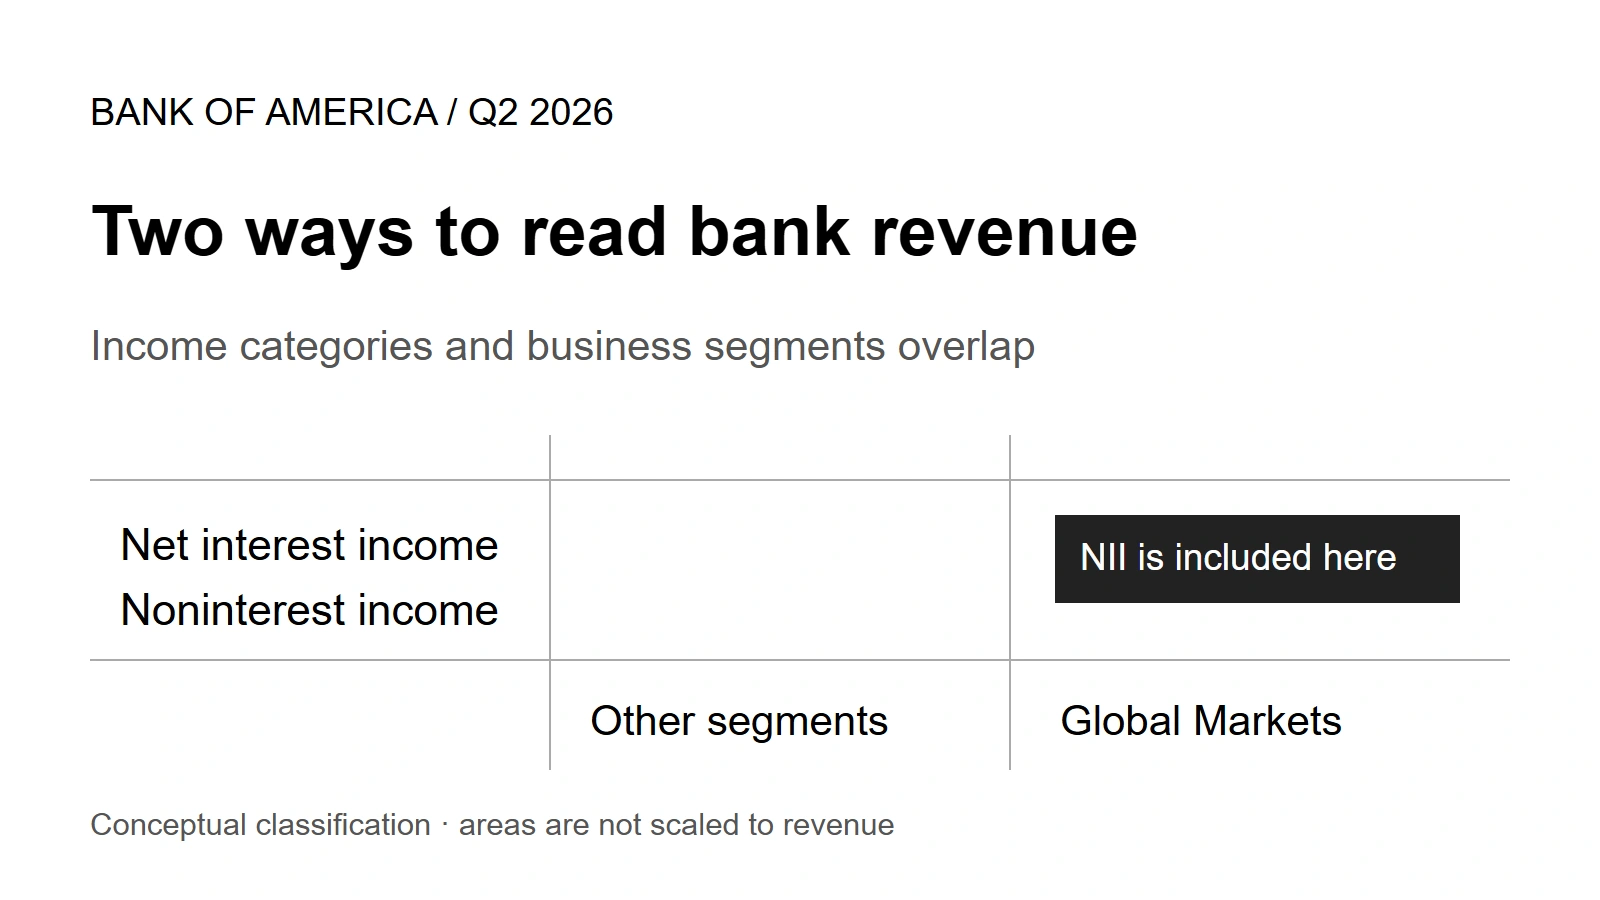
Source-derived Bank of America Q2 2026 scorecard showing a $4.115 billion revenue increase, 49.4 percent Global Markets contribution on an FTE segment basis, and 35.1 percent expense capture
Market & Macro10 min read

Bank of America Q2: Which Part of the $4.1B Growth Can Repeat?

Bank of America added $4.115B of Q2 revenue. Follow the bridge from NII and recurring fees to the faster Global Markets accelerator, then test what can repeat.

Hynexly Research
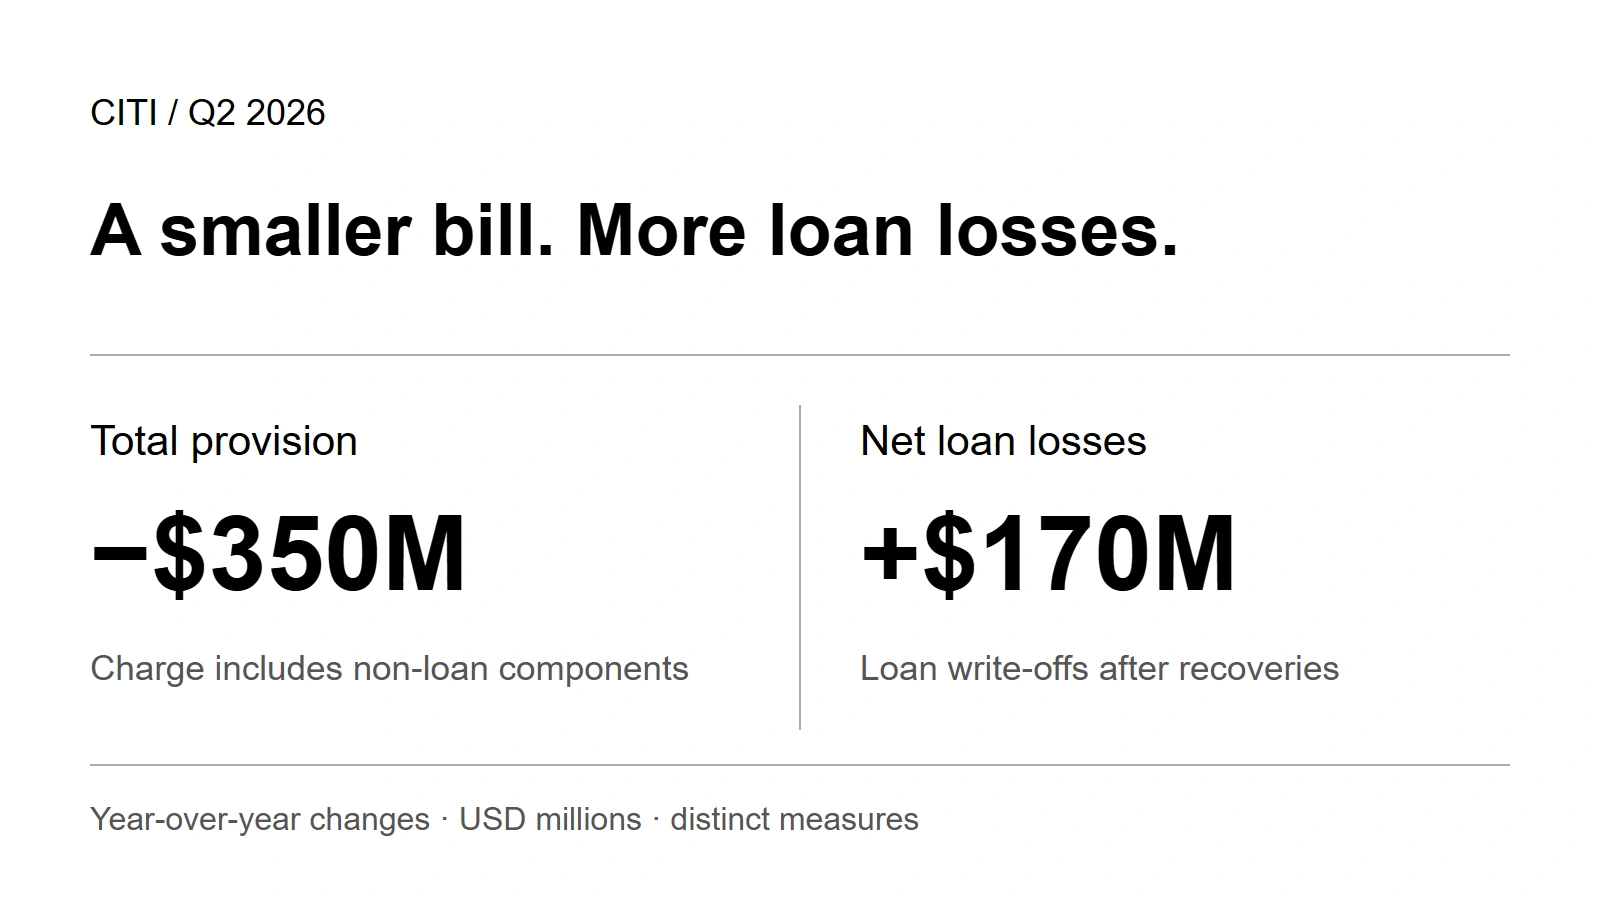
Source-derived Citigroup Q2 2026 proof board showing 13.0 percent RoTCE, a 57.4 percent efficiency ratio, and 20.6 percent expense capture
Market & Macro9 min read

Citi Q2: The Turnaround Finally Has Numbers—Can They Hold?

Citi reached 13.0% Q2 RoTCE and absorbed only 20.6% of incremental revenue with higher expense. The next test is turning one strong quarter into a durable system.

Hynexly Research
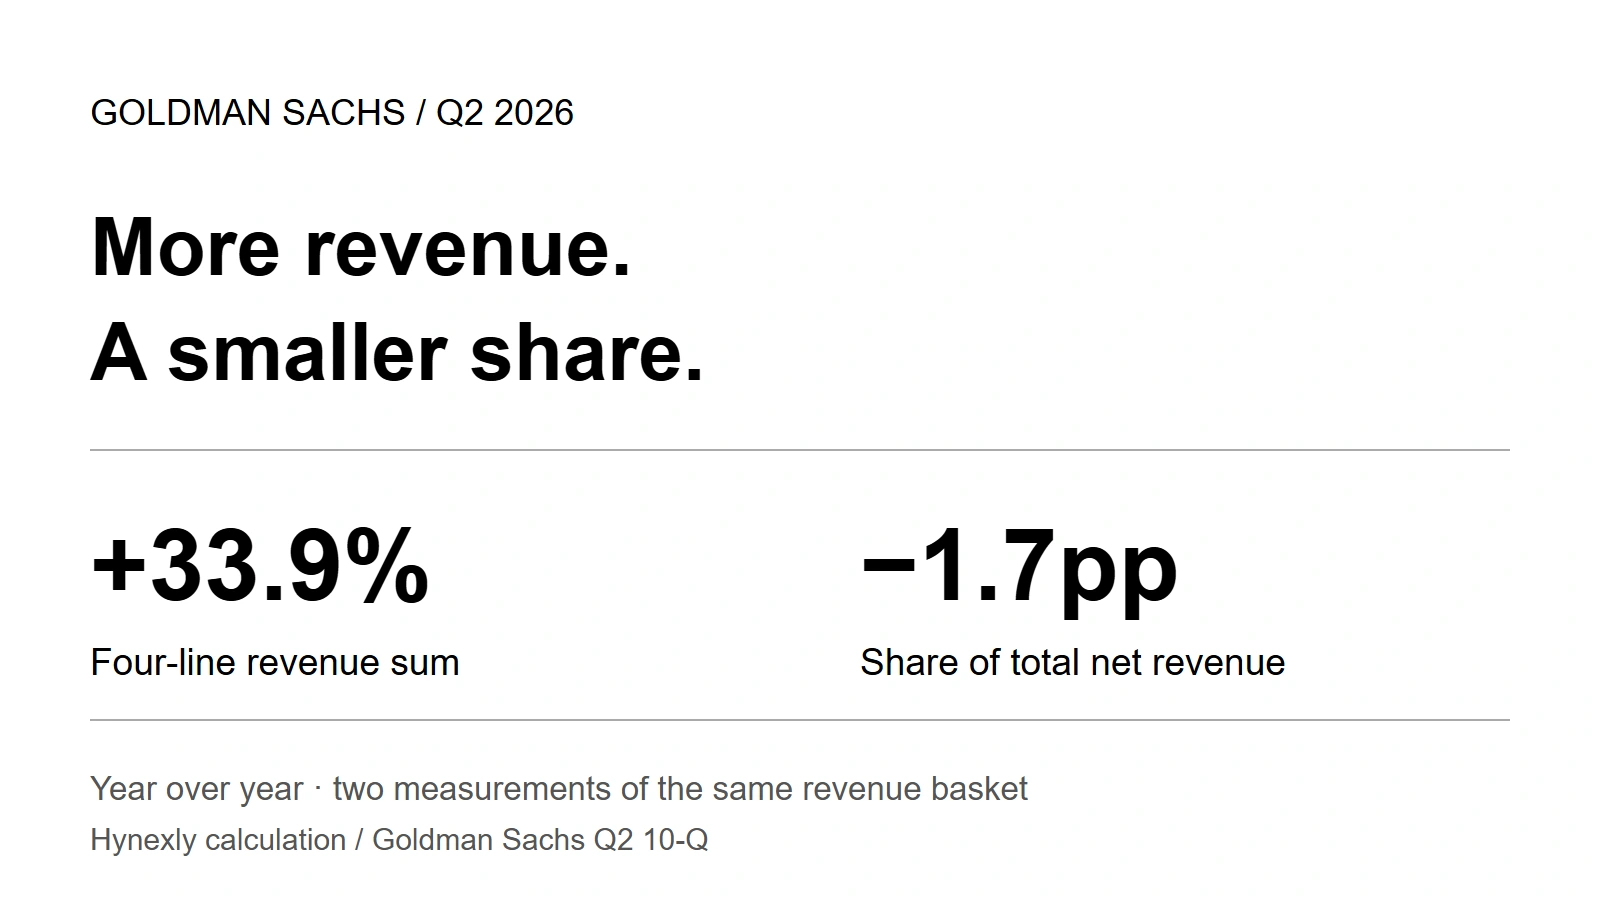
A source-derived portrait map of the Goldman Sachs Q2 return engine, from revenue growth to efficiency and tangible book value
Market & Macro11 min read

Goldman Sachs Q2: What Actually Powered the 23.5% ROE?

Goldman's Q2 ROE reached 23.5%, but one division supplied 93.6% of revenue growth. Follow the return engine and the evidence that can make it repeat.

Hynexly Research
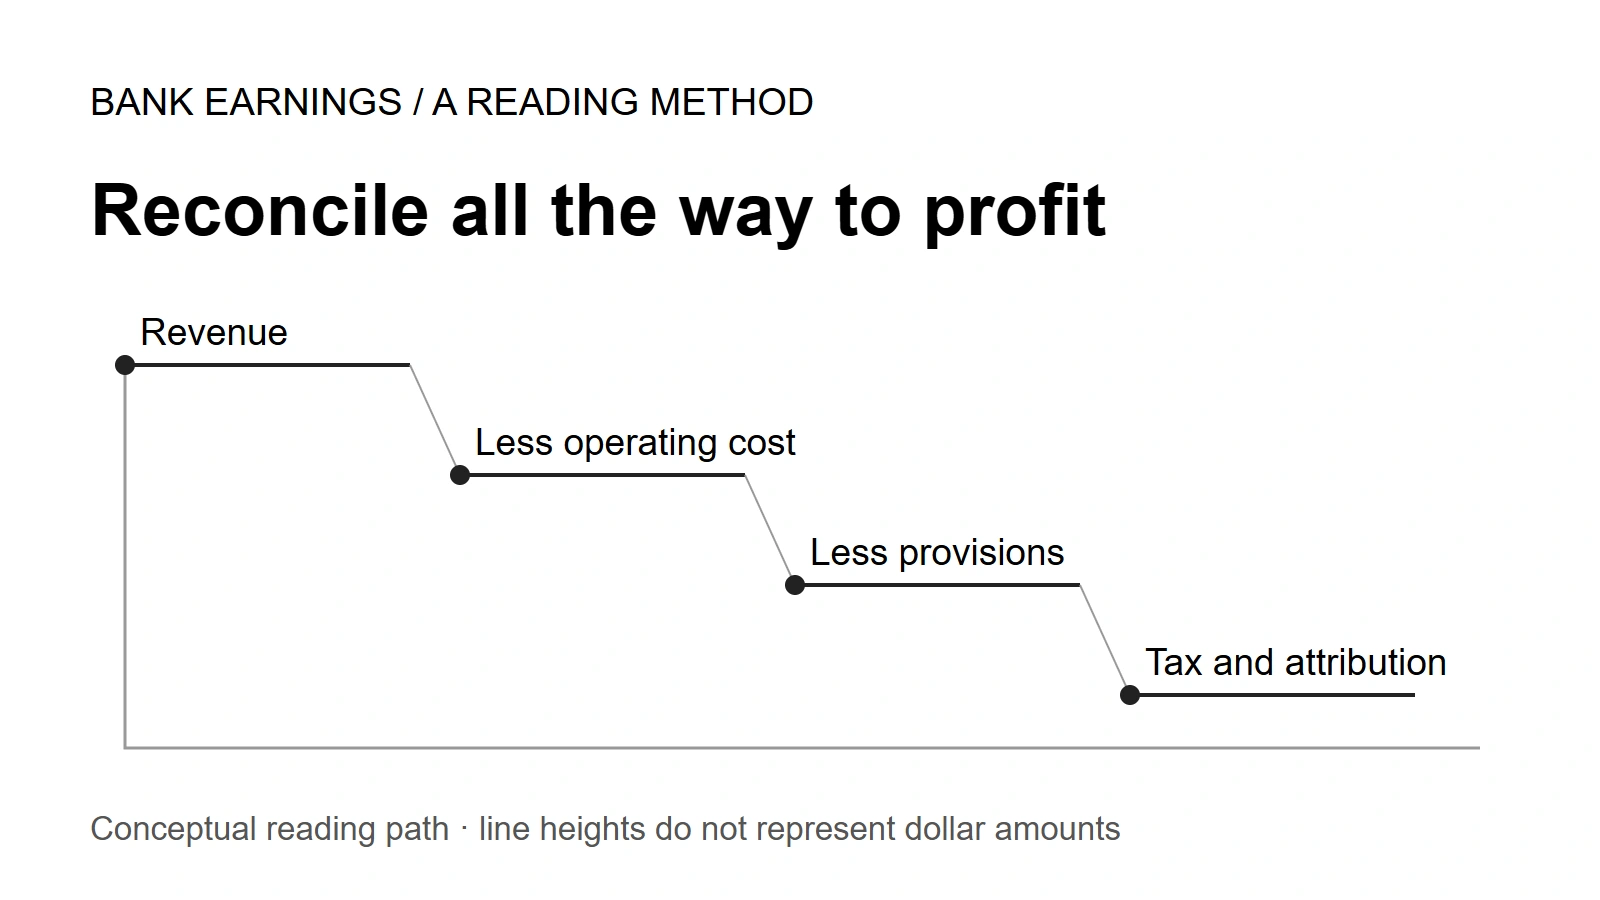
A five-gate portrait field guide for moving from bank earnings headlines to adjustments, revenue engines, costs, credit denominators, and repeatability
Market & Macro11 min read

How to Read Bank Earnings Without Falling for the EPS Headline

A five-gate field guide for reading JPMorgan, Bank of America, and Citi without mixing adjustments, revenue engines, cost conversion, or credit denominators.

Hynexly Research
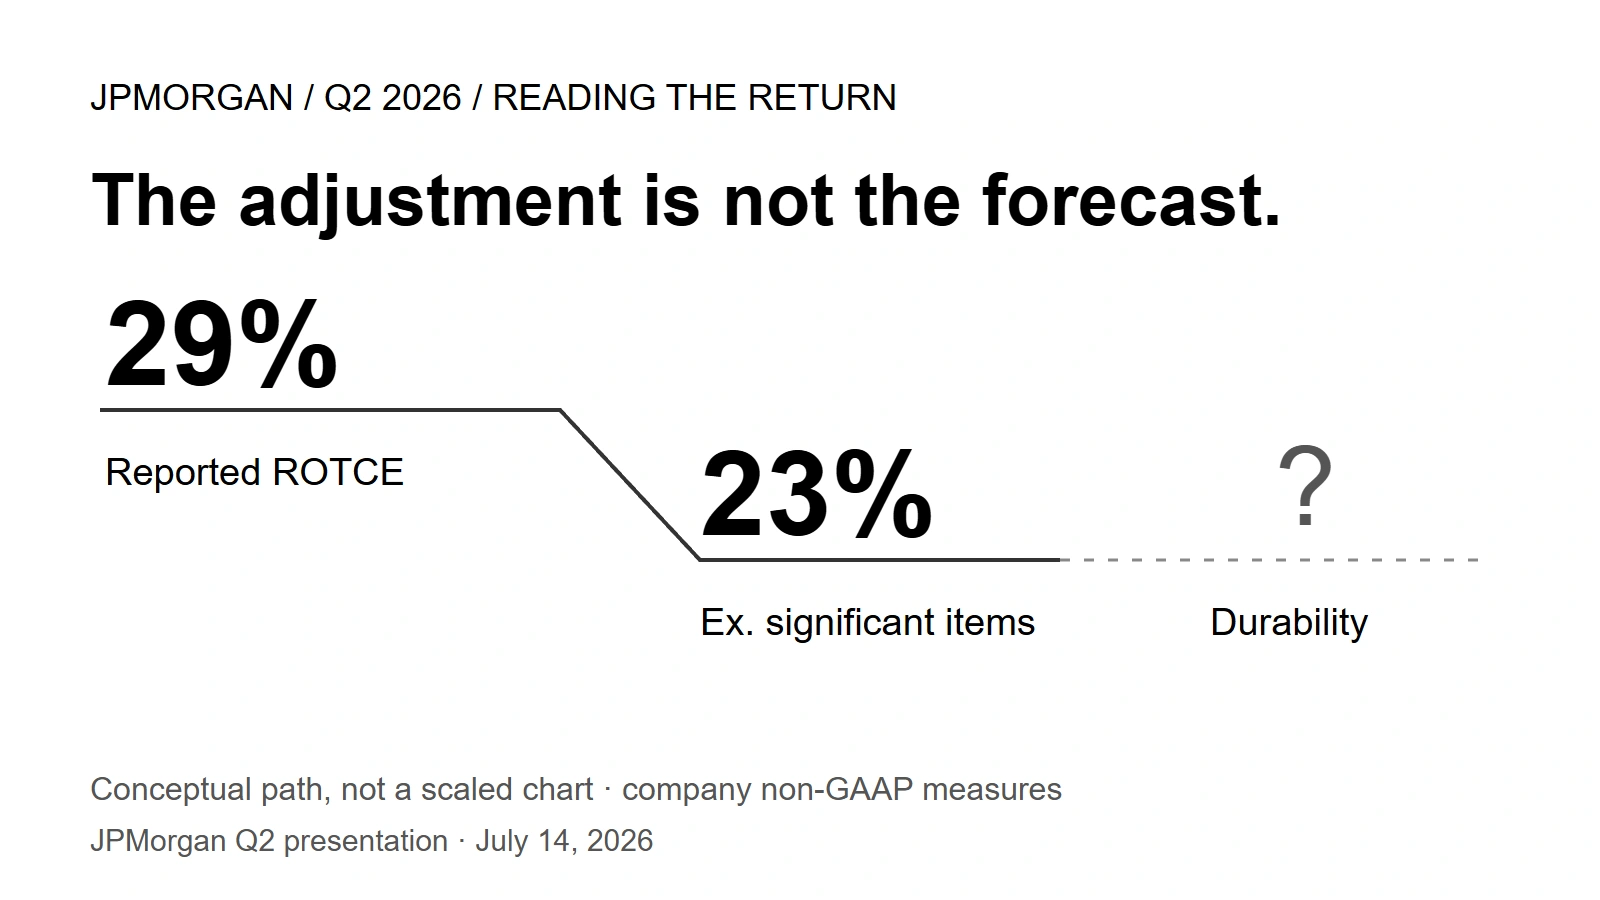
Source-derived portrait bridge moving JPMorgan's Q2 return from 29 percent reported ROTCE to a 23 percent baseline after significant items
Market & Macro11 min read

JPMorgan Q2: Why the 29% Headline Becomes 23%

A plain-English walk from JPMorgan's 29% reported ROTCE to the 23% operating baseline, then through the mix, cost, credit, and capital checks that matter next.

Hynexly Research
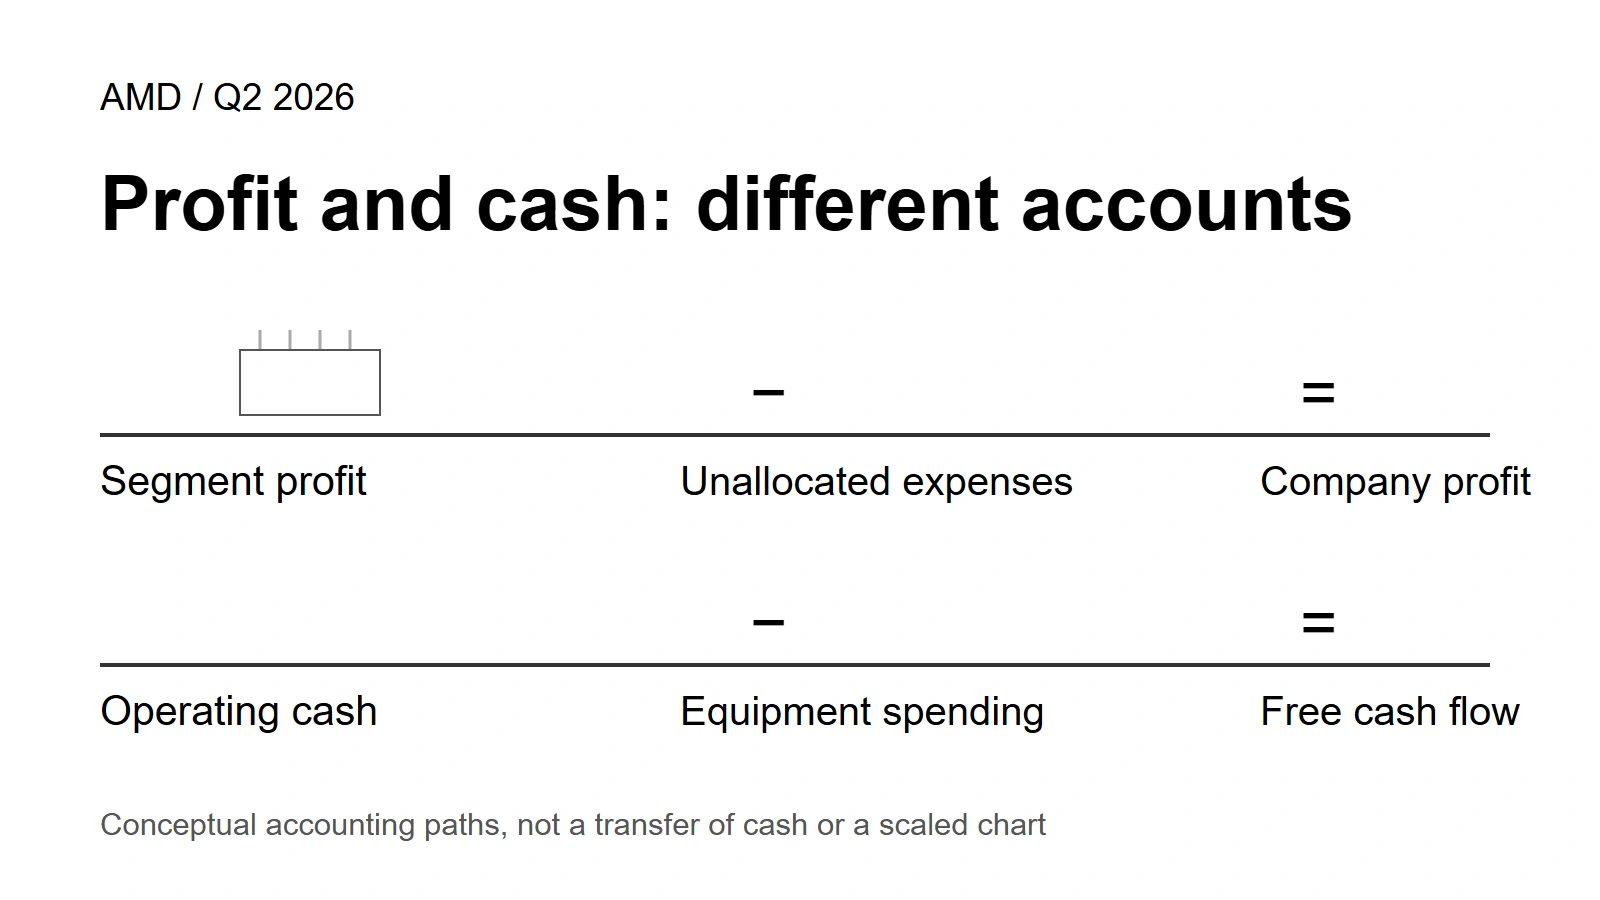
Source-derived portrait path following AMD Data Center growth from products to segment profit, company profit, and free cash flow
Market & Macro9 min read

AMD Data Center: Did the Growth Reach Profit and Cash?

Follow AMD's Q1 Data Center growth through segment profit, central costs, and free cash flow—then carry three clear checks into the August 4 report.

Hynexly Research
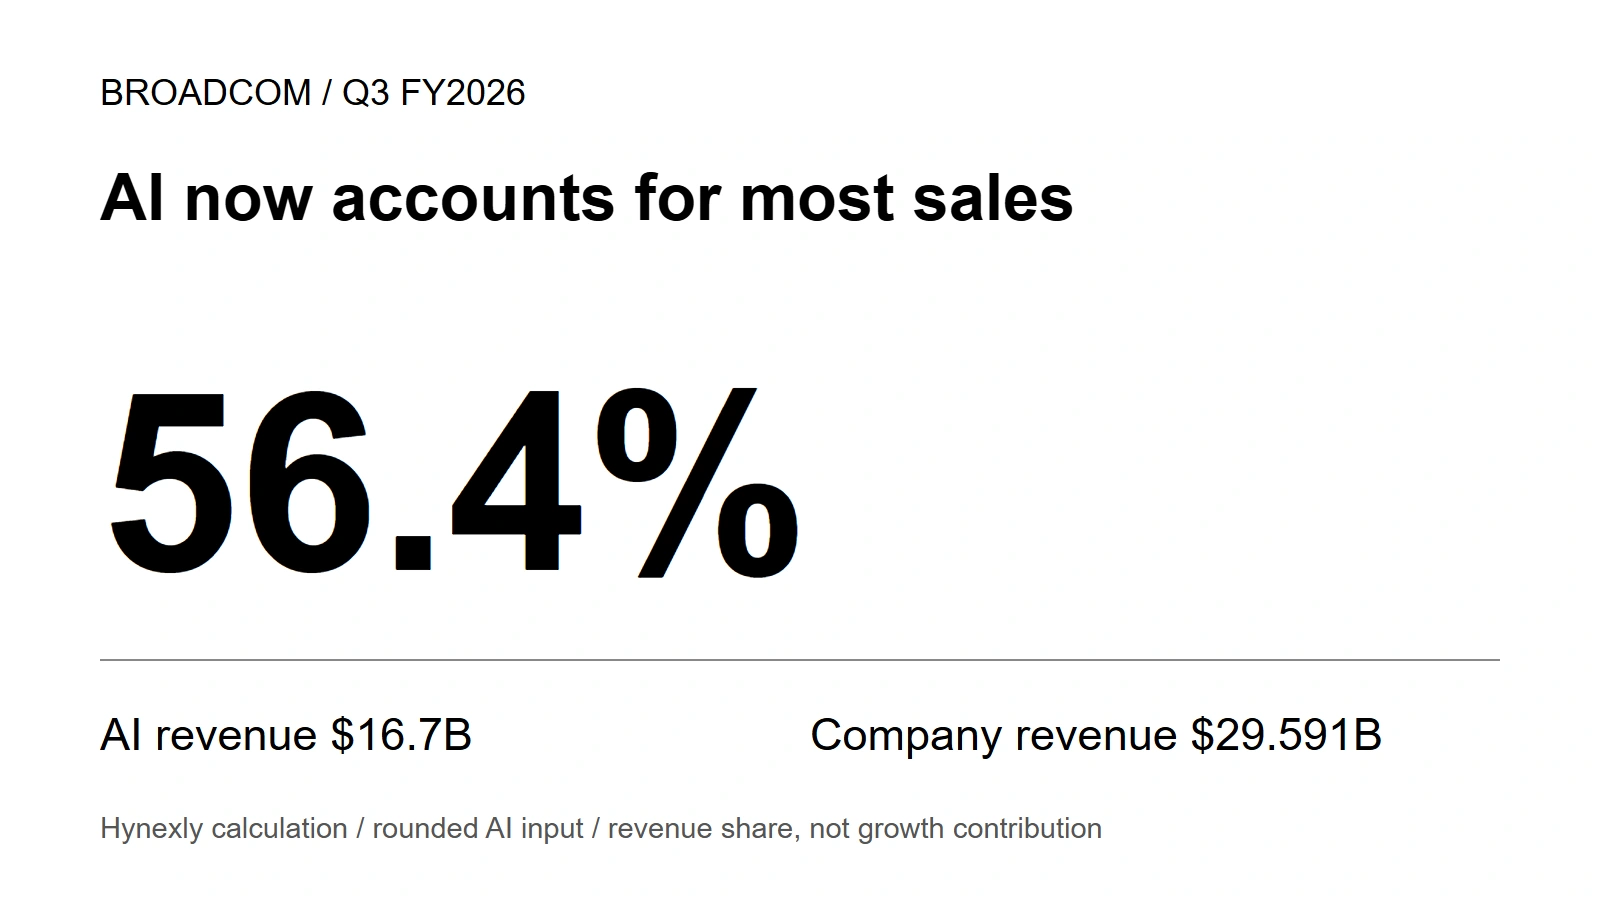
Source-derived Broadcom Q2 FY2026 revenue map showing AI semiconductor revenue of $10.8B at 48.7% of total revenue while the custom accelerator and AI networking split remains undisclosed
Market & Macro6 min read

Broadcom AI Revenue: Nearly Half the Company, Mix Still Hidden

Broadcom AI semiconductor revenue reached $10.8B, about 48.7% of Q2 FY2026 revenue and roughly 88.5% of annual growth, but accelerator, networking, margin, and customer concentration remain hard to separate.

Hynexly Research
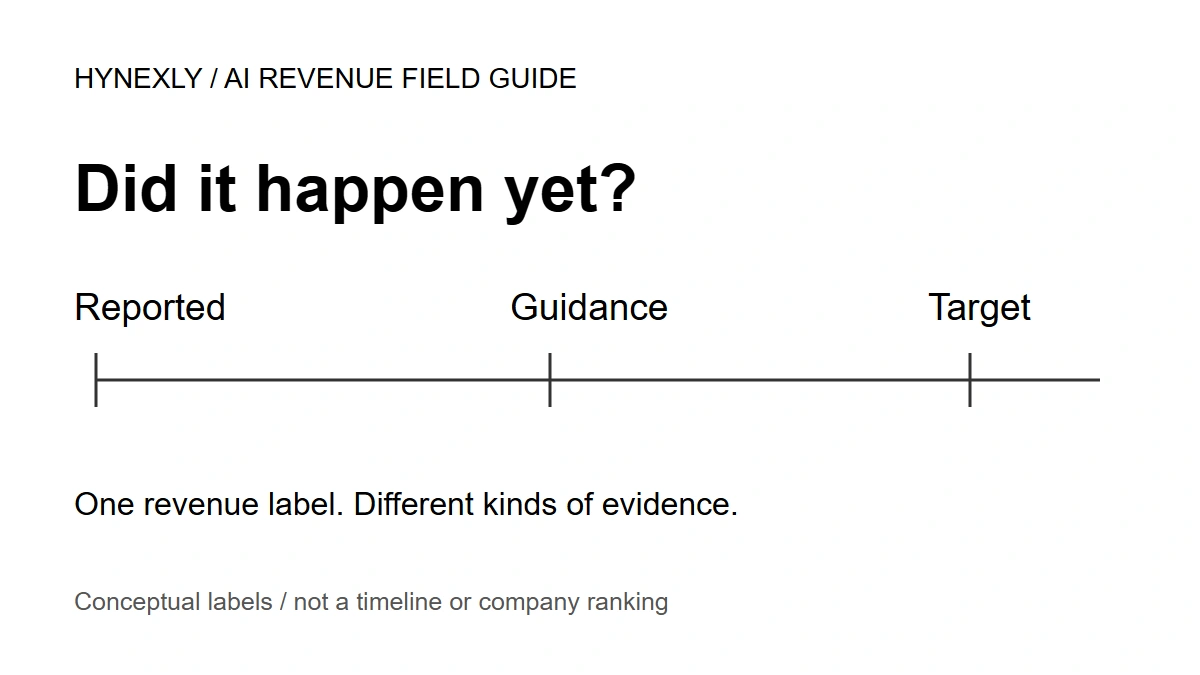
Friendly field guide labeling an AI revenue claim by status, period, business boundary, reconciliation, and next evidence
Market & Macro7 min read

The Five Labels That Make an AI Revenue Claim Usable

A reader-friendly worksheet for separating reported AI revenue, company guidance, and long-range targets before comparing businesses.

Hynexly Research
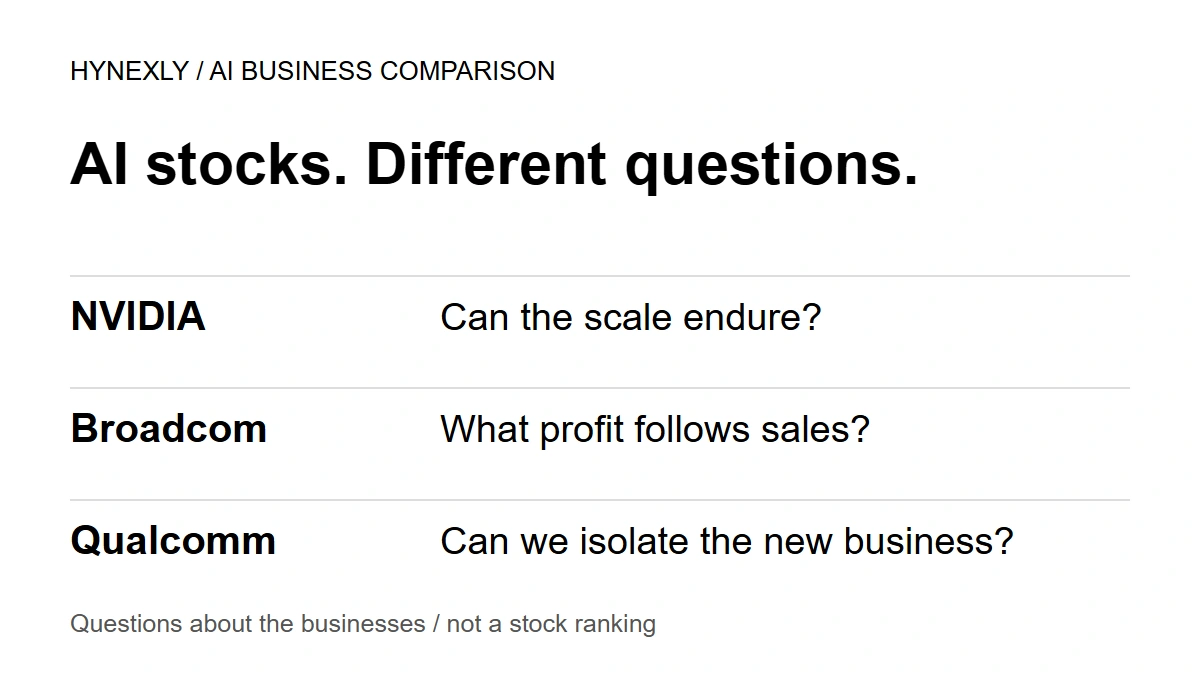
Three-clock evidence desk separating NVIDIA quarterly Data Center revenue, Broadcom quarterly AI semiconductor revenue, and Qualcomm's annual FY2029 target
Market & Macro7 min read

NVIDIA, Broadcom, Qualcomm: Three AI Revenue Numbers, Three Different Clocks

Why NVIDIA's $75.2B quarter, Broadcom's $10.8B quarter, and Qualcomm's >$15B FY2029 target belong in separate comparison lanes.

Hynexly Research
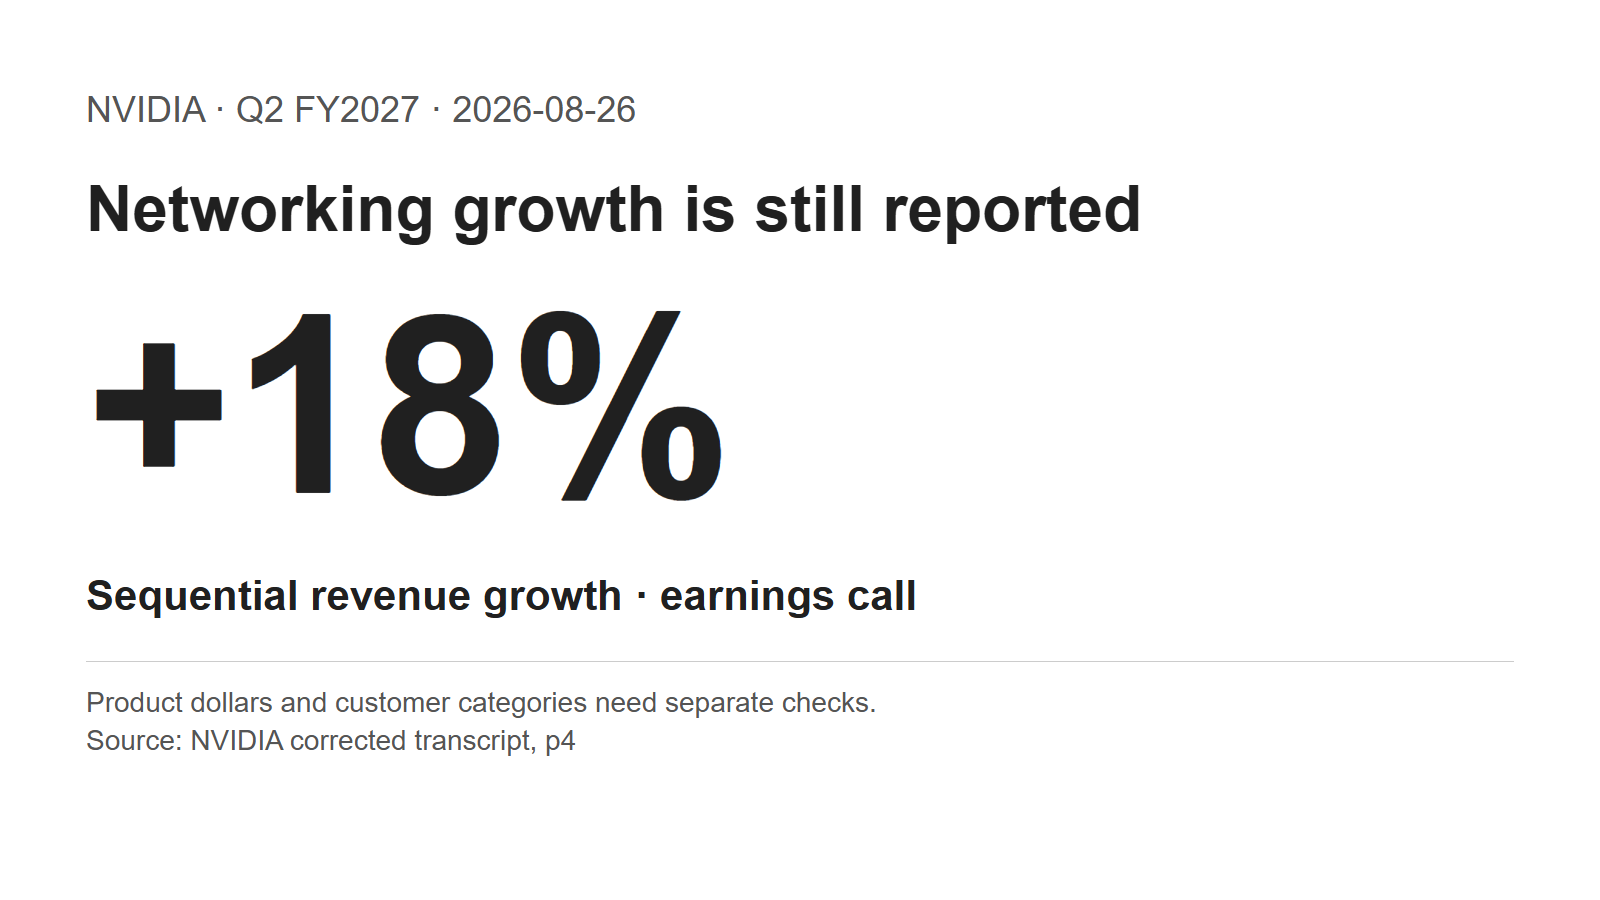
Source-derived NVIDIA Q1 FY2027 map showing the same $75.2B Data Center business under the old compute and networking lens and the new Hyperscale and ACIE lens
Market & Macro6 min read

Nvidia Networking Revenue Hit $14.8B—Then the Reporting Map Changed

Nvidia networking was 19.7% of Q1 FY2027 Data Center revenue and 27.3% of its year-over-year growth. The new Hyperscale/ACIE reporting lens changes what investors can verify next.

Hynexly Research
Source-derived Qualcomm thesis map showing Q2 FY2026 handset revenue down 13%, automotive up 38%, IoT up 9%, and fiscal 2029 company targets of $40B in non-handset revenue and more than $15B in data-center revenue
Market & Macro8 min read

Qualcomm After Investor Day: The Wall Street Debate

Qualcomm's diversification is real but still too small to absorb handset weakness. Can the earnings mix change before margins erode?

Hynexly Research

Your privacy choices

Choose whether Hynexly may use Google Analytics and personalized AdSense cookies. Necessary cookies always stay on. Change your choice anytime in our Privacy Policy.