Energy & Commodities
Vistra Stock at $158: Is an 8.1% FCFbG Yield Enough?
At $158.10, Vistra's 2026 adjusted FCFbG guide implies an 8.1% midpoint yield; Meta nuclear PPAs could add $562M-$735M only at staged full delivery.
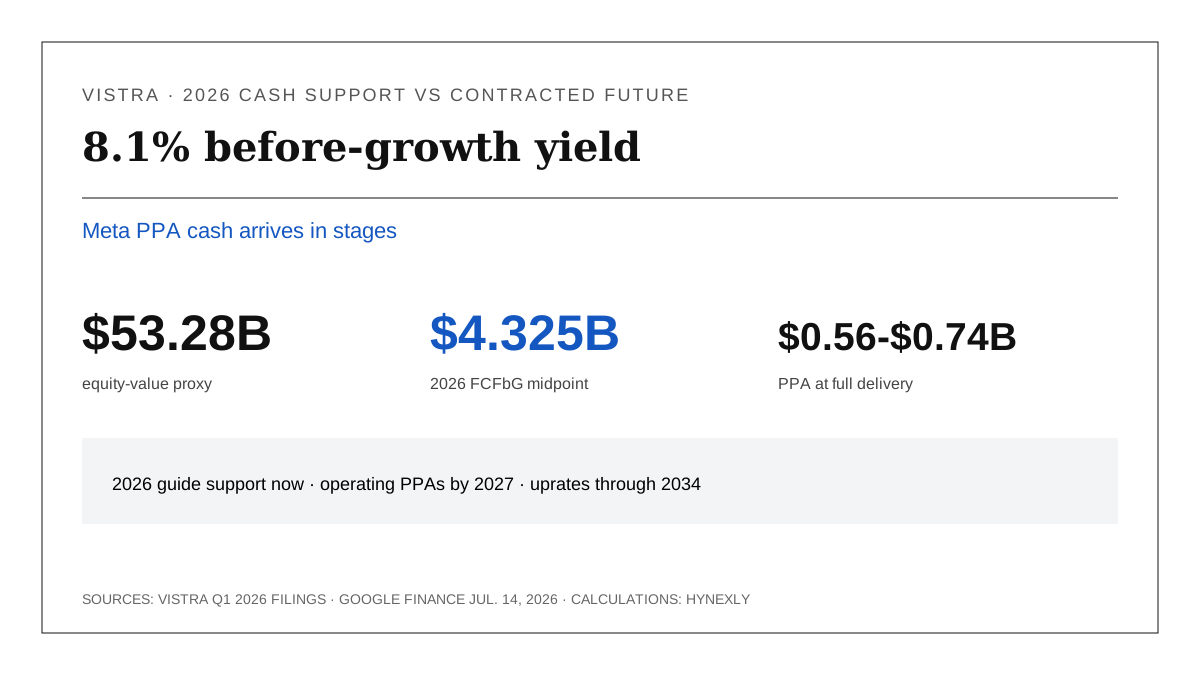
At $158.10 — Vistra's 2026 adjusted free cash flow before growth, or adjusted FCFbG, guide implies a 7.4%-8.9% yield using approximately 337M shares, with 8.1% at the $4.325B midpoint. The Meta nuclear PPAs could add an article-calculated $562M-$735M at full delivery. That upside is staged through 2034; adjusted FCFbG is not conventional free cash flow after every growth investment.
The valuation therefore has current cash support, but not a finished proof. Q1 adjusted EBITDA rose 20.5% because Generation more than offset a Retail decline, while GAAP net income included a $723M unrealized hedge gain. The thesis weakens if the 2026-08-07 Q2 report cuts adjusted FCFbG, reduces hedge visibility or raises PPA and acquisition cash needs without preserving expected returns.
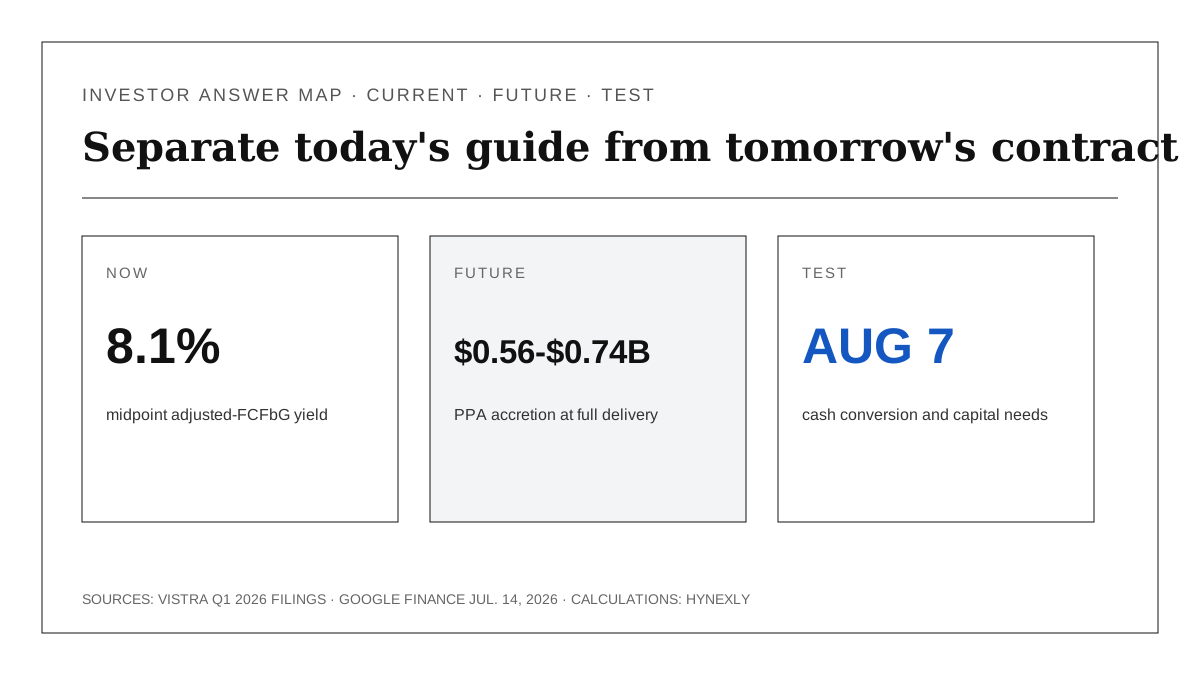
Source-derived answer map: Vistra Q1 2026 earnings release, Meta PPA Form 8-K, Google Finance, and article calculations. Adjusted FCFbG is a company non-GAAP measure.
| The 30-second answer | Verified input | Boundary |
|---|---|---|
| Current guide has cash support | $3.925B-$4.725B adjusted FCFbG | Company-defined before-growth measure |
| Midpoint yield is 8.1% | $4.325B / $53.28B equity-value proxy | Mixed-date price-times-share-count calculation |
| Meta adds a future layer | $562M-$735M at full delivery | Company percentages; staged through 2034 |
| Next proof date is close | 2026-08-07 | Q2 must test conversion and capital needs |
Thesis
Vistra's valuation is supported by a meaningful 2026 company-metric cash yield, but the 8.1% midpoint is not a clean distributable-cash yield and the Meta PPA should not be pulled forward into 2026; the defensible reading is narrower. A heavily hedged generation fleet supports near-term visibility, while long-term nuclear contracts can add a second cash-flow layer if delivery, uprate capex and acquisition funding remain disciplined.
The strongest evidence is the guide's boundary. Vistra reaffirmed $6.8B-$7.6B of 2026 ongoing-operations adjusted EBITDA and $3.925B-$4.725B of adjusted FCFbG. Both exclude potential contributions from the Cogentrix acquisition and the announced Meta PPAs. This makes the current guide more useful than a blended number that already assumes every growth project succeeds.
The strongest countercase is capital intensity. The PPA uprates require multi-year spending through 2034; Vistra says the exact amount is still being finalized. Cogentrix consideration includes about $2.3B of cash, an estimated $1.5B of assumed debt and 5M shares valued at $185 each. A before-growth cash measure can look generous while the growth program consumes real capital.
Source Evidence Snapshot
Q1 adjusted EBITDA reached $1.494B, up $254M from $1.240B a year earlier. The official presentation separates Retail from Generation: Generation rose to $1.426B from $1.056B, while Retail fell to $68M from $184M.
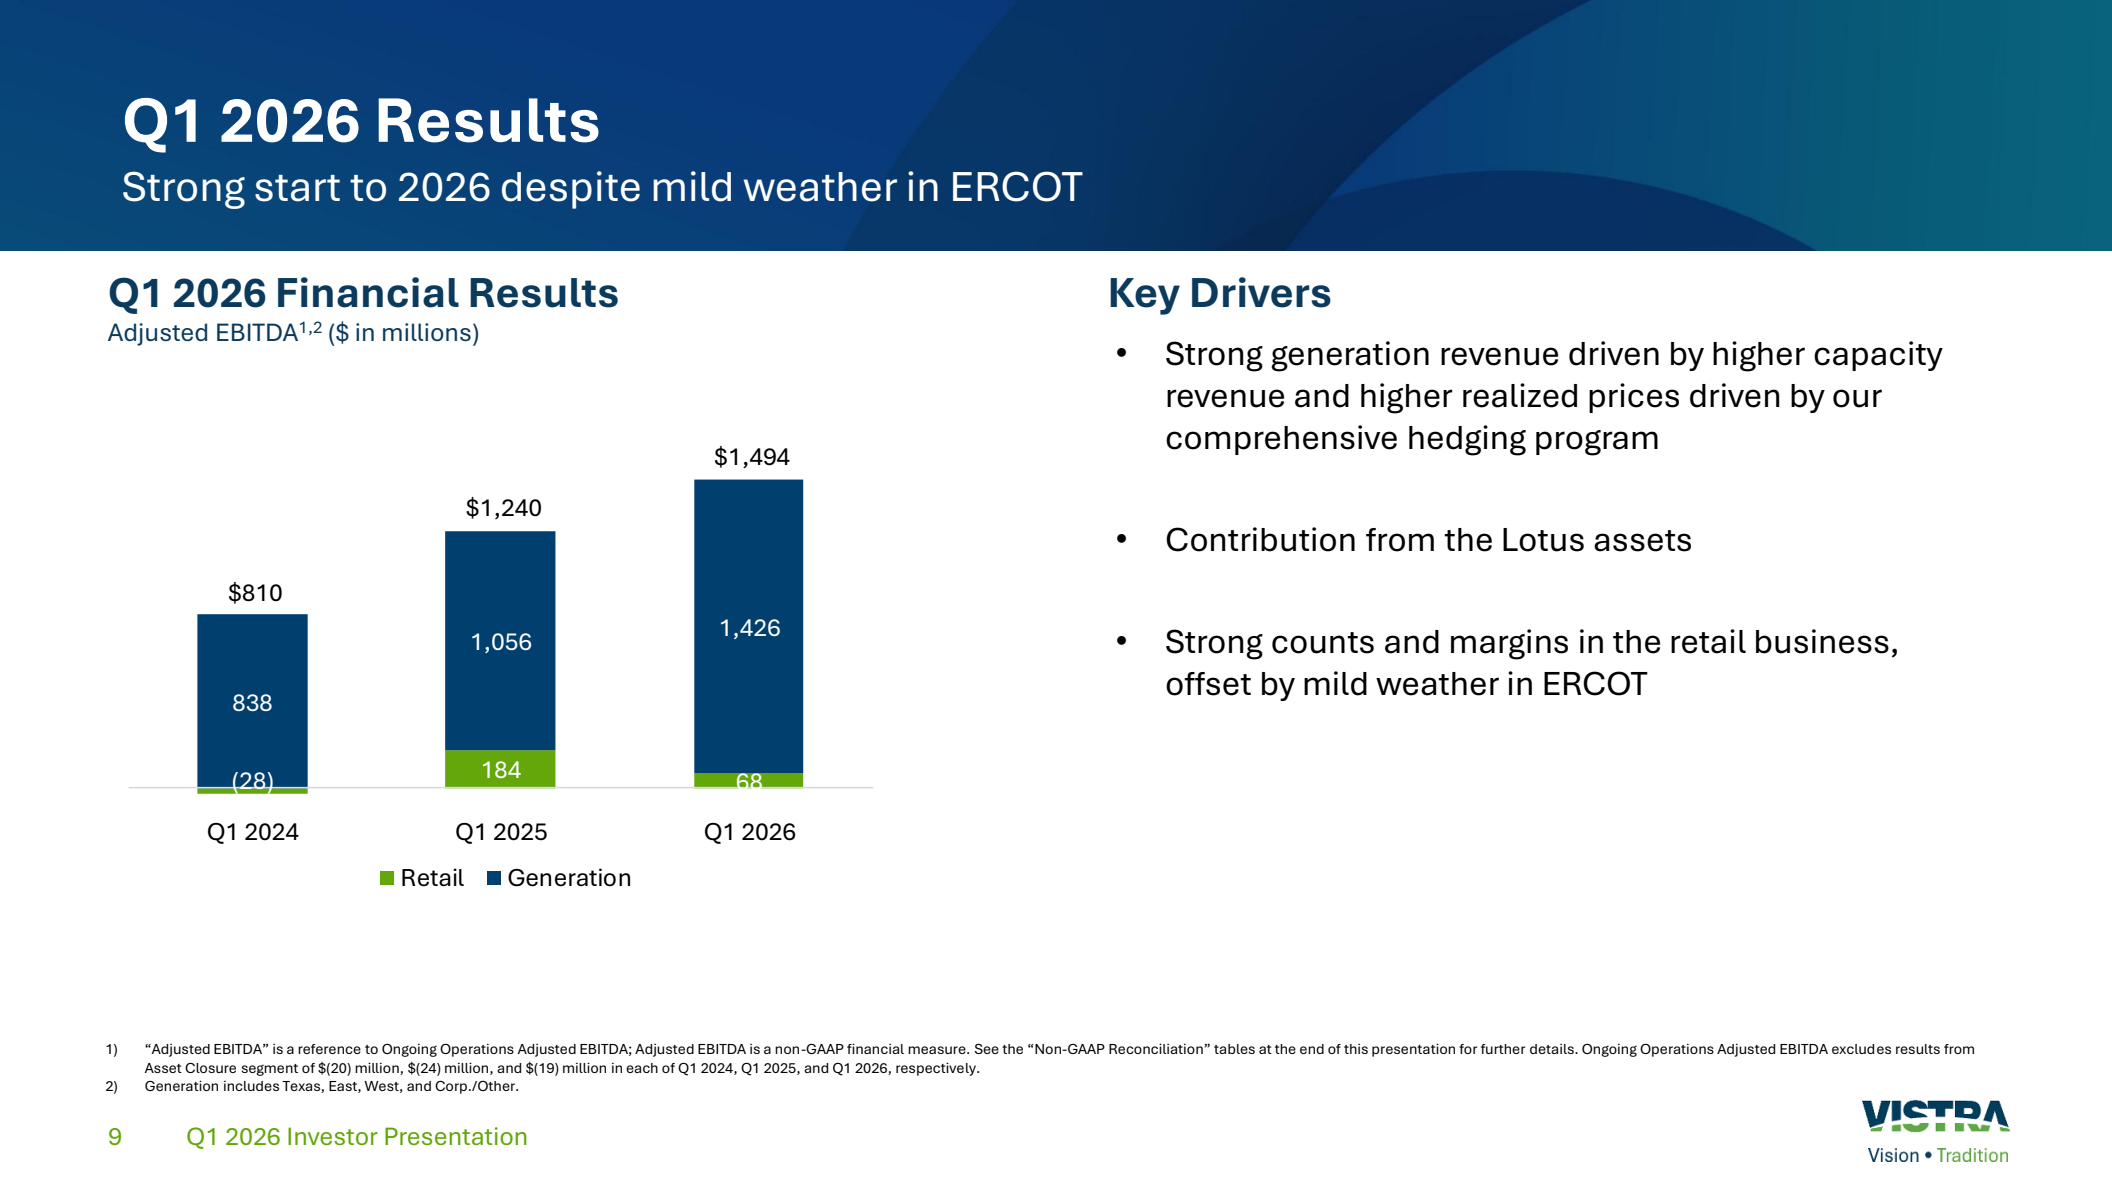
2026-05-07 and updated 2026-06-12, captured 2026-07-15. Values are USD millions; adjusted EBITDA is a company non-GAAP measure.The segment bridge is sharper than the headline. Generation added $370M, Retail removed $116M and the net change was $254M. Generation therefore supplied 145.7% of net growth because Retail offset 45.7%. Higher realized and capacity prices plus the Lotus assets drove Generation; mild ERCOT weather weighed on Retail.
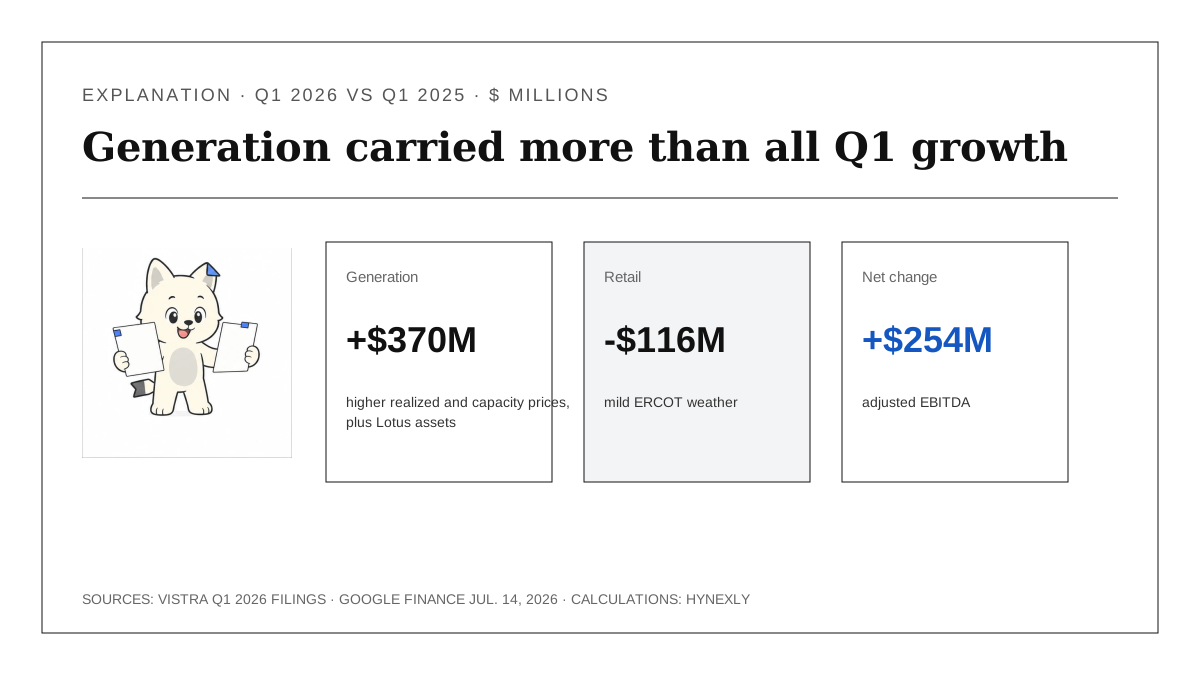
Source-derived explanation: Vistra Q1 2026 investor presentation, slide 9. Calculation: $370M / $254M = 145.7%. Nex explains the mix; the official slide above is the proof.
GAAP net income needs a different boundary. Vistra reported $1.029B and disclosed that it included a $723M unrealized gain from hedges expected to settle in future years. Subtracting that one disclosed component leaves $306M, but $306M is not adjusted net income: taxes, other mark-to-market items and the full non-GAAP reconciliation still matter. The calculation shows why GAAP profit is noisy, not what recurring earnings must be.
The second official slide puts the forward claim in one place. It shows 2026 adjusted EBITDA of $6.8B-$7.6B, adjusted FCFbG of $3.925B-$4.725B, and a $7.4B-$7.8B 2027 adjusted-EBITDA midpoint opportunity rather than guidance. The slide also identifies Meta, AWS and Cogentrix as future considerations outside the current guide.
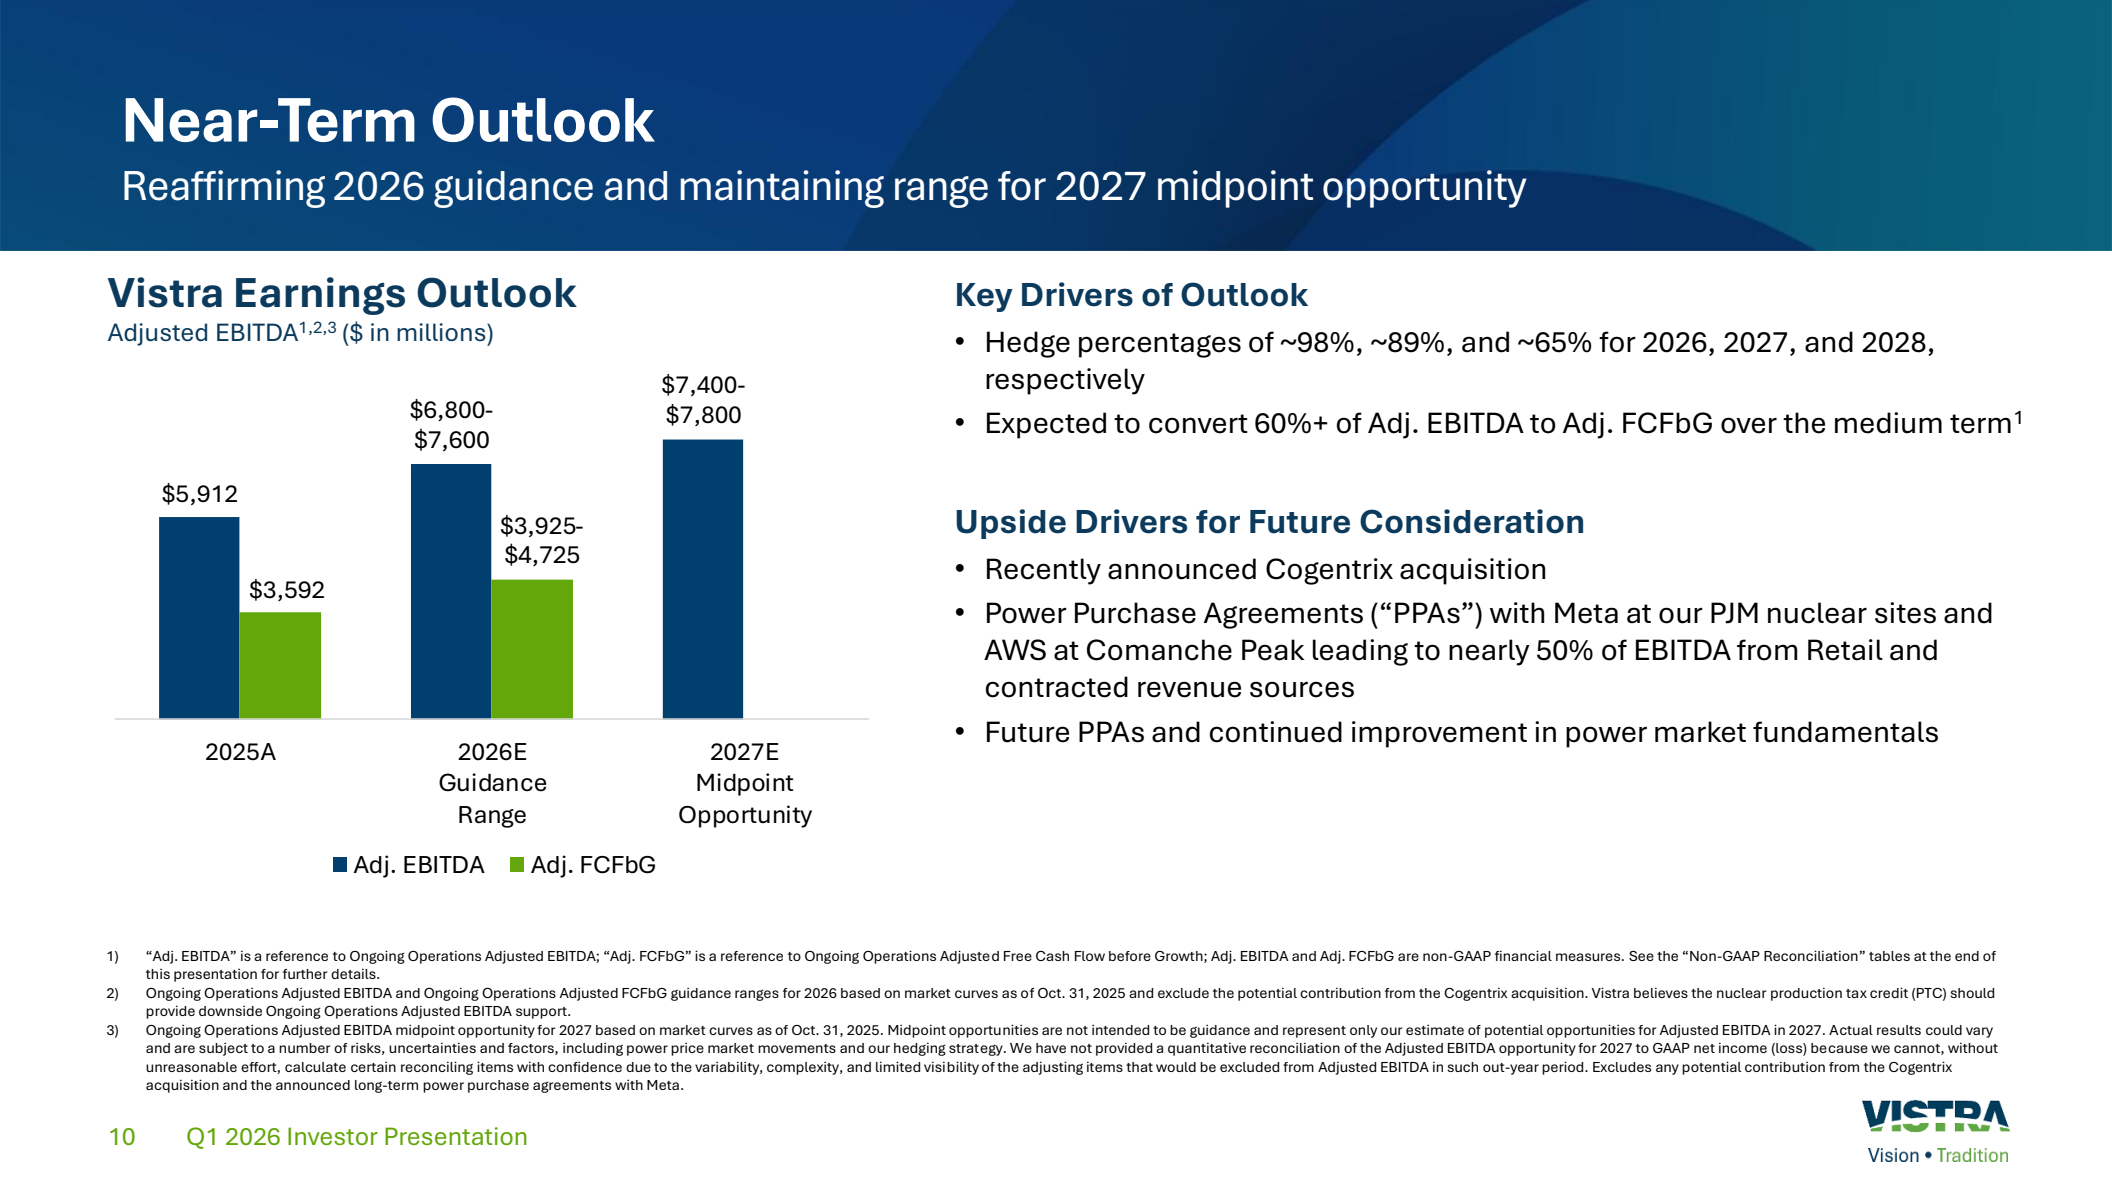
2026-05-07 and updated 2026-06-12, captured 2026-07-15; the midpoint opportunity for 2027 is not guidance and is based on market curves and company assumptions.What the Street Is Pricing
At 2026-07-14 17:12:12 UTC, Google Finance displayed VST at $158.10; multiplying that snapshot by Vistra's approximately 337M shares outstanding as of 2026-05-01 gives a $53.28B equity-value proxy. It is deliberately not presented as a live diluted market capitalization because the price and share count come from different dates.
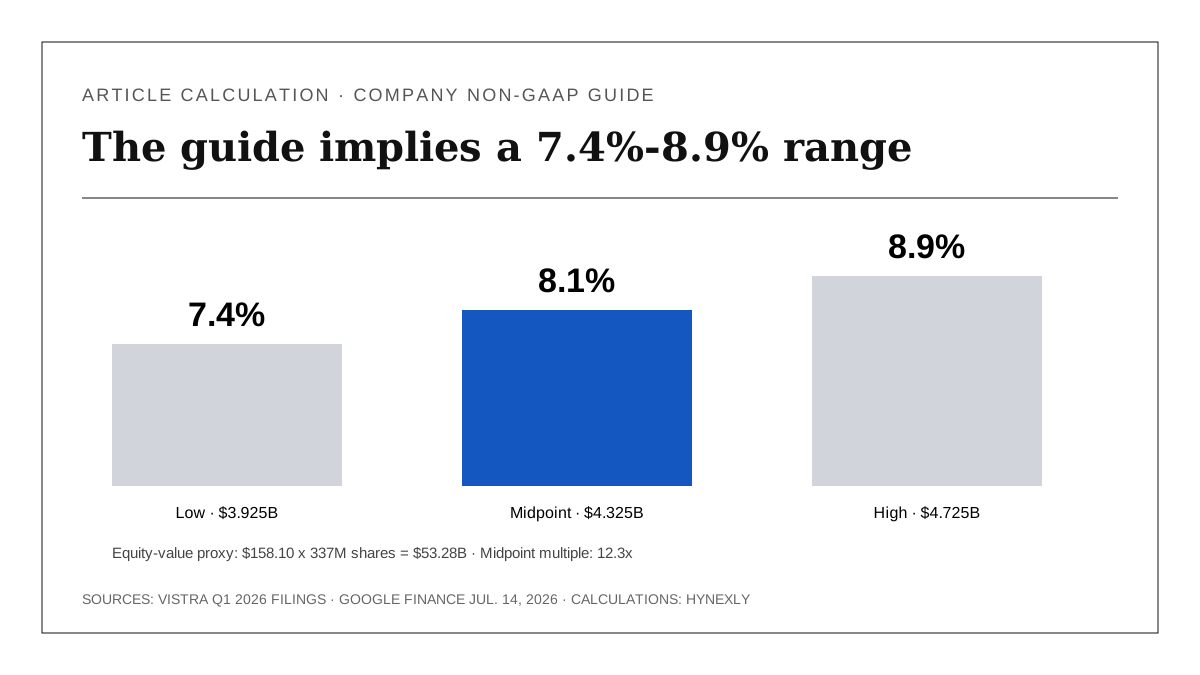
Source-derived market visual: Google Finance and Vistra Q1 earnings release. Calculations: $158.10 × 337M = $53.28B; guide divided by that proxy. This is expectation context, not a fair-value estimate.
| 2026 adjusted-FCFbG case | Guide | Per-share proxy | Yield | Price / FCFbG |
|---|---|---|---|---|
| Low | $3.925B | $11.65 | 7.4% | 13.6× |
| Midpoint | $4.325B | $12.83 | 8.1% | 12.3× |
| High | $4.725B | $14.02 | 8.9% | 11.3× |
The midpoint looks inexpensive only if the denominator is understood. Vistra defines adjusted FCFbG as adjusted free cash flow before growth and describes it as a non-GAAP liquidity and performance measure. The 2026 reconciliation deducts $1.536B of capital expenditures including nuclear fuel purchases and long-term service-agreement prepayments, but growth and development spending is handled separately. It is not the same as cash that can all be distributed without reducing future capacity.
That distinction also limits comparisons. A conventional free-cash-flow yield for another utility or generator may include a different set of capital expenditures, working-capital adjustments and asset-closure costs. The useful comparison is Vistra against its own guide, reconciliation and capital plan—not a mechanically ranked sector table with mismatched definitions.
How the Meta PPA Changes the Future Cash Path
The Meta contract adds a large but dated cash-flow layer. The 20-year PPAs cover 2,609 MW: 2,176 MW from operating Perry and Davis-Besse generation, plus 433 MW of uprates across Perry, Davis-Besse and Beaver Valley.
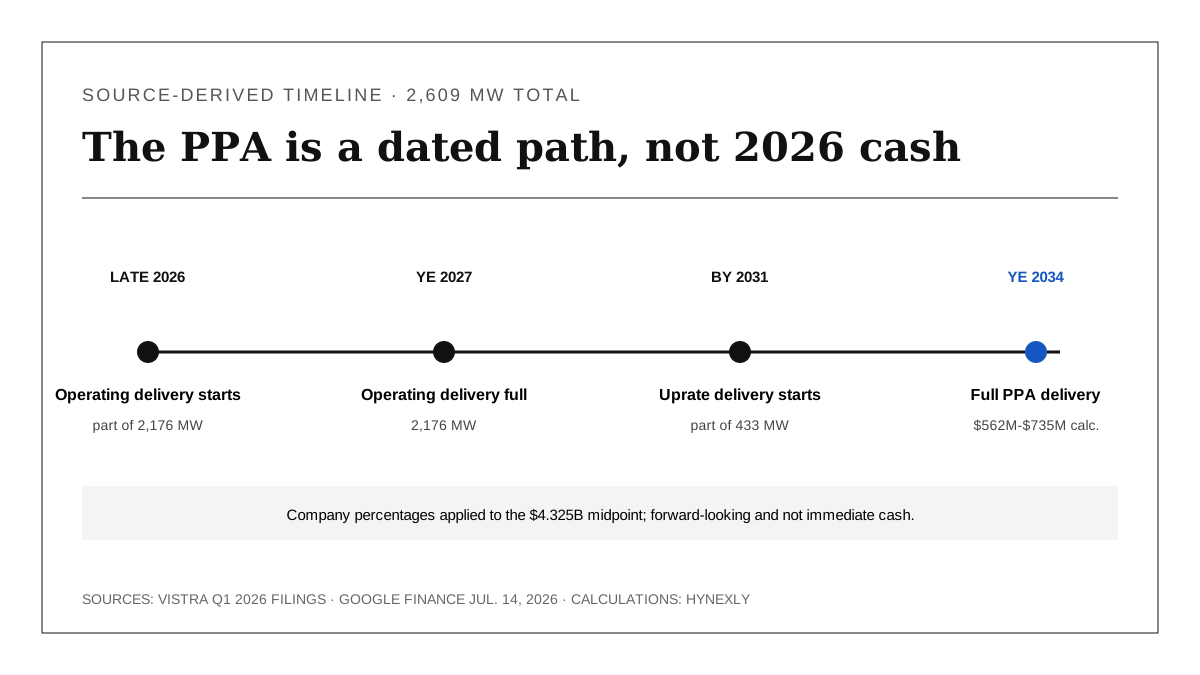
Source-derived timeline: Vistra Meta PPA Form 8-K and Q1 2026 Form 10-Q. The $562M-$735M range applies company percentages to the $4.325B midpoint and is a forward-looking article calculation.
Operating delivery begins in late 2026 and reaches full delivery by year-end 2027; uprate delivery begins in part by 2031 and is full by year-end 2034; Vistra expects 8%-10% adjusted-FCFbG accretion from operating energy and capacity plus another 5%-7% from uprates at full delivery.
Applying the combined 13%-17% to the $4.325B midpoint produces $4.325B × 13%-17% = $562M-$735M. The company also expects about 80% conversion from incremental adjusted EBITDA to incremental adjusted FCFbG, excluding uprate capex and tax effects. The result is useful for scale, but it is neither 2026 cash nor an independent forecast.
The capex timing prevents a shortcut. Vistra expects uprate spending through 2034; less than 20% is expected by year-end 2028 and precise amounts depend on regulatory approvals, engineering and capital allocation. The contract can improve long-duration visibility while still producing uneven annual cash conversion.
This is the power-side counterpart to the AI infrastructure revenue comparison. Chip suppliers report AI demand in incompatible revenue categories. Vistra's question is different: when contracted electricity demand becomes recognized cash after plant work, financing and tax effects.
Hedges Support the 2026 Guide, Not Every Future Year
Vistra reported approximately 98%, 89% and 65% of expected generation volumes hedged for 2026; 2027; and 2028 as of 2026-05-01. The detailed 2026-03-31 slide shows 99% total hedged for 2026 and 88% for 2027; the 1% point differences reflect different dates and rounding rather than a contradiction.
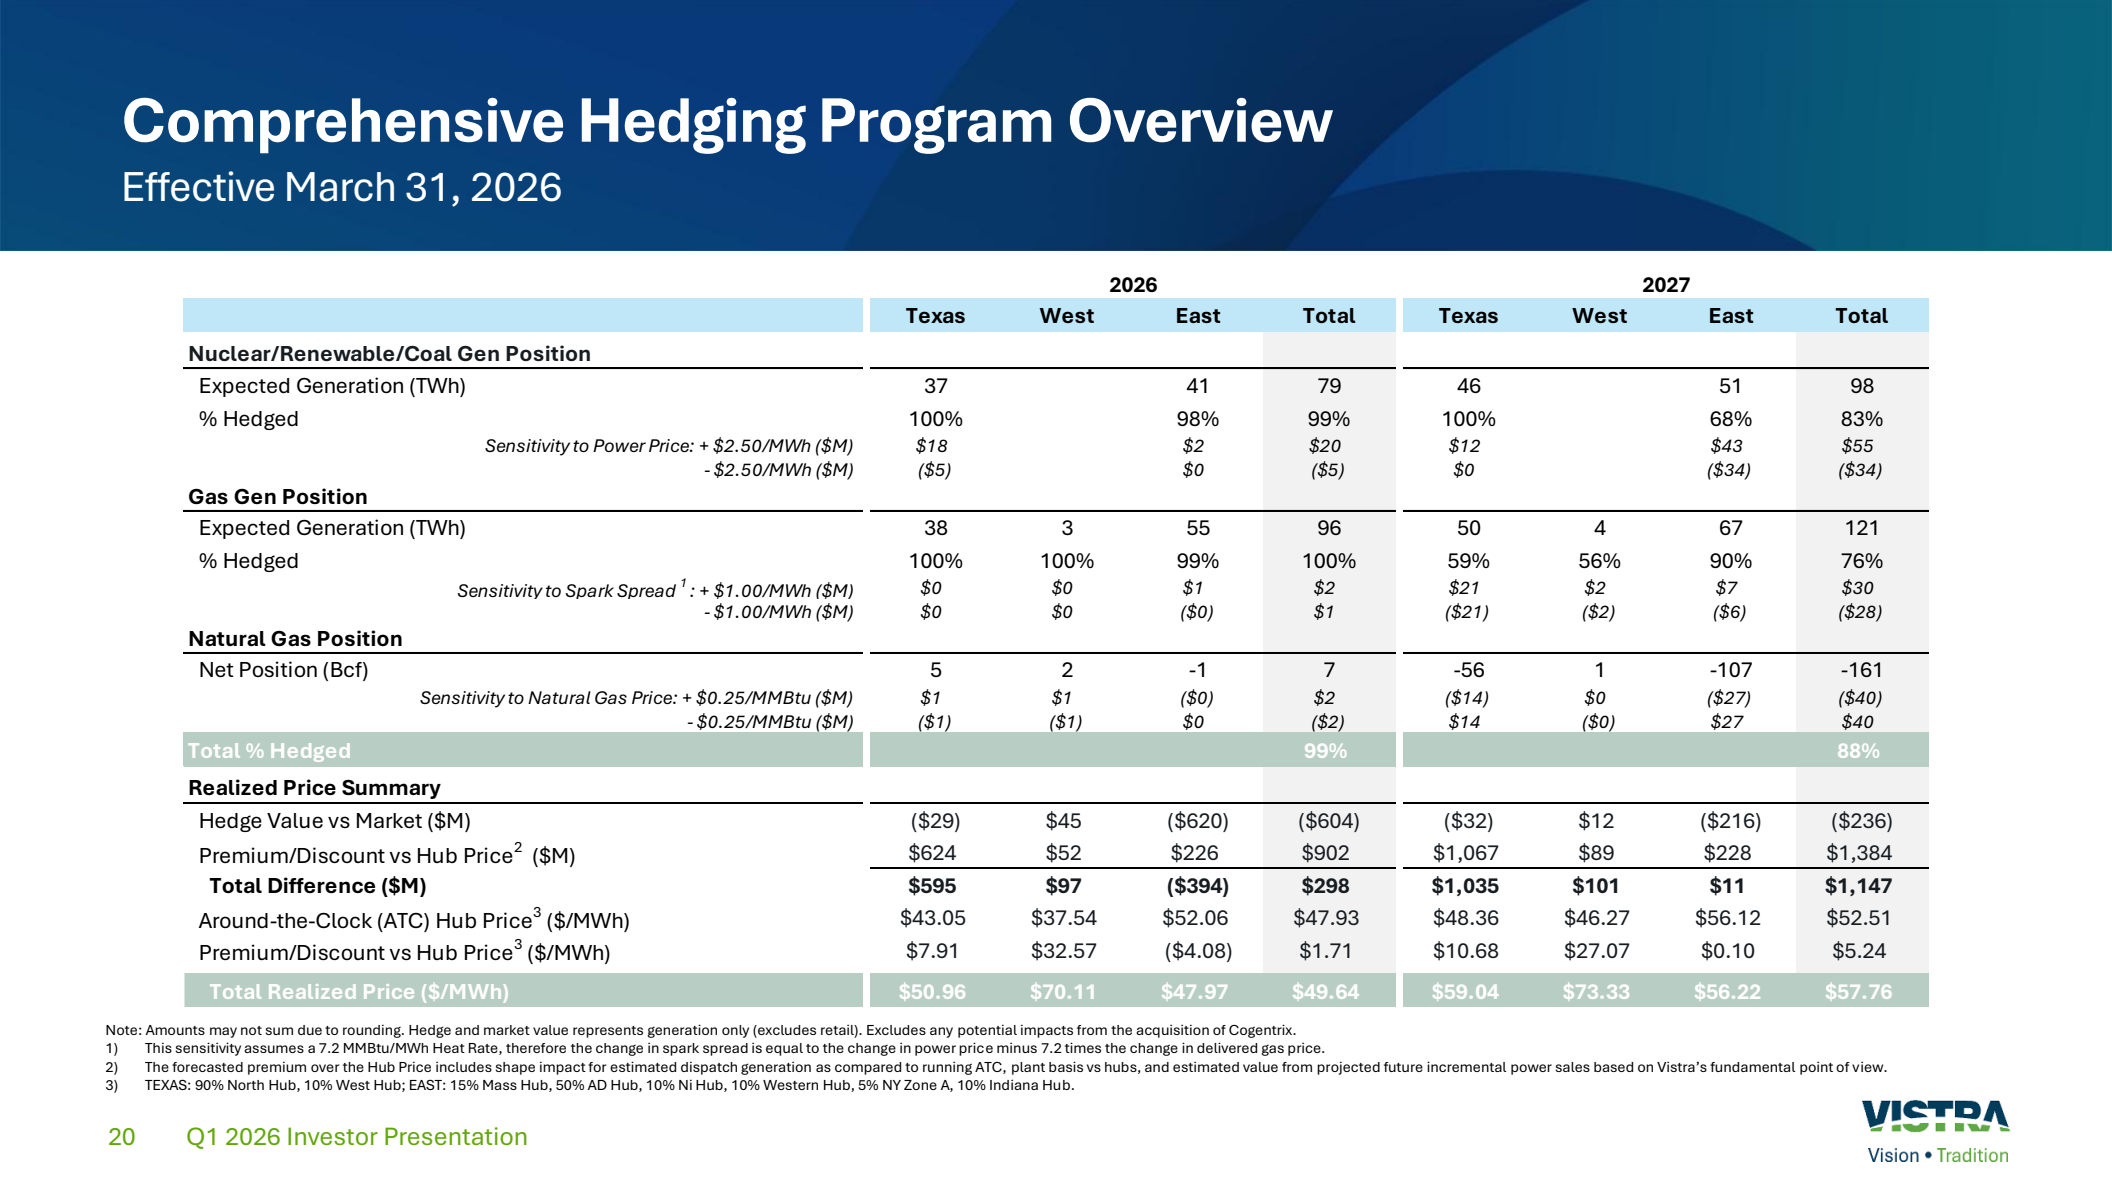
2026-03-31 and updated 2026-06-12, captured 2026-07-15. Generation only; excludes Retail and potential Cogentrix effects. Units include TWh, Bcf, $M and $/MWh.High coverage reduces near-term sensitivity to spot power and gas changes. It does not eliminate basis, shape, outages, retail weather or counterparty risk. The lower 2028 coverage is both opportunity and risk: stronger forward prices can lift realizations, while weaker markets can remove part of the expected uplift.
The fleet link matters beyond one company. GE Vernova's backlog and cash-flow test examines whether equipment demand converts through margins and working capital. Vistra tests whether generation availability, realized prices and contracts convert into cash after capital needs, while Constellation's nuclear-contracting test isolates the premium-contract inventory.
Risks to the Thesis
The first risk is measurement. Adjusted FCFbG is useful because Vistra reconciles it, but “before growth” can overstate cash available for distributions when a company is funding nuclear uprates, gas plants and acquisitions. A rising headline yield alongside rising growth cash use would not improve per-share economics automatically.
The second risk is execution and funding. Cogentrix brings approximately 5,500 MW, but its consideration includes cash, assumed debt and new shares. The Meta uprates depend on engineering and regulatory approvals through 2034; delay, cost escalation or a lower conversion ratio can shrink the calculated PPA layer.
The third risk is business mix. Generation added $370M of Q1 adjusted EBITDA, while Retail fell $116M. The integrated model is supposed to offset wholesale and retail variability. Another weak Retail quarter during volatile summer conditions would make the Q1 growth mix less reassuring.
The fourth risk is hedge roll-off. Near-term coverage is high, but it declines across later years. A contract-heavy story can still face open-market exposure, plant outages and basis differences before every PPA volume is fully delivered.
| Risk path | Current evidence | Observable warning |
|---|---|---|
| Metric boundary | 8.1% midpoint adjusted-FCFbG yield | Growth cash use rises faster than guided cash generation |
| PPA execution | 2,609 MW through 2034 | Uprate capex, approvals or delivery timing deteriorate |
| Acquisition funding | Cash, assumed debt and 5M shares | Leverage or dilution rises without matching cash accretion |
| Integrated mix | Generation +$370M; Retail -$116M | Retail stays weak as Generation growth normalizes |
| Hedge roll-off | 98% / 89% / 65% as of 2026-05-01 | Forward coverage or realized pricing weakens materially |
What Flips the Call
Vistra schedules Q2 2026 results for 2026-08-07. The decision should turn on cash conversion and capital claims, not GAAP net income alone.
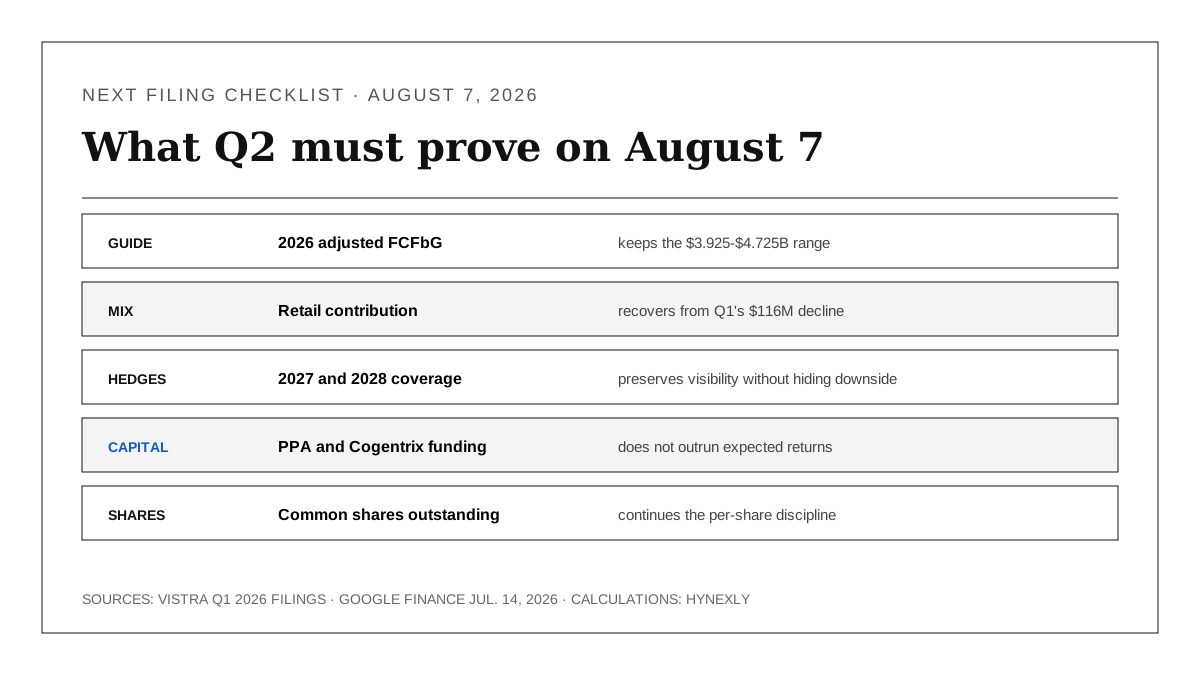
Editorial decision visual based on the Q1 earnings release, Q1 presentation, Q1 Form 10-Q and official Q2 notice. These are monitoring conditions, not company guidance or an investment rating.
| Watch item | Current evidence | Constructive condition | Weakening condition |
|---|---|---|---|
| 2026 adjusted FCFbG | $3.925B-$4.725B | Range and reconciliation remain intact | Guide is cut or conversion weakens |
| Retail | $68M Q1 adjusted EBITDA | Summer contribution recovers without eroding customer economics | Another material decline offsets Generation |
| Forward hedges | 89% for 2027; 65% for 2028 as of 2026-05-01 | Visibility remains high with clear realized-price disclosure | Coverage or realized pricing drops materially |
| Meta and Cogentrix | Excluded from 2026 guide | Funding and timing remain consistent with stated returns | Capex, leverage or dilution rises faster than accretion |
| Share count | ~337M as of 2026-05-01 | Per-share cash support survives capital allocation | Acquisition shares and funding reverse per-share progress |
The conclusion becomes more constructive if the adjusted-FCFbG range holds, Retail recovers, hedge disclosure remains transparent and the PPA/acquisition plan preserves per-share cash generation after funding. The 8.1% midpoint would then have both a near-term guide and a credible long-term extension.
It weakens if several supports fail together: the guide falls, Retail remains weak, future coverage loses value, and project or acquisition funding consumes more than the expected cash accretion. One noisy GAAP quarter would not flip the thesis. A weaker cash system would.
Methodology, Sources & Disclosure
The equity-value proxy multiplies a $158.10 public price snapshot by approximately 337M shares disclosed as of 2026-05-01. The yield range divides Vistra's 2026 adjusted-FCFbG guide by that proxy. The Meta range applies the company's combined 13%-17% full-delivery accretion percentages to the $4.325B midpoint. Mixed dates, non-GAAP definitions and forward-delivery boundaries are disclosed beside the calculations.
- Vistra Q1 2026 earnings release, dated
2026-05-07 - Vistra Q1 2026 investor presentation, dated
2026-05-07, updated2026-06-12 - Vistra Q1 2026 Form 10-Q, filed
2026-05-08 - Vistra Meta PPA Form 8-K, filed
2026-01-09 - Vistra Q2 2026 reporting notice, dated
2026-07-06 - Google Finance Vistra market snapshot, observed
2026-07-14 17:12:12 UTC
Facts, calculations, image captures and links were rechecked as of 2026-07-15. AI assisted with source organization, deterministic chart production and EN/KO consistency checks; the official sources, calculations and final wording require human review before production deployment. No sponsorship or affiliate relationship with Vistra, Meta or Google is disclosed. This is general information, not individualized investment advice; it does not issue an investment rating or share-price objective.