Energy & Commodities
GE Vernova's $163B Backlog: What Q2 Must Prove
GE Vernova entered Q2 with $163.3B of RPO and 1.96× orders-to-revenue. The decision test is whether Power and Electrification convert that demand into margin and durable cash.
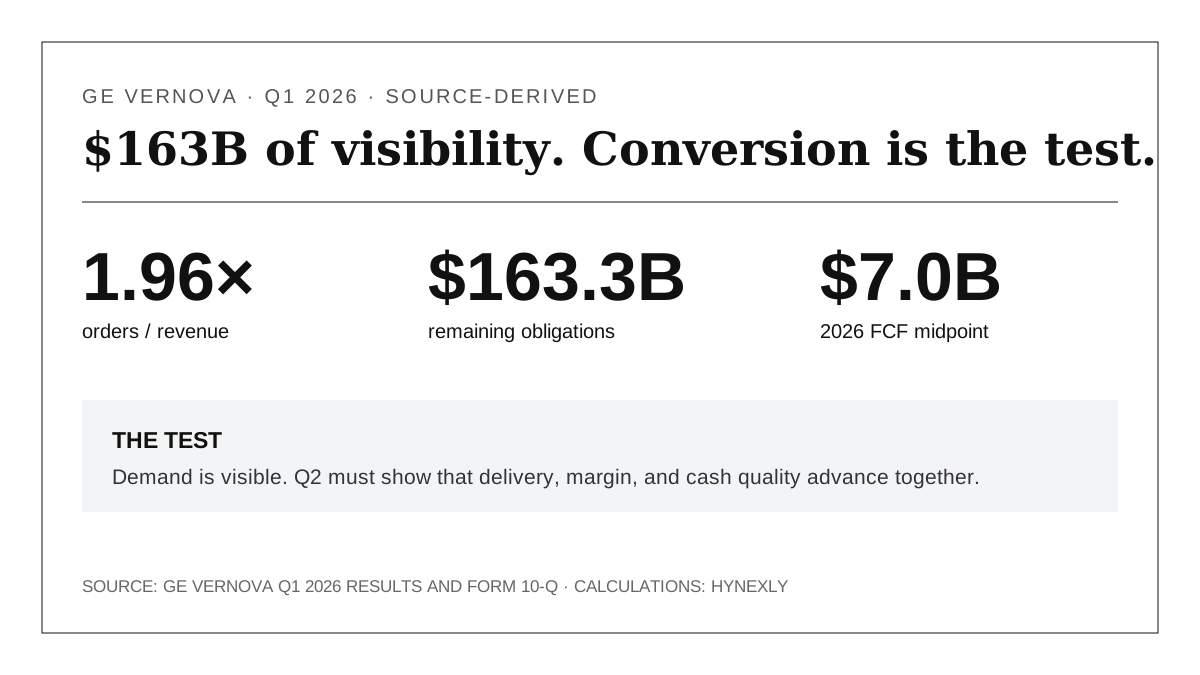
GE Vernova entered the second quarter with unusually strong demand evidence. Q1 orders were $18.3B against $9.339B of revenue, a source-derived book-to-bill ratio of about 1.96×. Remaining performance obligations, or RPO, reached $163.276B.
The important distinction is that RPO is not revenue already earned. It is contracted revenue allocated to work that remains unsatisfied or partially unsatisfied. The investment question is whether that visibility becomes equipment delivery, segment margin, and durable cash quickly enough to support a market value near $288.6B.
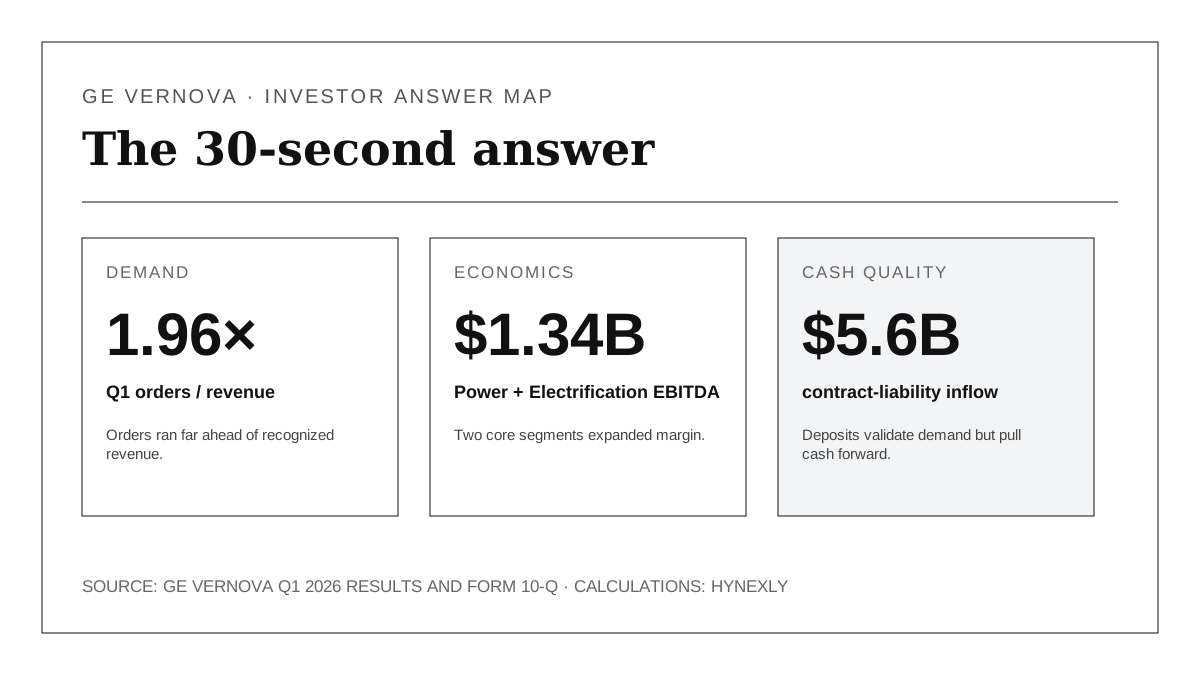
Source-derived answer map: GE Vernova Q1 2026 results and Form 10-Q. Calculations use rounded company disclosures.
| The 30-second answer | Verified evidence | What remains unproven |
|---|---|---|
| Demand is real | Orders / revenue ≈ 1.96×; RPO $163.3B | Delivery timing and cancellation or modification risk |
| Two segments are converting | Power margin 16.3%; Electrification margin 17.8% | Whether Q2 stays inside company outlook |
| Reported cash was strong | CFO $5.188B; FCF $4.791B | How much cash conversion persists without another large deposit inflow |
Thesis
GE Vernova's Q1 evidence supports a constructive operating thesis with a strict valuation boundary. Power and Electrification are benefiting from gas-turbine demand, grid investment, and data-center power requirements. Their combined adjusted EBITDA was $1.339B, and both segments expanded margin sharply year over year. Services also represented 53.5% of total RPO, giving the order book a longer-duration component than equipment alone.
The boundary is conversion. A large order book can raise production requirements, inventory, customer advances, and execution exposure before it becomes revenue. Wind also remained a material drag. Using the market value observed on 7/14 investors were paying roughly 6.41× the midpoint of 2026 revenue guidance and 41.2× the midpoint of 2026 free-cash-flow guidance, using market capitalization rather than enterprise value.
That does not establish that the shares are expensive or cheap. It establishes the evidence burden: orders, delivery, segment margin, and cash quality need to improve together. A rising backlog with weaker conversion would not satisfy the same thesis.
Source Evidence Snapshot
The Form 10-Q defines the backlog precisely. At quarter-end equipment RPO was $75.924B and services RPO was $87.352B. GE Vernova expected 38% of equipment RPO to be recognized within one year, compared with 16% of services RPO. It also stated that contract modifications can change both timing and amount.
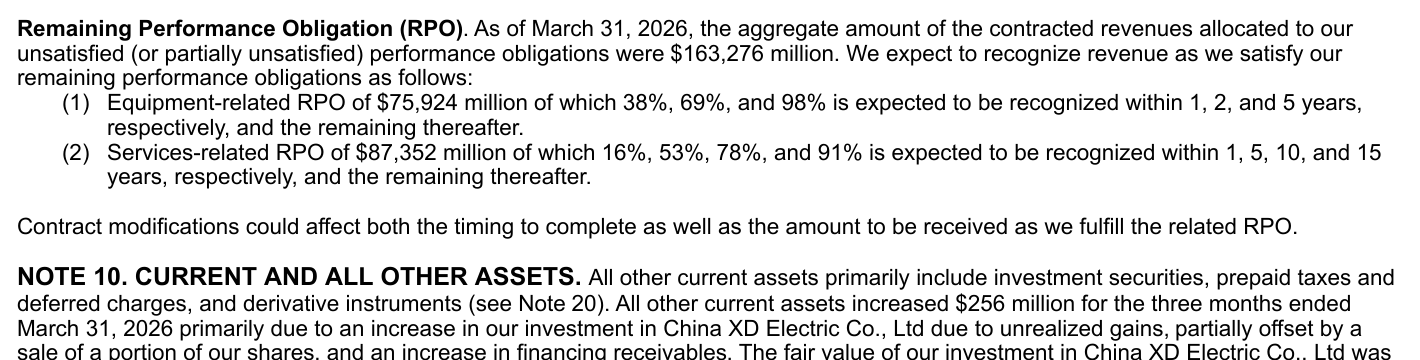
2026-04-22, captured 2026-07-15. Values are USD millions.Applying those recognition percentages produces approximately $42.827B expected within one year: $75.924B × 38% + $87.352B × 16%. That equals about 95.2% of the $45.0B midpoint of 2026 revenue guidance. This is a visibility comparison, not a forecast that the two values must match. RPO can be recognized on a different schedule, and annual revenue can include work outside the quarter-end RPO balance.
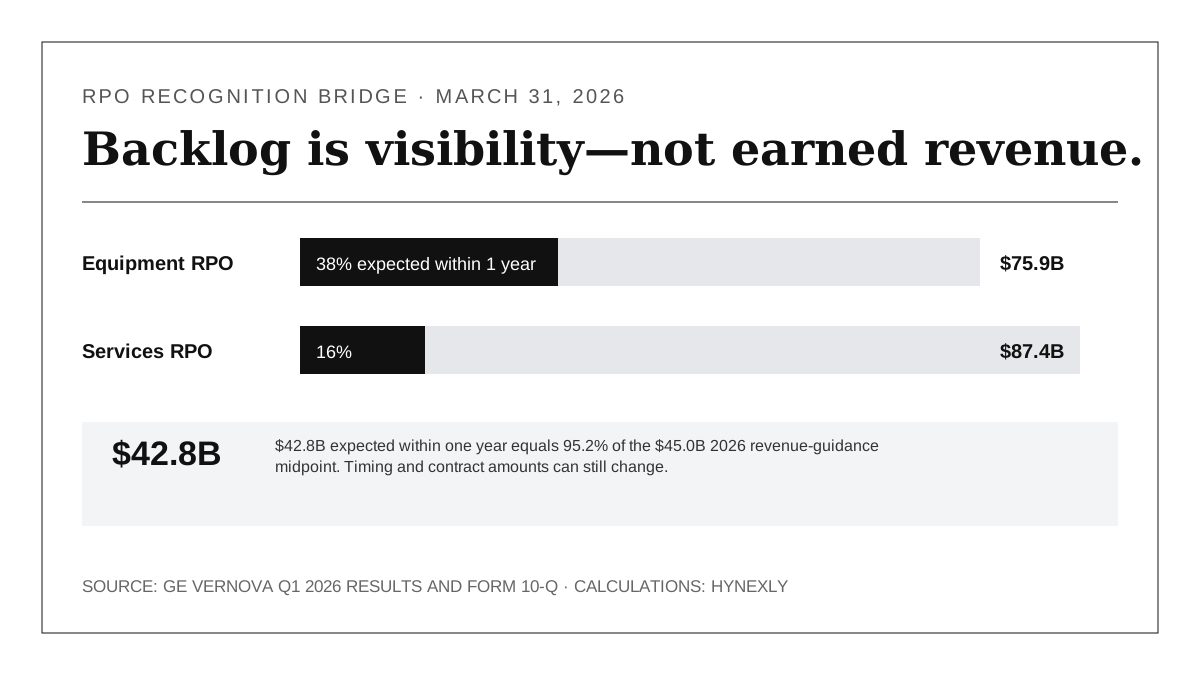
Source-derived visual: GE Vernova Q1 2026 Form 10-Q. Calculation: $75.924B × 38% + $87.352B × 16% = $42.827B.
The segment results show where conversion is already visible. Power orders were $10.008B, revenue was $4.971B, and adjusted EBITDA margin improved to 16.3% from 11.6% a year earlier. Electrification orders were $7.112B, revenue was $2.959B, and margin improved to 17.8% from 11.1%.
Wind moved the other way. Revenue fell to $1.432B and adjusted EBITDA declined to a $382M loss. That loss equaled about 28.5% of the $1.339B combined adjusted EBITDA from Power and Electrification.
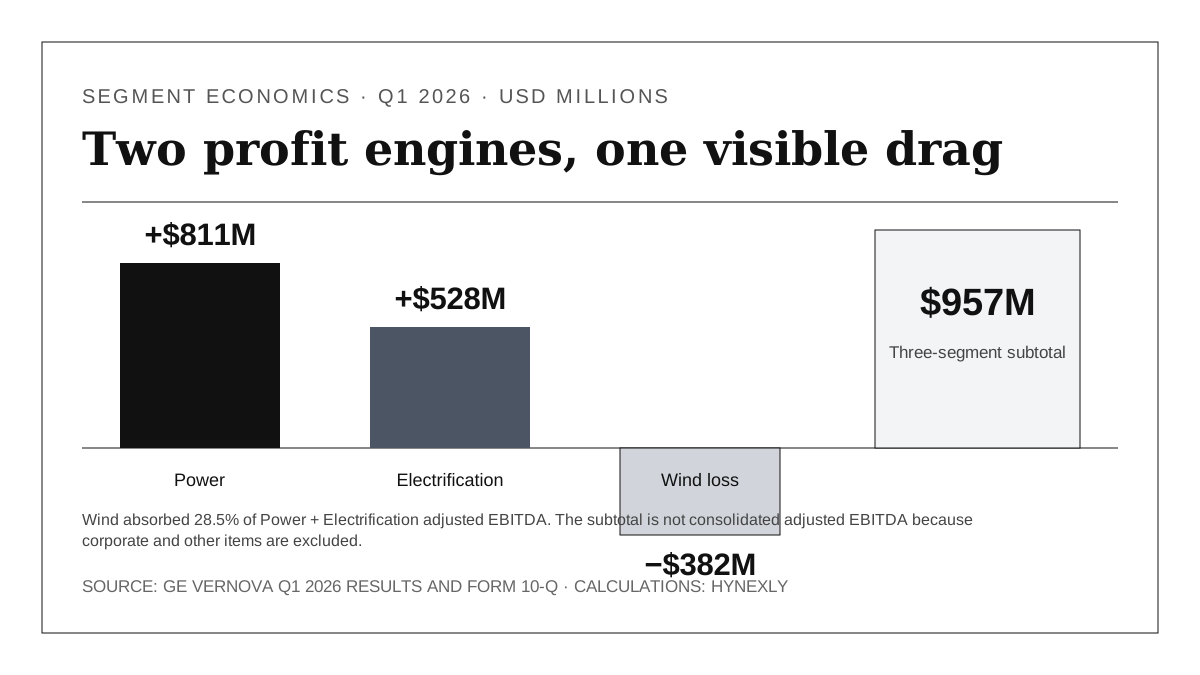
Source-derived visual: GE Vernova Q1 2026 earnings presentation. The $957M three-segment subtotal excludes corporate and other items and is not consolidated adjusted EBITDA.
This physical-infrastructure layer connects to the site's existing AI infrastructure evidence map: accelerator and networking demand can only become deployed capacity when power generation and grid equipment arrive. The guide to reading AI revenue claims provides the parallel discipline here—reported revenue, future guidance, and long-cycle targets should not be mixed into one number.
The cash-flow statement adds the most important counterweight. GE Vernova generated $5.188B of operating cash and $4.791B of free cash flow in Q1. But operating cash included a $5.3B working-capital inflow, driven mainly by a $5.574B increase in contract liabilities and current deferred income from down payments and milestone collections. Inventory absorbed $0.9B.
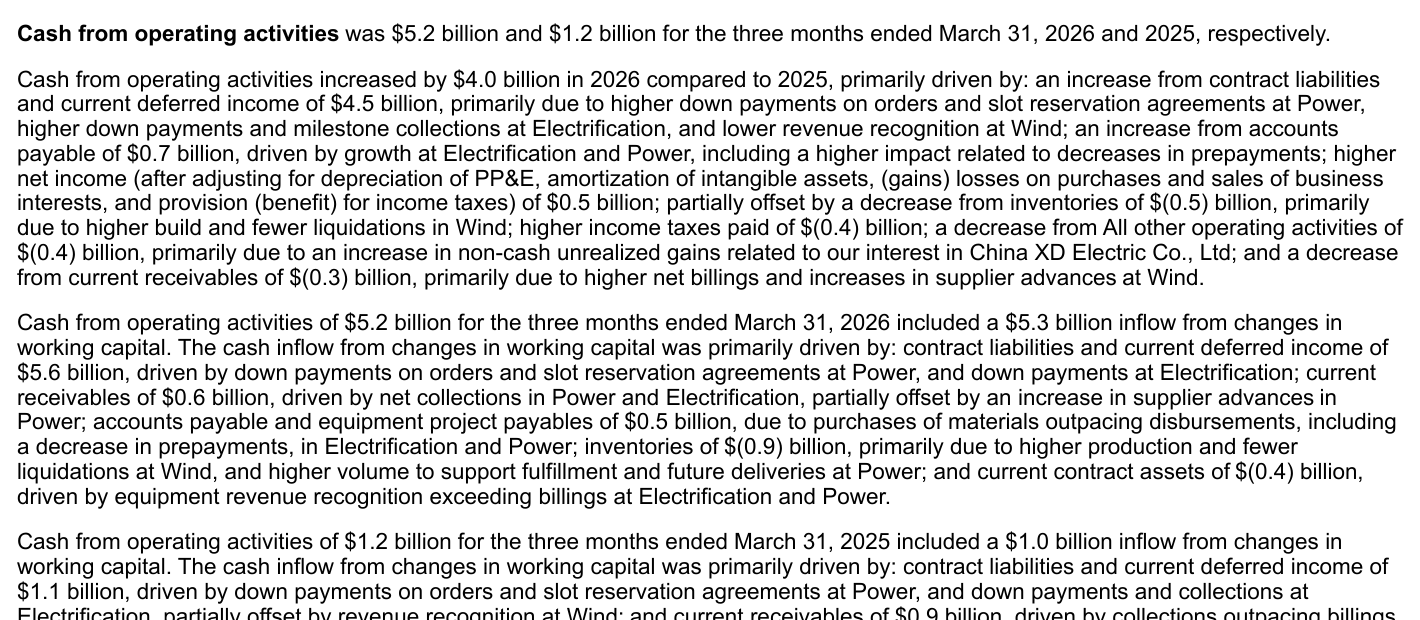
2026-04-22, captured 2026-07-15. Parentheses indicate cash outflows.Customer deposits are not fake cash. They show that customers are willing to commit capital before delivery, and they can help finance working capital. The timing boundary is still essential: a deposit raises cash before the related equipment is delivered and revenue is recognized. Contract-liability inflow equaled roughly 116% of reported Q1 free cash flow, so the next filing should separate fresh deposits from delivery-driven cash conversion.
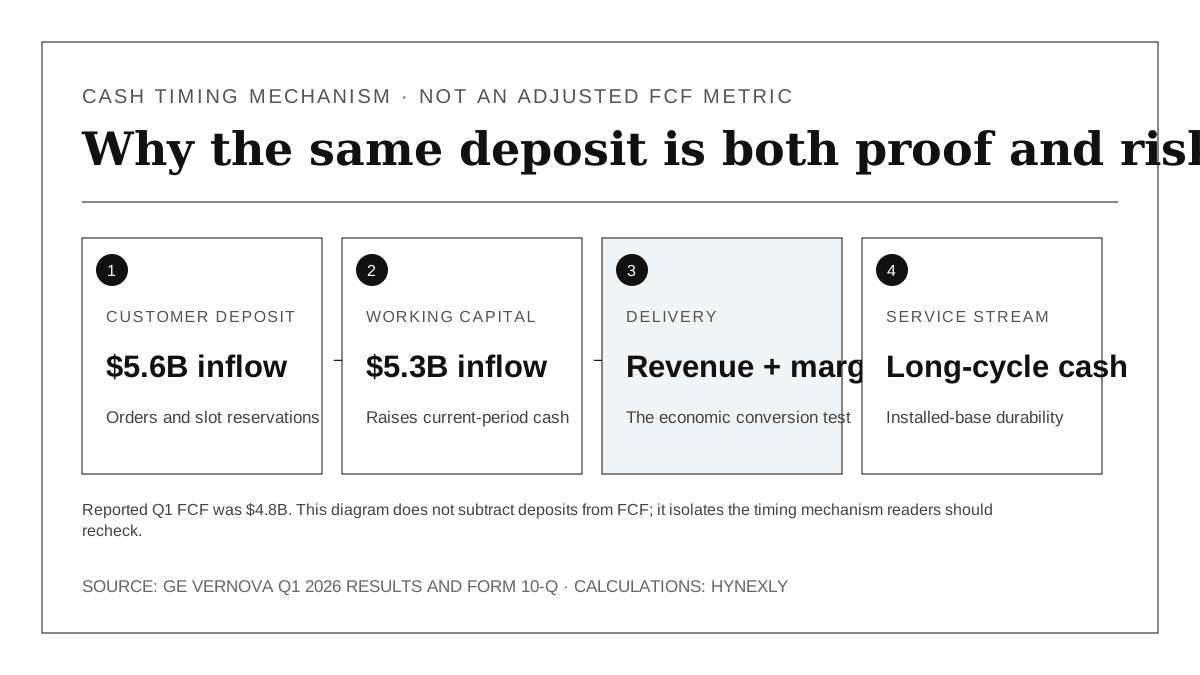
Source-derived mechanism: GE Vernova Q1 2026 Form 10-Q. This is not an adjusted-FCF calculation; it separates the timing stages described in the filing.
What the Street Is Pricing
This article does not use private consensus data, price objectives, or an investment rating. It uses a timestamped public market snapshot to size the expectation embedded in the equity value.
At 2026-07-14 10:50:49 EDT, Google Finance displayed GEV at $1,072.30 and a market capitalization near $288.60B. Market data changes continuously, so the following ratios are rough expectation gauges rather than permanent valuation inputs.
| Market-value bridge | Value | Boundary |
|---|---|---|
| 2026 revenue guidance | $44.5B–$45.5B | Company guidance |
| Revenue midpoint | $45.0B | Article midpoint |
| 2026 FCF guidance | $6.5B–$7.5B | Company non-GAAP guidance |
| FCF midpoint | $7.0B | Article midpoint |
| Market cap / revenue midpoint | ~6.41× | Market cap, not enterprise value |
| Market cap / FCF midpoint | ~41.2× | Guidance-based and time-sensitive |
| FCF midpoint / market cap | ~2.43% | Not a forecast dividend or shareholder yield |
These ratios say more about required execution than intrinsic value. If backlog conversion and segment margin compound for several years, a trailing snapshot will understate future economics. If customer advances slow before deliveries and margins catch up, the same market value leaves less room for an execution miss.
Risks to the Thesis
The first risk is timing and contract quality. RPO is stronger than a non-binding market-size estimate, but the filing explicitly allows for modifications that can affect timing and amount. Long-cycle equipment and service agreements also carry execution and cost-estimation risk.
The second risk is capacity and supply. GE Vernova must add manufacturing capacity and execute a larger equipment backlog while controlling material, labor, and logistics costs. An order does not contribute margin until the company delivers it at acceptable economics.
The third risk is cash-flow reversal. Down payments bring cash forward; later production, inventory, and delivery consume working capital. Q1's $5.6B contract-liability inflow and $0.9B inventory outflow show both sides of that cycle.
The fourth risk is portfolio mix. Power and Electrification improved, but Wind lost $382M of adjusted EBITDA. The thesis is weaker if Wind losses exceed the company's outlook or if profitable segments have to fund a longer restructuring.
The fifth risk is acquisition integration. Prolec GE added roughly $5B of backlog and increased Electrification capability, but the transaction also added goodwill and debt. Reported Q1 net income included a large M&A gain, so it is not a clean proxy for recurring operating earnings.
| Risk path | Current evidence | What would weaken the thesis |
|---|---|---|
| RPO conversion | $163.3B total RPO | Timing slips or contract modifications outpace new conversion |
| Manufacturing | Equipment orders +106% organically | Inventory and costs rise faster than deliveries |
| Cash timing | $5.6B contract-liability inflow | FCF falls when deposits normalize before margin scales |
| Wind | Q1 adjusted EBITDA loss of $382M | Q2 loss exceeds the $200M–$300M company outlook |
| Expectation | ~41.2× FCF-guidance midpoint | Delivery, margin, and cash disappoint together |
What Flips the Call
GE Vernova will present Q2 2026 results on 7/22 at 7:30 a.m. EDT. The company already supplied segment outlook ranges, which makes the next test observable rather than narrative.
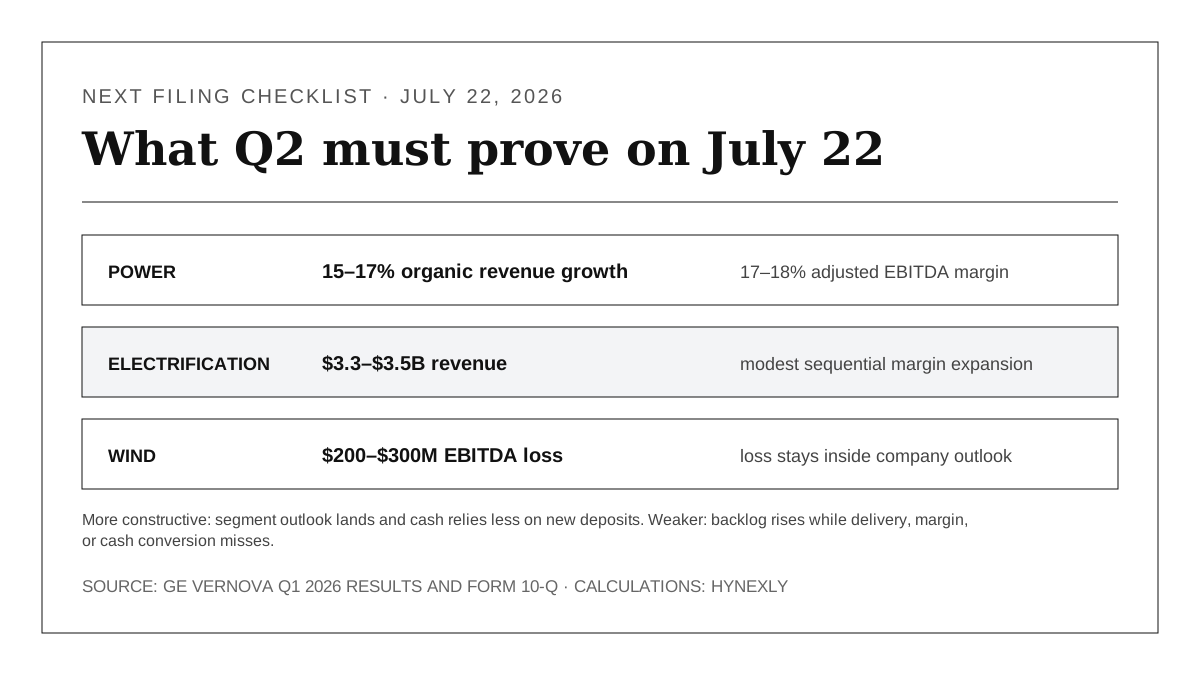
Source-derived decision visual: GE Vernova Q1 2026 earnings presentation and official Q2 webcast notice. All displayed segment ranges are company outlook.
The conclusion becomes more constructive if Power delivers 15%–17% organic revenue growth and 17%–18% adjusted EBITDA margin, Electrification reports $3.3B–$3.5B of revenue with modest sequential margin expansion, and Wind's loss stays within $200M–$300M. Cash quality also improves if operating cash relies less on fresh contract liabilities while revenue and segment profit continue to scale.
The conclusion weakens if backlog rises but Power or Electrification misses its outlook, if Wind loses more than $300M, or if another large deposit inflow is necessary to keep free cash flow near the annual target without matching delivery and margin progress.
The decision boundary is simple: GE Vernova has already proved that customers want more power and grid equipment. Q2 must show that the order book is becoming delivered revenue, profitable capacity, and repeatable cash—not only a larger promise.
Methodology, Sources & Disclosure
This article separates company-reported facts, company outlook, third-party market data, article calculations, and editorial monitoring thresholds. Orders-to-revenue divides Q1 orders by reported revenue. The one-year RPO estimate applies company-disclosed recognition percentages to equipment and services RPO. Segment comparisons use adjusted EBITDA, a non-GAAP measure. Market-value ratios use market capitalization, not enterprise value.
- GE Vernova Q1 2026 financial results,
2026-04-22 - GE Vernova Q1 2026 earnings presentation,
2026-04-22 - GE Vernova Form 10-Q for the quarter ended 2026-03-31, filed
2026-04-22 - GE Vernova Q2 2026 earnings webcast, scheduled
2026-07-22 - Google Finance GEV market snapshot, observed
2026-07-14 10:50:49 EDT
Facts and links were rechecked as of 2026-07-15. AI assisted with structure and consistency checks; the official sources, calculations, captures, EN/KO parity, and final wording require human review before production deployment. No sponsorship or affiliate relationship with GE Vernova is disclosed. This is general information, not individualized investment advice; it does not issue an investment rating or share-price objective.