NVIDIA, Broadcom, Qualcomm: What Each AI Business Still Has to Prove
NVIDIA and Broadcom already depend heavily on different AI-related businesses. Qualcomm has real revenue and an Amazon collaboration—but a separate financial ramp to prove.
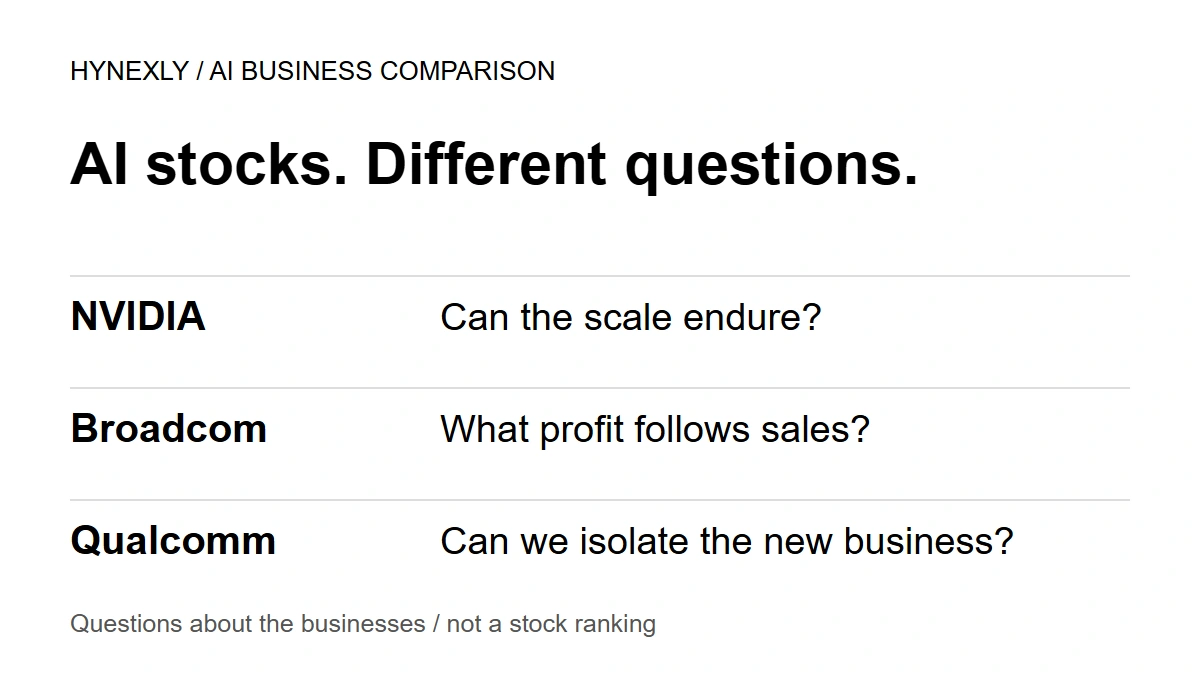
Owning three AI-linked stocks does not mean owning three versions of the same business. NVIDIA's Data Center platform already accounts for most of its sales. Broadcom's AI semiconductor category is narrower, but it has become a majority of company revenue. Qualcomm has an existing Data Center business and a named Amazon collaboration; its future scale is still a different question.
The useful comparison is what each business has already proved, and what financial evidence is still missing. That tells you where to investigate. It does not tell you which stock offers the best return.
Start with the business behind the stock
| Company | Evidence already available | Question still open |
|---|---|---|
NVIDIA | A large, reported Data Center platform | Can its sales produce durable profit and cash? |
Broadcom | AI semiconductor revenue is a majority of company sales | What economics sit inside that combined AI category? |
Qualcomm | Existing Data Center revenue and an Amazon collaboration | What are the separately measurable revenue ramp and margins? |
Comparison framework from the official filings and announcements linked below. These are research questions, not investment ratings.
A stock represents the whole company. The place an AI-related business occupies inside that company matters alongside its headline size. Keep the AI revenue reading guide nearby if the distinction between a reported result and a target is unfamiliar.
Two large businesses, with different boundaries
NVIDIA's Data Center platform generated 92.5% of company revenue in Q2 FY2027. The calculation uses the precise figures in Note 13 of its quarterly filing, not a forecast. The business is already central to NVIDIA's reported sales.

That proves current scale, not the profitability of each product. Data Center is NVIDIA's market-platform category, not a standalone AI-chip segment. To test whether the scale is attractive, revenue needs to be read beside margins and cash collection. The Blackwell cash-conversion investigation follows that next step.
Broadcom's 56.4% is a different kind of concentration. It divides Q3 FY2026 AI semiconductor revenue by total company revenue. Using only the semiconductor segment as the denominator instead gives about 80.1%. Neither denominator is wrong; each answers a different question.
| Reported quarter and category | Category revenue | Company revenue | Within-company share |
|---|---|---|---|
NVIDIA Q2 FY2027 Data Center | $89.023B | $96.221B | 92.5% |
Broadcom Q3 FY2026 AI semiconductors | $16.7B | $29.591B | ≈56.4% |
Hynexly calculations from NVIDIA's 10-Q, p. 24 and Broadcom's September 2 release. Quarters ended July 26 and August 2, 2026 respectively. USD billions; these are not matching product scopes or market shares.
Broadcom's quarterly filing reports semiconductor sales of $20.839B and infrastructure software sales of $8.752B. The rounded AI number sits inside the former. Dividing an AI revenue subset by a segment total does not produce an AI margin. Nor does the combined figure reveal the split between custom accelerators and AI networking. The Broadcom business-mix review examines what that aggregation leaves unresolved.
Qualcomm is not starting from zero
The important correction to a target-only account of Qualcomm appears in its Q3 FY2026 filing. Data Center equipment-and-services revenue increased $88M year over year, primarily because of the Alphawave acquisition. That is a change in revenue, not the total.
The separate reporting puzzle takes one more step. Subtract the chip business, QCT, and licensing business, QTL, from company revenue. What remains?
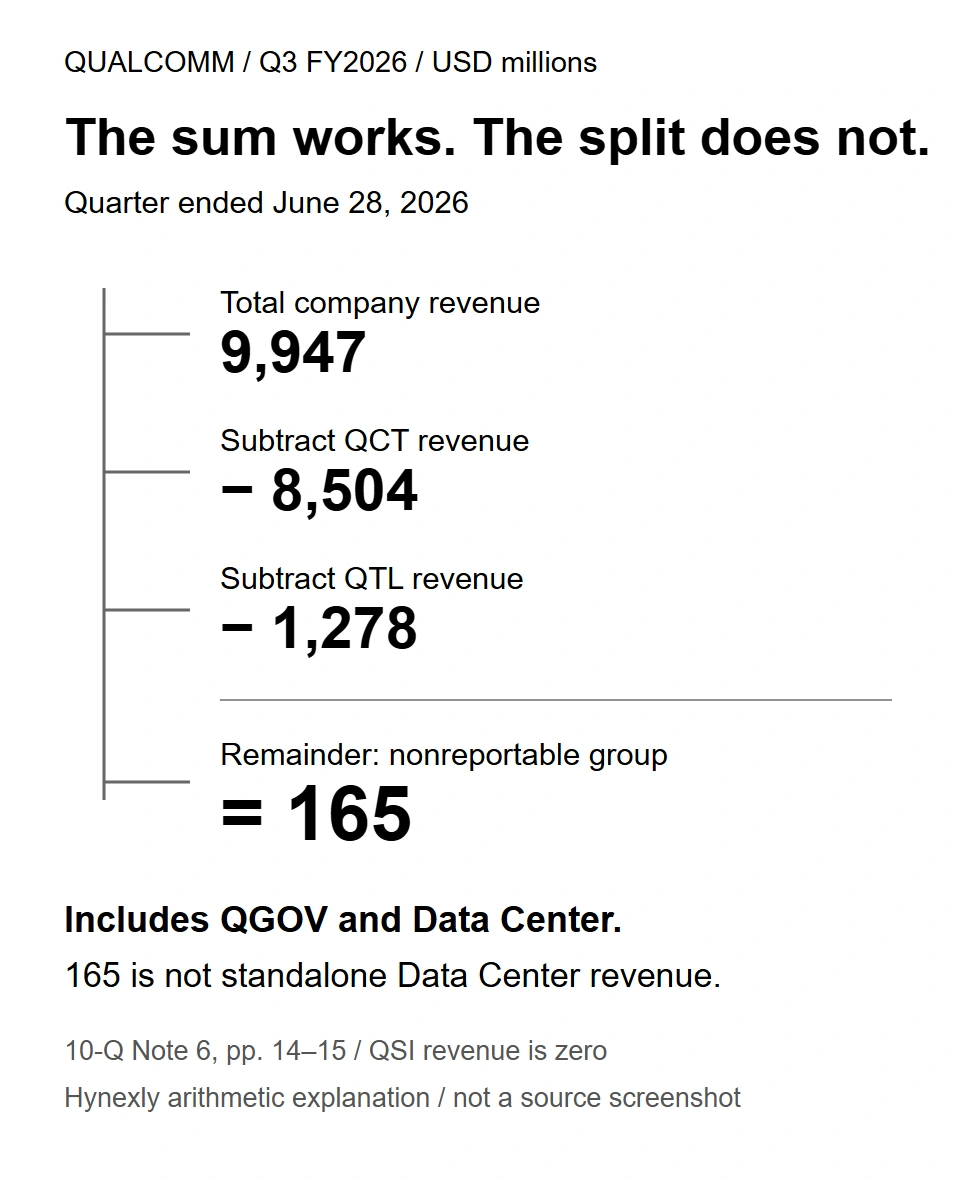
The remainder equals about 1.7% of company revenue. It covers a group that includes the government business, QGOV, as well as Data Center. Calling the whole remainder Data Center would assign another business's sales to the AI story. The filing establishes activity without giving this calculation a standalone Data Center answer.
This also explains why the comparison table has no invented Qualcomm percentage. A missing comparable line is a limit on our measurement. It is not evidence that the underlying business has no sales.
Keep the target—and the commercial countercase
Qualcomm's June 24 Investor Day set an annual Data Center target above $15B by FY2029. Its presentation sketches the intended ramp:
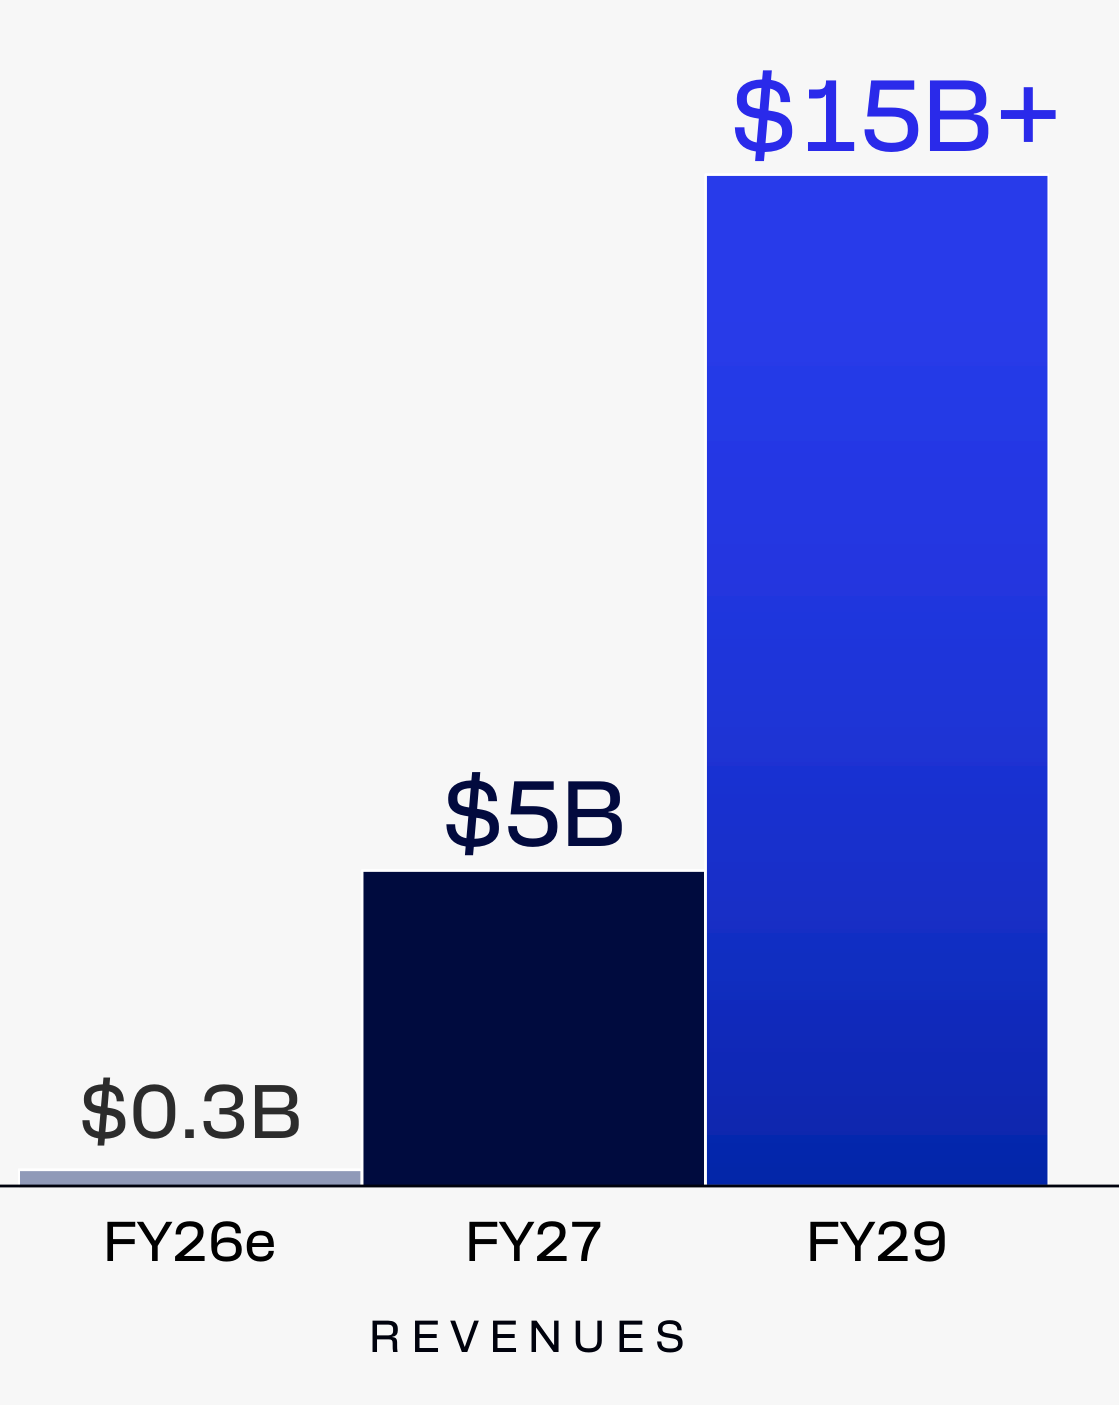
The chart states management's ambition. It does not reconcile those annual milestones to the completed quarter. The Investor Day places the future Data Center framework within QCT; the current quarterly filing includes Data Center among nonreportable segments. Do not silently carry the future classification into today's accounts.
There is stronger counterevidence to a dismissive reading than a target slide alone. On September 8, Qualcomm announced a multigenerational Amazon collaboration covering custom silicon for AI inference and optical connectivity. The announcement names a commercial relationship but supplies no contract value, revenue schedule or margin. It also comes after the June quarter; it cannot explain that quarter's revenue by itself.
A company can build value before a separate reporting line arrives. That is the strongest reason not to confuse limited disclosure with a failed strategy. It still leaves execution and economics to be checked.
What expectations can we actually test?
This is a business comparison, not a valuation model. No dated analyst consensus or current share-price estimate is used, so the article does not claim what Wall Street has already priced in. These are the companies' own stated hurdles:
| Issuer statement | Dated expectation | Boundary to retain |
|---|---|---|
NVIDIA, August 26 | Q3 FY2027 company revenue of $108B, ±2% | Company-wide outlook; assumes no China Data Center compute revenue |
Broadcom, September 2 | Q4 FY2026 AI revenue of $21.7B; company revenue of $34.8B | Company forecasts; quarter ends November 1, 2026, not an announced earnings date |
Qualcomm, July 29 | Non-handset revenue growth of 24% in FY2026 and more than 60% in FY2027 | Includes Data Center but covers a broader business group |
Sources: NVIDIA outlook, Broadcom outlook, Qualcomm outlook. Guidance is neither a completed result nor analyst consensus.
Meeting one of these hurdles would answer an execution question. It would not establish that a stock is cheap. The investor's required next step is to connect business delivery to a separately sourced valuation, rather than treating revenue concentration as expected return.
Where the comparison could mislead
The established businesses have the advantage of observable revenue, but a large starting point does not protect future returns. NVIDIA's broad category can obscure differences among products. Broadcom's combined AI figure can grow while the underlying mix changes. Qualcomm could deliver a meaningful commercial ramp before reporting it in the form this comparison would prefer.
There is a measurement risk too. The fiscal quarters end on different dates, and the categories do not describe identical products. Annualizing the figures would add assumptions without fixing either problem. None of the revenue shares measures customer profitability, cash left after investment or the return an investor should expect.
The next filing should change the question
| Company | Evidence that would change this reading | What remains unresolved |
|---|---|---|
NVIDIA | Revenue delivery accompanied by stronger or weaker margins and cash collection | Product-level economics still need their own evidence |
Broadcom | Q4 delivery and a clearer account of AI product mix and profitability | A combined revenue total alone cannot answer both |
Qualcomm | A separately identified Data Center revenue series, shipment milestones or economics | A customer announcement does not settle the annual target |
Follow-up tests, not predicted outcomes. Review date: September 24, 2026 KST.
The comparison should become less cautious when disclosure improves—not simply when the next headline gets larger. To move from revenue into profit, continue with AMD's Data Center profit test. It asks whether the reported business earns more and converts that growth into cash.
For a different part of the same supply chain, the Micron contract-cycle review separates pricing from shipments. The SK hynix ADR parity investigation asks a separate ownership question: what a U.S.-traded claim represents. Neither should be folded into an AI revenue ranking.
Method and disclosure
Official company materials were reviewed on September 24, 2026 KST. All amounts are USD; B means billion and M means million. Shares use each company's own quarter, with one-decimal rounding. Broadcom's rounded AI input limits precision. Qualcomm's remainder is a group, not an estimate of Data Center sales. No quarters are annualized and no undisclosed product margin is invented.
AI assisted research organization, drafting and graphics. Hynexly is responsible for the analysis. This is general educational information, not personalized investment advice or a stock rating.
Frequently Asked Questions
Yes. Its Q3 FY2026 filing reports an $88M year-on-year increase, primarily from the Alphawave acquisition. That is an increase, not a disclosure of total Data Center revenue.
They describe different businesses within each company. NVIDIA's broad Data Center platform and Broadcom's narrower AI semiconductor category do not form a like-for-like market-share ranking.
No. It is the annual FY2029 Data Center target presented on June 24, 2026. It is not a reported quarter or a forecast newly reaffirmed by this article.
Primary references cited or linked in this analysis. Click through to read each source in full.
- NVIDIA Q2 FY2027 Form 10-Q, Note 13 p. 24
- NVIDIA Q2 FY2027 release, August 26
- Broadcom Q3 FY2026 release, September 2
- Broadcom Q3 FY2026 Form 10-Q
- Qualcomm Q3 FY2026 Form 10-Q, Note 6 and MD&A
- Qualcomm Investor Day strategy, June 24
- Qualcomm Investor Day business update, p. 11
- Qualcomm–Amazon collaboration, September 8
- Qualcomm Q3 FY2026 release, July 29
- presentationgo.com/presentation/two-option-comparison-powerpoint
Choose the next evidence gap to investigate.
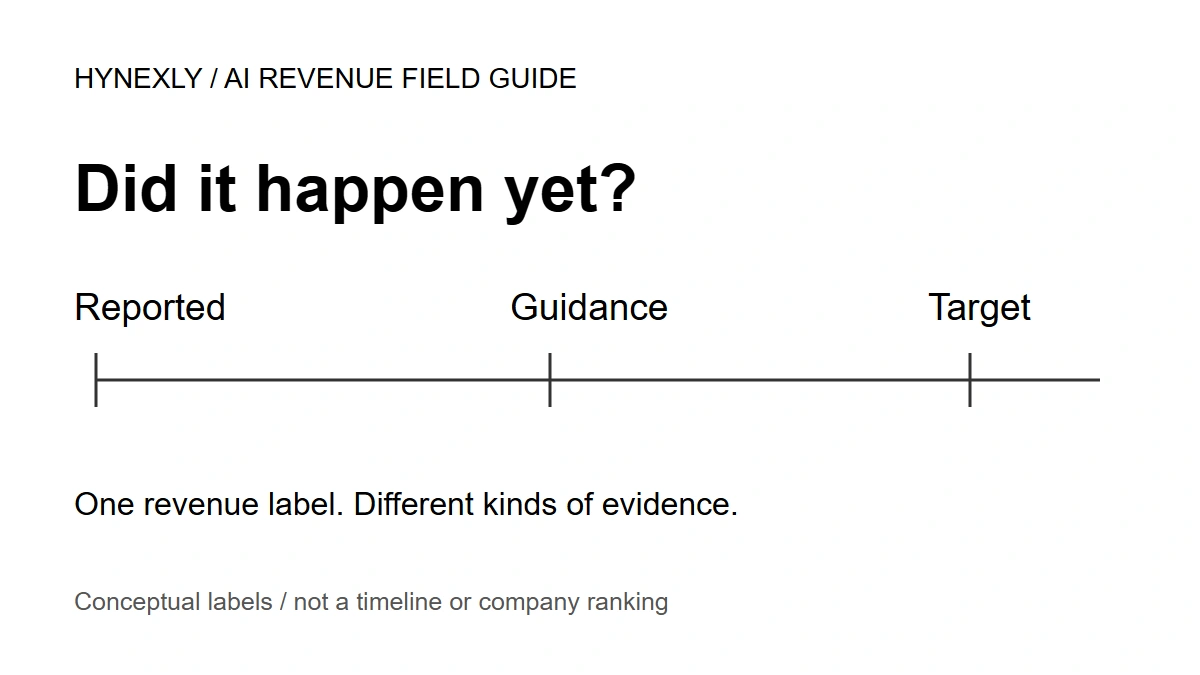
Is That AI Revenue—or a Forecast?
A practical guide to AI revenue claims: test Broadcom's forecast against its result, repair NVIDIA's growth comparison and keep Qualcomm's target in context.
Owner-operated US market research desk
Owner-operated US stock and market coverage built from public filings, SEC EDGAR, official reports, company releases, and market data.
- Source-grounded research with primary filings & official reports
- Bilingual EN / KO editorial workflow
- Manual editorial QA before publish