Is That AI Revenue—or a Forecast?
A practical guide to AI revenue claims: test Broadcom's forecast against its result, repair NVIDIA's growth comparison and keep Qualcomm's target in context.
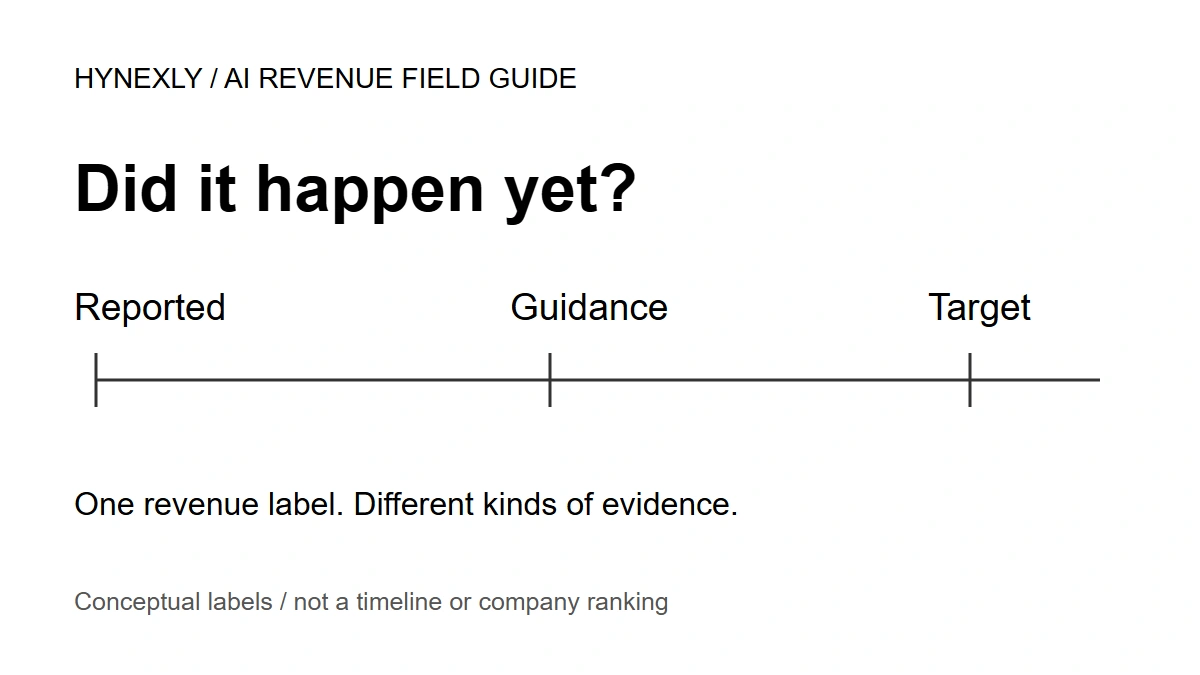
Before you compare two AI revenue numbers, ask whether both describe sales that have happened. A reported quarter, a forecast and a target can look almost identical in a headline. They belong in different notes.
Write down status, period, business scope, source bridge and next check. Those five fields will not tell you which stock to buy. They will tell you whether the comparison you are about to make is defensible.
Start with a note you can check
| Field | What to copy from the source |
|---|---|
Status | Reported result, company forecast or long-term target |
Period | Fiscal quarter or year, including its end date |
Business scope | Products or customers included; what sits outside the figure |
Source bridge | The filing or release, and any reconciliation or classification change |
Next check | The result, definition or missing disclosure that could change your reading |
Hynexly reading worksheet. This is an editorial method, not an official SEC checklist.
The source bridge is simply the route back to the original number. Can you find it in the filing? Does it fit inside a reported segment? If a definition changed, did the company restate the comparison on the new basis?
The SEC's 2020 guidance on management metrics calls for context about definitions, calculations and usefulness, with further explanation when material methods change. That does not create one universal AI revenue category. Nor does putting a metric beside financial statements automatically make it an individually audited line item. The Investor.gov 10-K guide helps locate the business description, risks, management discussion and audited financial statements; NVIDIA's quarterly statements below are marked unaudited.
Now put the worksheet to work. The first exercise is a forecast with a result we can finally check.
Broadcom's old forecast now has an answer
In its June 3 release, Broadcom expected $16.0B of AI semiconductor revenue in Q3 FY2026. Its September 2 release reported $16.7B for that quarter. Both refer to the period ended August 2, 2026.
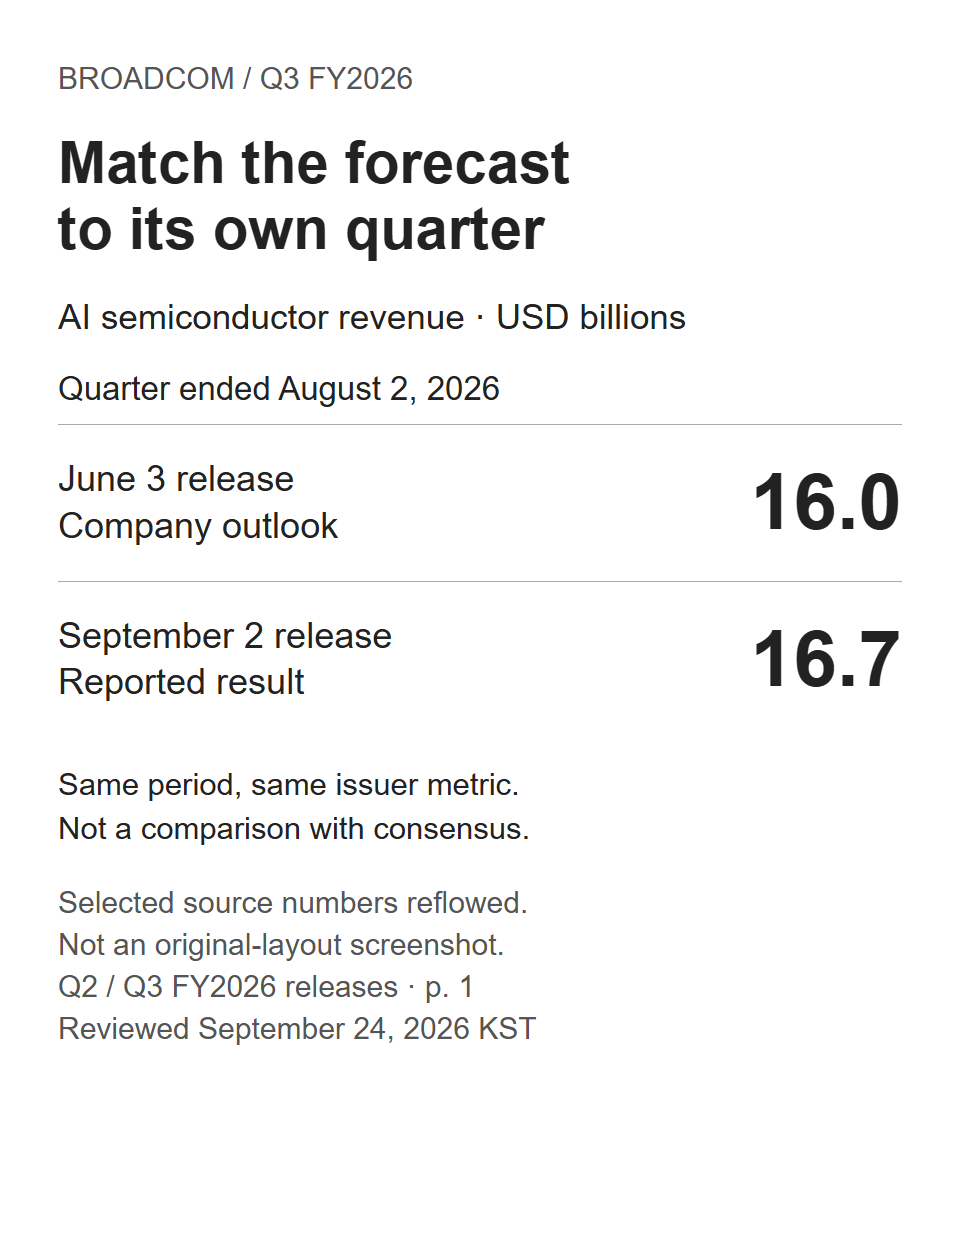
The result was $0.7B above the earlier outlook. Divide that difference by $16.0B and you get about 4.4%. This is a useful test because the company, metric and fiscal period match. The inputs are rounded, so the percentage should not be presented as more precise than that.
It is not quarter-over-quarter growth: the denominator is a forecast for the same quarter, not an earlier quarter's sales. It also says nothing about whether analysts had expected more by the time results arrived. A consensus comparison needs its own dated source.
| Completed note | Broadcom example |
|---|---|
Status | Q3 reported result: $16.7B |
Period | Q3 FY2026, ended August 2, 2026 |
Scope | AI semiconductor revenue; not all Broadcom revenue |
Source bridge | June 3 company outlook of $16.0B → September 2 actual result |
Next check | Q4 result against the September 2 outlook of $21.7B; fiscal period ends November 1, 2026 |
The $21.7B amount remains company guidance. November 1 is the quarter end, not an earnings announcement date.
Keep the favorable result. Broadcom delivered more than it had forecast. Just do not carry the word “reported” over to Q4 because Q3 went well. One forecast outcome does not establish how accurately the company will predict later quarters.
The next exercise is less obvious. Both inputs are reported numbers, but using them together still produces the wrong growth comparison.
A true NVIDIA number can be the wrong denominator
NVIDIA's original Q1 FY2027 filing put Hyperscale revenue at $37,869M. In its Q2 filing, the same Q1 quarter appears at $43,050M. The quarter still ends on April 26, 2026. What changed?
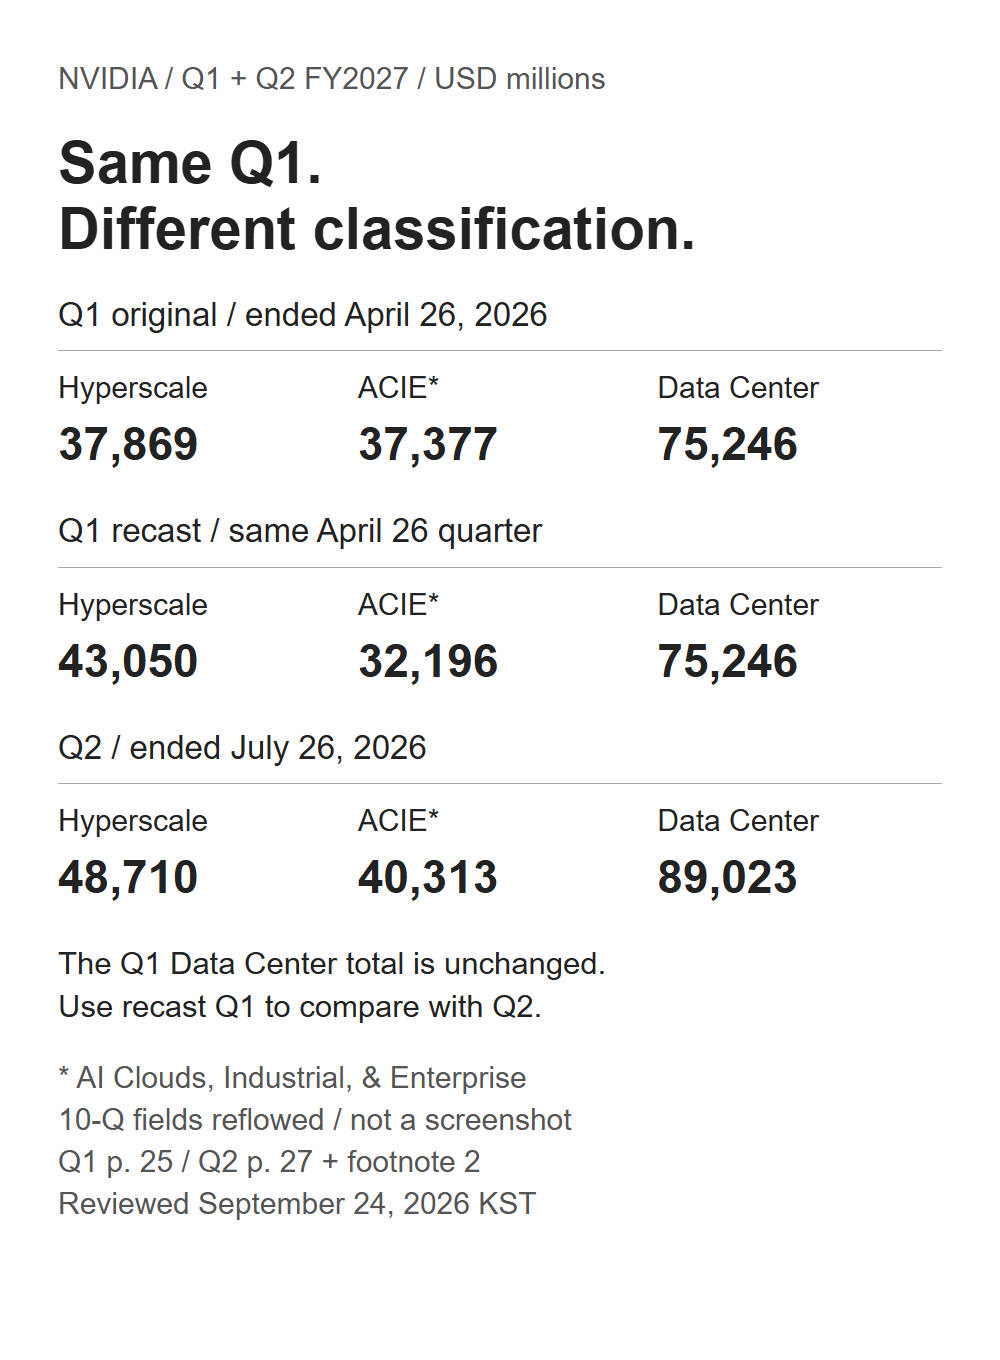
The footnote says NVIDIA moved one company from ACIE into Hyperscale after that company's business model changed, and recast the prior period. It does not name the company. There is no need to guess its identity to repair the comparison.
For the same Q1 period, Hyperscale rises by $5,181M while ACIE falls by $5,181M. Data Center stays at $75,246M. This change in presentation is not another sale added to the quarter.
Q2 Hyperscale revenue is $48,710M. Here is what happens when you divide it by the two versions of Q1:
| Calculation | Result | Reading |
|---|---|---|
(48,710 ÷ 43,050 − 1) × 100 | 13.1% | Matched classification; usable sequential comparison |
(48,710 ÷ 37,869 − 1) × 100 | 28.6% | Mixed classification; not a valid like-for-like growth rate |
Hynexly calculations from the two filings; inputs in USD millions. Use the explicit recast Q1 row rather than reconstructing it from rounded half-year figures.
The choice of baseline changes the result by 15.5 percentage points. The larger percentage is not an alternative estimate of the same growth. It answers a mismatched question.
This is why saving an old number is not enough. Keep the filing date and definition with it, then read the later comparison footnote before calculating. The NVIDIA reporting-change walkthrough goes further into what the new categories reveal and what they leave unresolved.
Keep Qualcomm's target in the notebook
At its June 24, 2026 Investor Day, Qualcomm set a Data Center revenue target of more than $15B by FY2029, within QCT. That is a dated annual target. It should not be placed beside a peer's completed quarterly revenue as though both measure current scale.
| Target note | What belongs there |
|---|---|
Statement | More than $15B of Data Center revenue by FY2029 |
Source and status | June 24, 2026 Investor Day; management target |
Scope | Data Center within QCT; not all Qualcomm revenue |
What to seek next | Dated customer, product and reported-revenue evidence that tests the path |
Source: Qualcomm's June 24 strategy release. This guide is not claiming the target was freshly reaffirmed on its review date.
Discarding it would lose useful information about management's intended business. Treating it as achieved would add evidence that does not exist in that statement. Keep the target and test its path separately. Do not turn “more than” into an exact endpoint or multiply a competitor's latest quarter by 4 to manufacture a comparable annual forecast.
A good note still leaves investment questions open
Company-defined metrics can illuminate a business that broad accounting segments obscure. Forecasts also let readers test management against its own prior statement. Missing a perfect reconciliation limits a comparison; it does not by itself prove fraud or zero underlying sales.
| A complete note can establish | It cannot establish on its own |
|---|---|
What the company reported or forecast | Whether the share price offers a good return |
A matched-period comparison | Customer-level profitability or future demand |
The effect of a disclosed reclassification | Every commercial cause behind the change |
A dated target and its business scope | Whether execution will reach the target |
Method boundary, not a ranking of NVIDIA, Broadcom or Qualcomm.
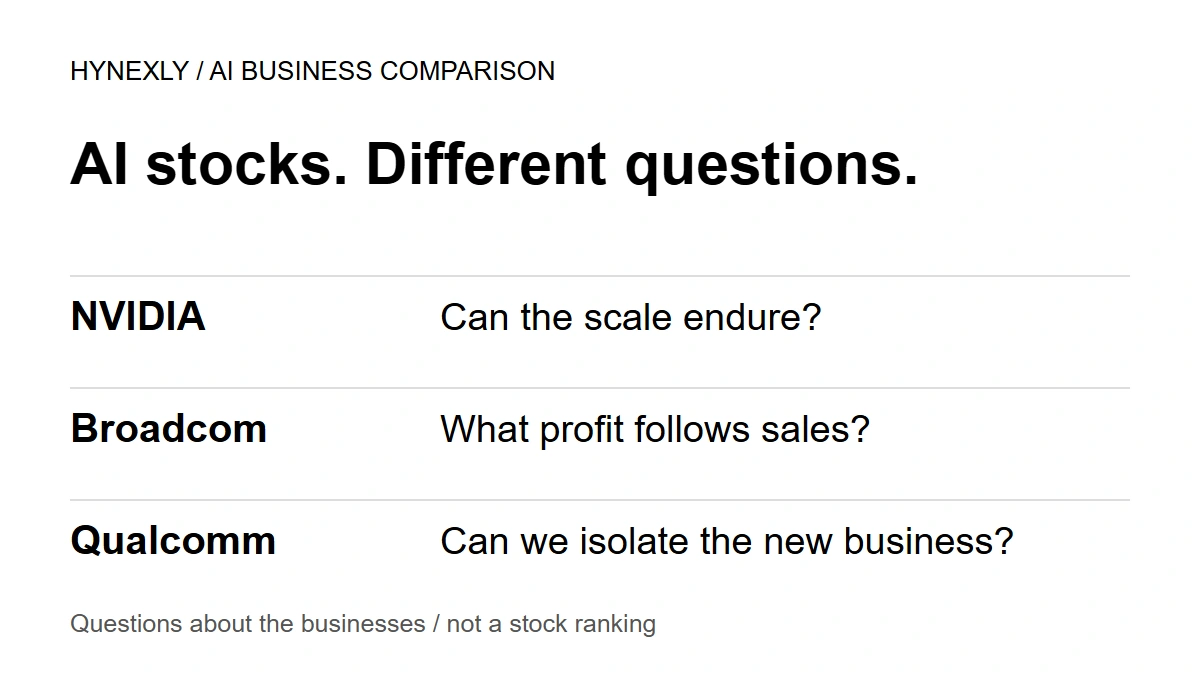
The same restraint applies to the word AI. These examples use different business boundaries: NVIDIA's Data Center platform, Broadcom's AI semiconductor category and Qualcomm's future Data Center business. Better labels make their differences visible. They do not erase them.
Decide what you can compare
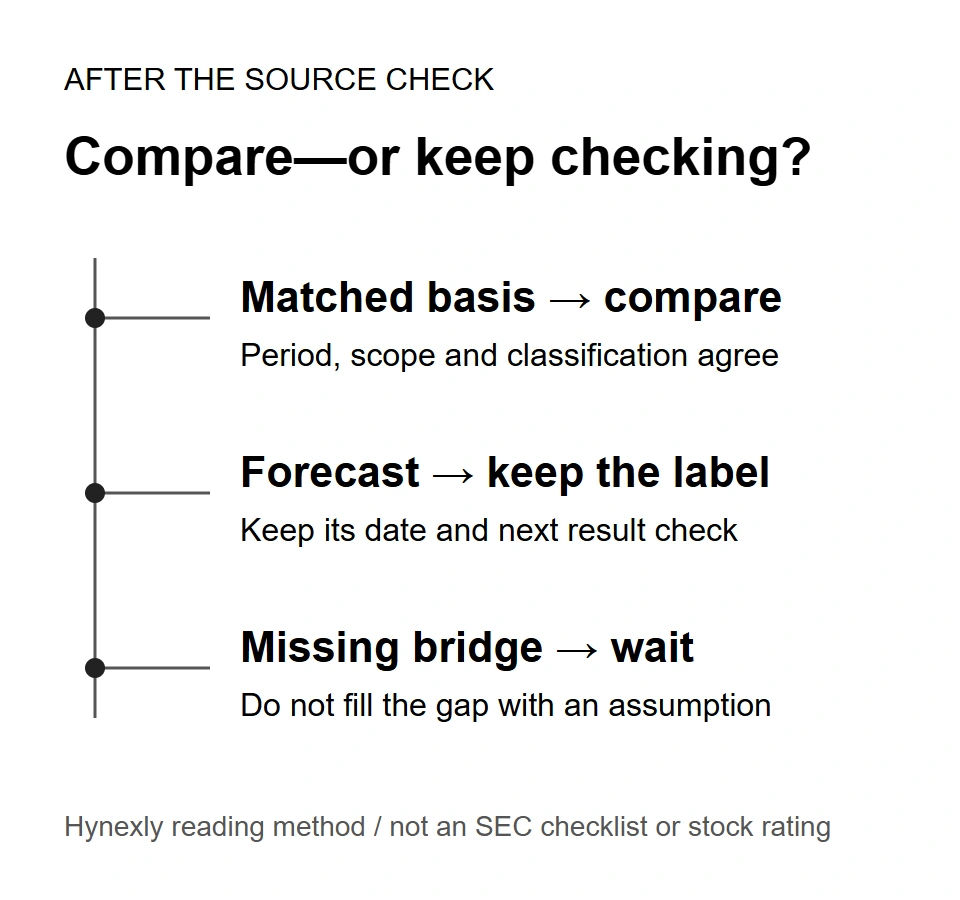
On the next release, fill the five fields before writing the growth sentence. A matched result lets you compare. A forecast can stay in the note with its date and conditions. A missing classification bridge is a reason to withhold the comparison until the source supplies it.
Try the method on the NVIDIA, Broadcom and Qualcomm evidence comparison. Your first task is not to pick the biggest number. It is to decide which question each number can actually answer.
To practise beyond AI, use the scope field to separate Tesla's deliveries from its cash after investment, or Netflix's advertising outlook from its profit evidence. In each case, write down what the headline metric does not measure before using it to answer a different question.
How this guide was checked
This guide uses the linked issuer releases, filings and SEC materials. Calculations use the displayed source values; rounding and mismatched definitions are stated beside the result. AI assisted research organization, drafting and graphics. Hynexly is responsible for the analysis. No current share price or analyst consensus is used.
This article is educational analysis, not personalized investment advice.
Frequently Asked Questions
No. Check the company's product or customer scope and how it relates to reported segments before comparing it with a peer.
No. The first comparison uses management's dated forecast. A consensus beat needs a separately sourced and dated analyst estimate.
Use the prior period presented on the same basis as the current result, and read the explanation for the change. Keep the original number for the historical record.
Primary references cited or linked in this analysis. Click through to read each source in full.
- SEC 2020 guidance on MD&A metrics, pp. 4–5
- Investor.gov guide to reading a 10-K
- Broadcom Q2 FY2026 release, June 3
- Broadcom Q3 FY2026 release, September 2
- NVIDIA Q1 FY2027 Form 10-Q, MD&A p. 25
- NVIDIA Q2 FY2027 Form 10-Q, MD&A p. 27
- Qualcomm Investor Day strategy, June 24, 2026
- presentationgo.com/presentation/five-phase-roadmap-timeline-powerpoint
Choose the next evidence gap to investigate.
NVIDIA, Broadcom, Qualcomm: What Each AI Business Still Has to Prove
NVIDIA and Broadcom already depend heavily on different AI-related businesses. Qualcomm has real revenue and an Amazon collaboration—but a separate financial ramp to prove.
Owner-operated US market research desk
Owner-operated US stock and market coverage built from public filings, SEC EDGAR, official reports, company releases, and market data.
- Source-grounded research with primary filings & official reports
- Bilingual EN / KO editorial workflow
- Manual editorial QA before publish