Market & Macro
AI Stocks Still Show Real Revenue, but the CapEx Bar Has Risen
NVIDIA, Microsoft, and Alphabet disclosures, read side by side: which 2026 AI revenue is verified, and what the rising infrastructure bill actually costs.
(Sources: NVIDIA Q4/FY2026 earnings release, Microsoft FY26 Q2 investor metrics, Microsoft FY26 Q2 cash flows, Alphabet Q4 2025 earnings release PDF)
Before any bubble verdict is fair, the word itself needs pinning down: a bubble that is "bursting" should show demand actually collapsing in the disclosures. Held to that definition, the loud "AI bubble is bursting" framing fails on contact — NVIDIA's $215.9 billion full-year revenue and Alphabet's 48% Google Cloud growth are nothing like a demand collapse. So the question had to flip. The capex lines became the real test, and working through Microsoft's cash-flow statement and Alphabet's 2026 guidance ahead of the headlines, we landed on the line that reframed the whole post: Microsoft PPE additions climbing from $30.7 billion to $49.3 billion, cited in full below.
Related reading: What the 2026 FOMC Calendar Says About When Fed Cuts Can Come | The KRBN Wrapper Is the First Check Before Carbon Credit Exposure | Verify Your Broker Before You Pick a Single U.S. Stock
Thesis
Most of the AI stock discussion is still framed too loosely. People ask whether the theme is a bubble or whether it is still early. The filings suggest a more useful framing: the revenue is real, but the capex bar is now much higher than it was when the theme first broke out.
That distinction matters because both sides of the argument have evidence now. Revenue growth, backlog, and operating profit are still strong at the platform layer. But infrastructure spending is also rising fast enough that the market no longer has much patience for weak monetization.
Source Evidence Snapshot
The evidence is split into two roles: the hero chart shows the demand side, while the body chart below shows why capex discipline is now the harder evidence test.
-
NVIDIA demand and cash generation: NVIDIA's FY2026 materials provide the revenue and cash-generation anchor for the AI infrastructure layer. Sources: NVIDIA Q4/FY2026 earnings release and NVIDIA FY2026 Form 10-K.
-
Microsoft cloud demand versus capex: Microsoft's FY26 Q2 metrics and cash-flow pages provide the Azure, commercial RPO, cloud gross margin, and property-and-equipment spending evidence. Sources: Microsoft FY26 Q2 investor metrics and Microsoft FY26 Q2 cash flows.
-
Alphabet cloud profit and spending plan: Alphabet's Q4 2025 release provides the Google Cloud growth, operating income, operating cash flow, and 2026 capex guidance evidence. Source: Alphabet Q4 2025 earnings release PDF.
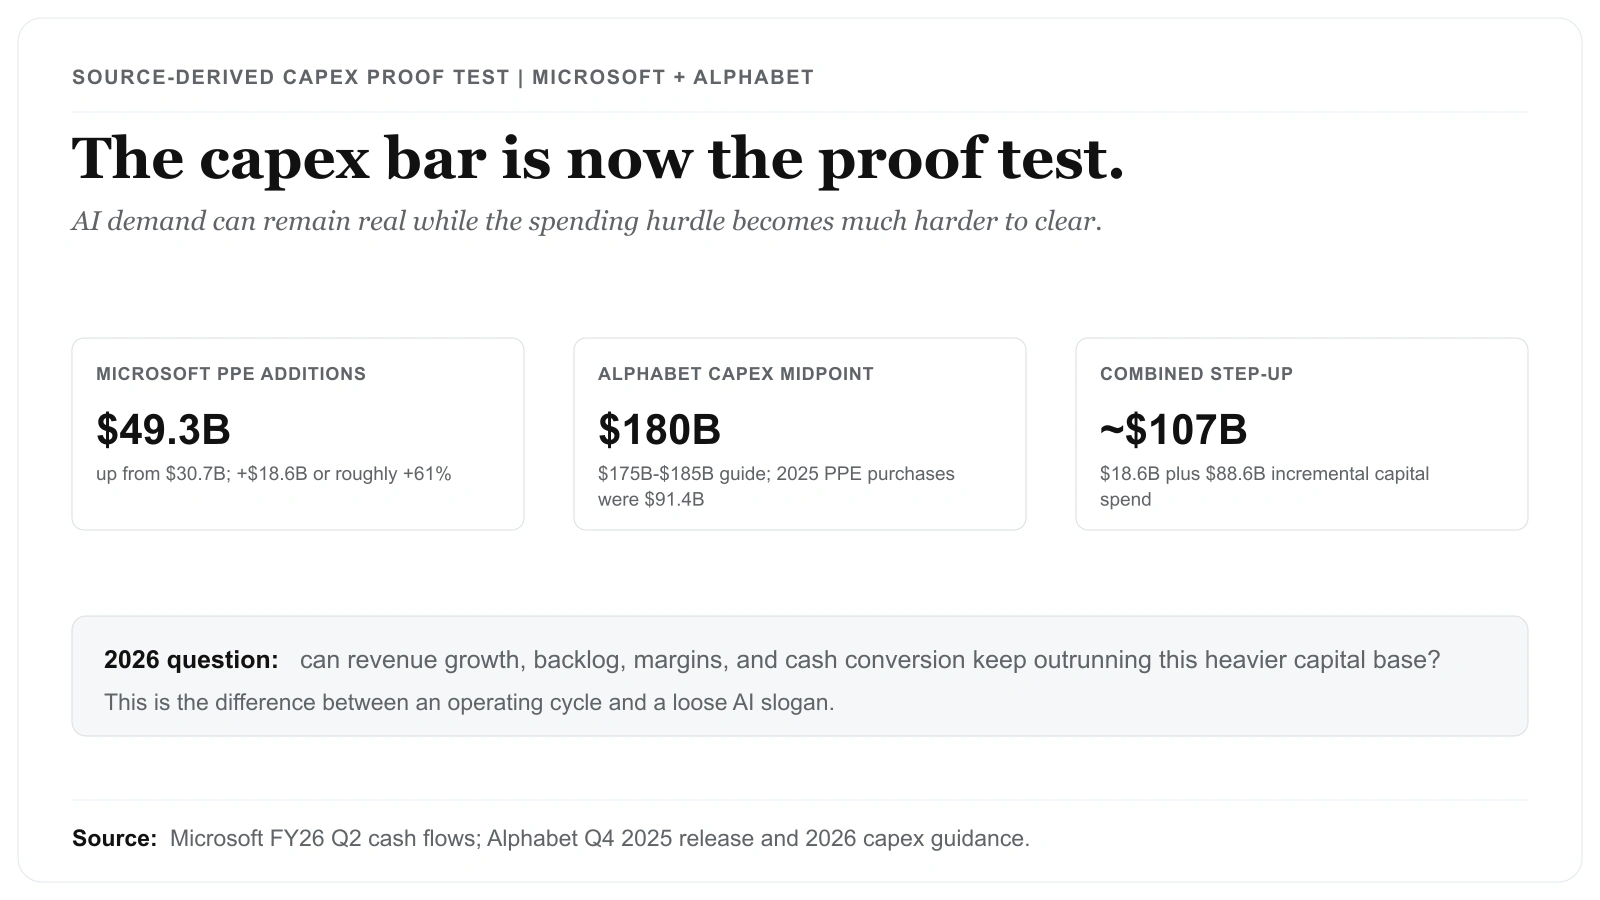
Source-derived capex proof-test map based on Microsoft FY26 Q2 cash flows and Alphabet Q4 2025 earnings release PDF. The pressure is not a vague narrative: Microsoft's PPE additions rose from $30.7 billion to $49.3 billion, while Alphabet's 2026 capex midpoint of $180 billion is almost double 2025 PPE purchases of $91.4 billion.
This hub deliberately uses aggregate source-derived renders rather than reusing company-specific screenshots. The company captures stay in the NVIDIA, Microsoft, and Alphabet single-stock articles where they carry a more precise role.
What the Street is Pricing
The market is pricing AI as a real operating cycle, not only as a product announcement cycle. That is why strong revenue and backlog numbers still matter. But it is also pricing the theme as a capital-intensive buildout across chips, cloud, data centers, and power. The valuation question is therefore whether each new dollar of infrastructure spend continues to show up in revenue growth, operating profit, and cash conversion.
The demand side is still strong enough to matter
The strongest argument against a simple bubble call is that the biggest AI-linked companies are still reporting very large, verifiable operating numbers.
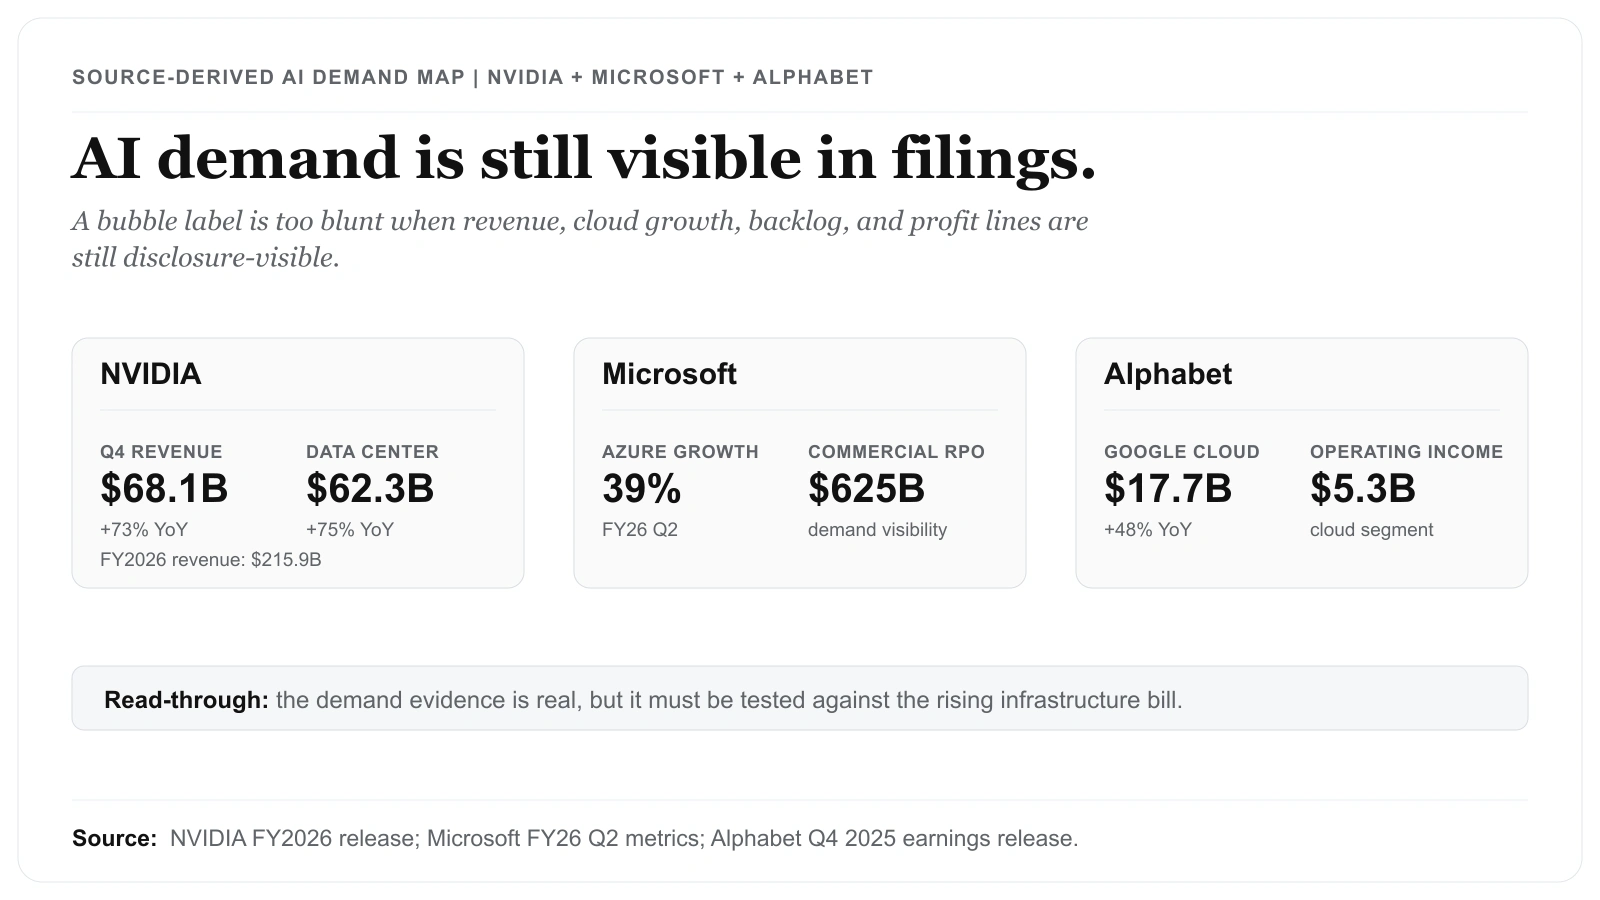
NVIDIA said fourth-quarter revenue reached $68.1 billion, up 73% year over year, while Data Center revenue reached $62.3 billion, up 75%. For the full fiscal year, NVIDIA reported revenue of $215.9 billion.
Microsoft said Azure and other cloud services revenue grew 39% in FY26 Q2, while commercial remaining performance obligation rose to $625 billion.
Alphabet said Google Cloud revenue rose 48% to $17.7 billion in Q4 2025, with Google Cloud operating income reaching $5.3 billion.
Those are not narrative-only numbers. They are large, disclosed operating results from the companies carrying the AI infrastructure buildout.
Risks to the Thesis
The stronger the theme gets, the more important the cost of carrying it becomes.
Microsoft's first-half FY26 cash-flow statement shows additions to property and equipment of $49.3 billion, up from $30.7 billion a year earlier. Alphabet's 2025 cash-flow statement shows purchases of property and equipment of $91.4 billion, and the company said it expects 2026 capital expenditures between $175 billion and $185 billion.
Quantify how steep that step-up is. Microsoft's PPE additions rose by $18.6 billion ($49.3B minus $30.7B), a roughly 61% jump in a single year. Alphabet's 2026 capex midpoint of $180 billion (the center of the $175B–$185B range) sits about $88.6 billion above its 2025 PPE purchases of $91.4 billion — close to a doubling. Add those two increments and these two firms alone are committing on the order of $107 billion in incremental annual capital spend ($18.6B plus $88.6B) versus the prior comparable period. That is the size of the bar each new dollar of demand now has to clear.
NVIDIA's annual report shows the cash engine is still extraordinary. But even there, the stock is now priced for continued leadership, continued hyperscaler demand, and continued product execution. The business risk is not whether AI demand exists; the disclosures settle that. The stock risk is whether that demand keeps scaling fast enough to justify both the current expectations and the heavier infrastructure bill underneath them.
Why the theme still has evidence, but with less room for error
The bullish case remains straightforward. The cloud platforms are still booking strong growth. The backlog lines remain large. NVIDIA, Microsoft, and Alphabet are all still producing significant cash or profit pools that can support continued investment.
What has changed is the margin of safety. The market no longer treats AI as a speculative side bet. It treats AI infrastructure as a core spending program across the largest platforms. That means valuation compression can happen even when the businesses remain strong, simply because the market expected stronger returns on a much larger capital base.
That is the core 2026 setup:
- demand is real,
- backlog is real,
- profits are real,
- but the spending bar is now high enough that "good quarter" is no longer enough.
A better way to think about AI exposure in 2026
The practical approach is neither blind bullishness nor blanket skepticism. It is evidence-first monitoring with explicit revalidation.
Each quarter, the theme should be checked against the same three relationships:
- Revenue growth versus infrastructure spending.
- Backlog or demand visibility versus margin pressure.
- Cash generation versus capital-allocation strain.
If those three keep moving together, the AI theme can remain evidence-supported. If they decouple, the downside can open faster than the headline excitement suggests.
Quarterly evidence checks for 2026
Keep this theme on a fixed revalidation loop. First, refresh platform demand and margin disclosures from earnings materials. Second, refresh capex and property-and-equipment spending lines from cash-flow statements. Third, compare those updates with valuation resets after each print. If demand and cash conversion hold while capital intensity stabilizes, the thesis remains intact. If capex expands faster than monetization for multiple quarters, risk rises even with positive headlines.
An important implementation detail is to keep company-level checklists separate. NVIDIA needs throughput, backlog, and supply execution checks. Microsoft and Alphabet need cloud monetization checks plus capex-efficiency checks. Treating them as one blended "AI basket" can hide where operating momentum is improving versus where capital intensity is becoming harder to defend.
What Flips the Call
The current filings do not support a simplistic "AI is over" call. The revenue and cloud-demand evidence are still too strong for that.
They also do not support a loose "own anything AI" stance. Infrastructure spending is now too large, expectations are too high, and the market is too crowded for that.
The framework turns more cautious if capex keeps rising faster than monetization for several quarters, or if backlog growth stops translating into margin and cash-flow evidence. It turns more constructive if the next prints show demand holding while infrastructure intensity stabilizes. Until then, AI remains one of the strongest operating themes in public markets, but it now demands tighter valuation and execution discipline than it did in the early phase of the run.