Energy & Commodities
First Solar Backlog 2026: What 47.9 GW Really Proves
First Solar's 47.9 GW backlog covers about 2.7 years of its 2026 volume midpoint, but Q1 net bookings replaced only 42% of shipments and cash conversion remains the harder test.
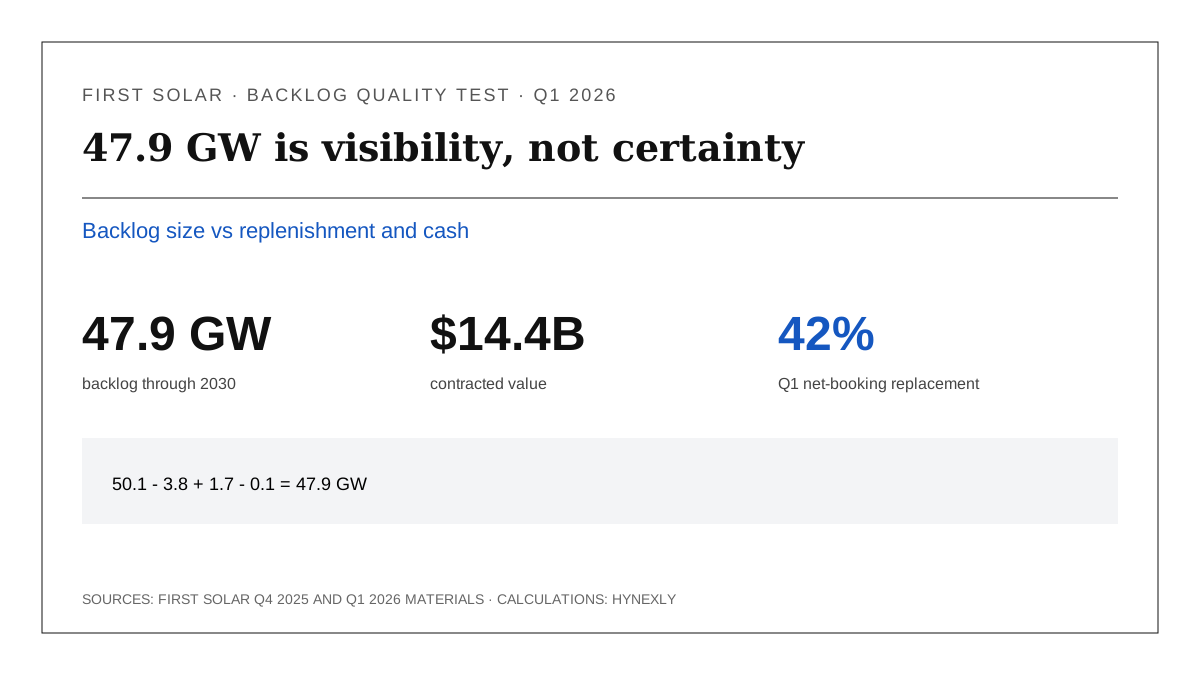
First Solar's 47.9 GW backlog is strong evidence of delivery visibility, not proof of automatic value creation. At the midpoint, it equals about 2.72 years of 2026 volume guidance and a 2.85x annual-revenue multiple. Yet Q1 net bookings replaced only 42.1% of shipments, while operating cash flow remained negative.
The useful question is therefore not whether the backlog is large. It is whether First Solar can replenish deliveries, preserve contract economics, execute its manufacturing plan and turn reported profit into cash without relying on every current policy assumption.
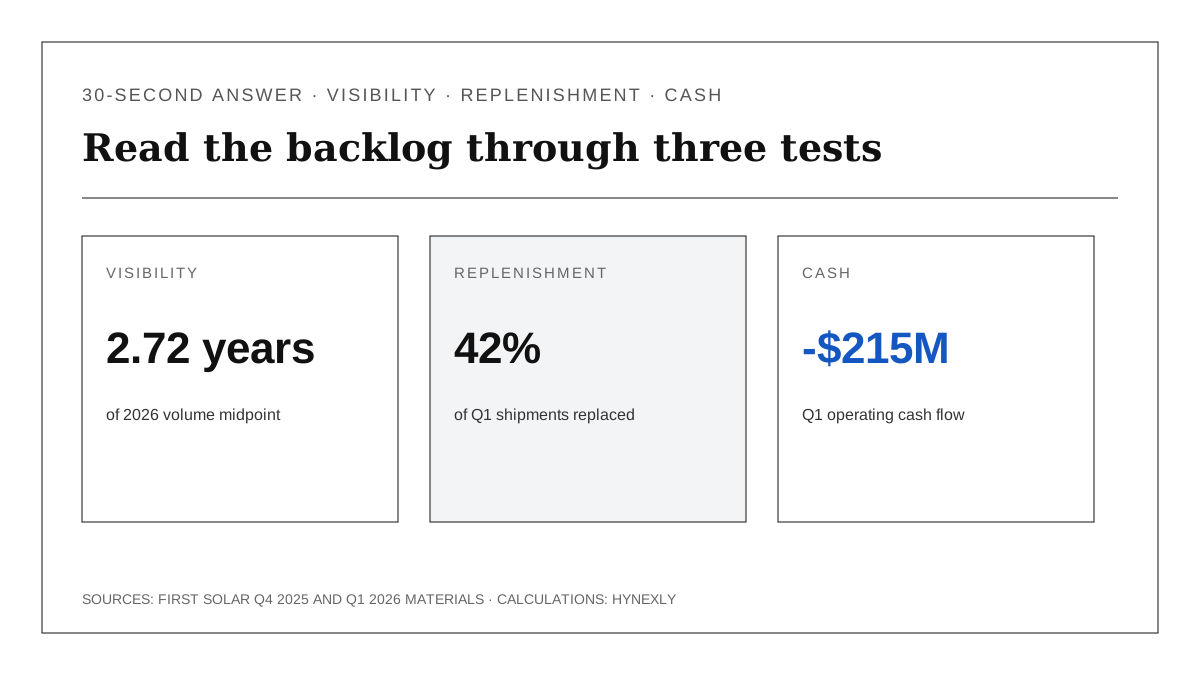
| The 30-second answer | Verified input | Boundary |
|---|---|---|
| Backlog provides substantial volume visibility | 47.9 GW through 2030 | Delivery timing is uneven |
| Q1 order replacement was weak | 1.6 GW net bookings / 3.8 GW sold | One quarter is not a full cycle |
| Accounting profit did not convert to cash | -$214.9M operating cash flow | Management cites working-capital seasonality |
| The next test is multi-variable | orders, guide, policy and cash | No single metric proves the thesis |
Thesis
First Solar's backlog supports the 2026 delivery plan, but its quality must be judged through four separate links: shipment coverage, booking replacement, price and policy economics, and cash conversion. The first link is strong. The other three still need quarterly proof.
The strongest favorable fact is scale. A 47.9 GW contracted position extends through 2030; US manufacturing was 96% utilized in Q1, net sales rose 24% year over year to $1.044B, and management reaffirmed 17.0-18.2 GW of 2026 volume and $4.9B-$5.2B of net sales.
The uncomfortable fact is flow. Backlog fell from 50.1 GW at year-end because 1.6 GW of net bookings did not replace 3.8 GW sold. That is healthy execution against old contracts, but it also means the future order book shrank by 2.2 GW in one quarter. The thesis weakens if that replenishment gap persists.
This question belongs in the same power-infrastructure path as GE Vernova's backlog-to-cash test. It also complements Constellation's contract-inventory analysis: one company must manufacture and deliver equipment, while the other must convert available generation into durable contracts.
Source Evidence Snapshot
The official Q1 slide reconciles the backlog in one frame. First Solar began with 50.1 GW, sold 3.8 GW, booked 1.7 GW and de-booked 0.1 GW, ending at 47.9 GW. The company reports about $14.4B of contracted value and an average backlog price of 30.1 cents per watt.
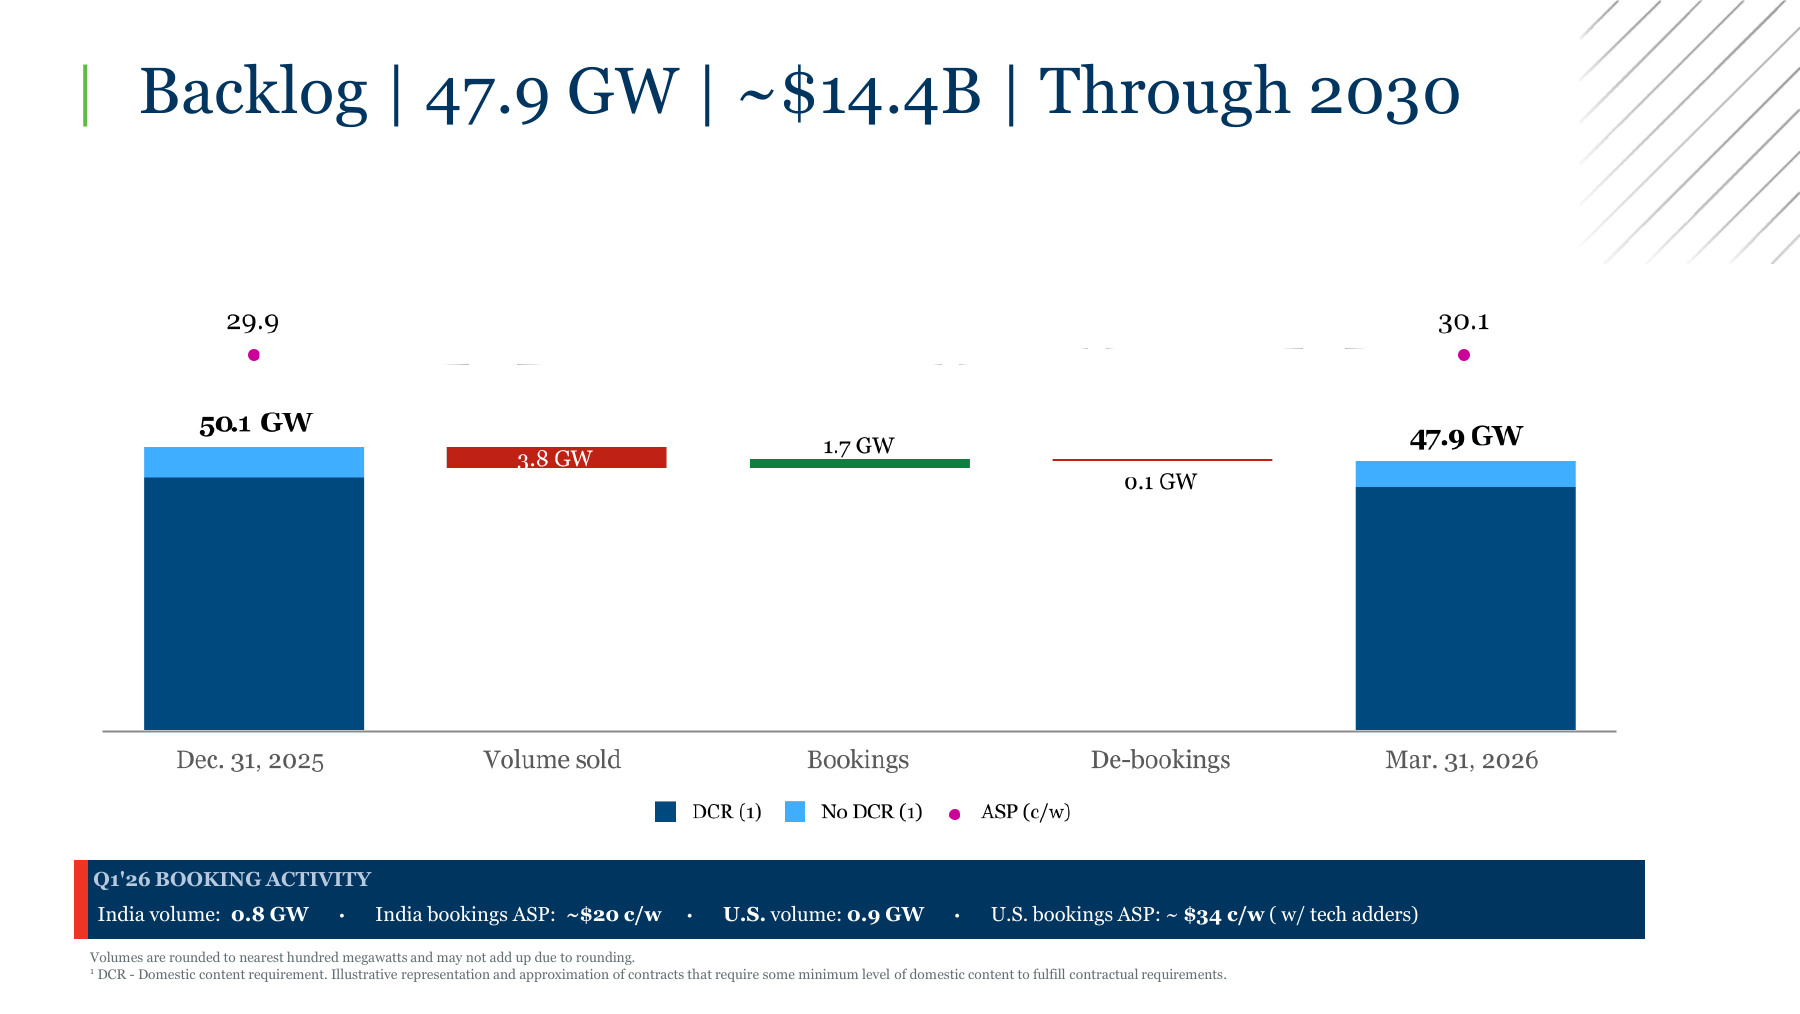
2026-04-30, rendered from the original PDF on 2026-07-15. Values are rounded to the nearest 0.1 GW; DCR means domestic-content requirement.The flow calculation matters more than the ending bar. Net bookings were 1.7 - 0.1 = 1.6 GW. Dividing by 3.8 GW sold gives a 42.1% net-booking replacement rate; gross bookings alone replaced 44.7%. This is not a demand forecast. It is a transparent measure of how quickly the company refilled what it shipped in Q1.
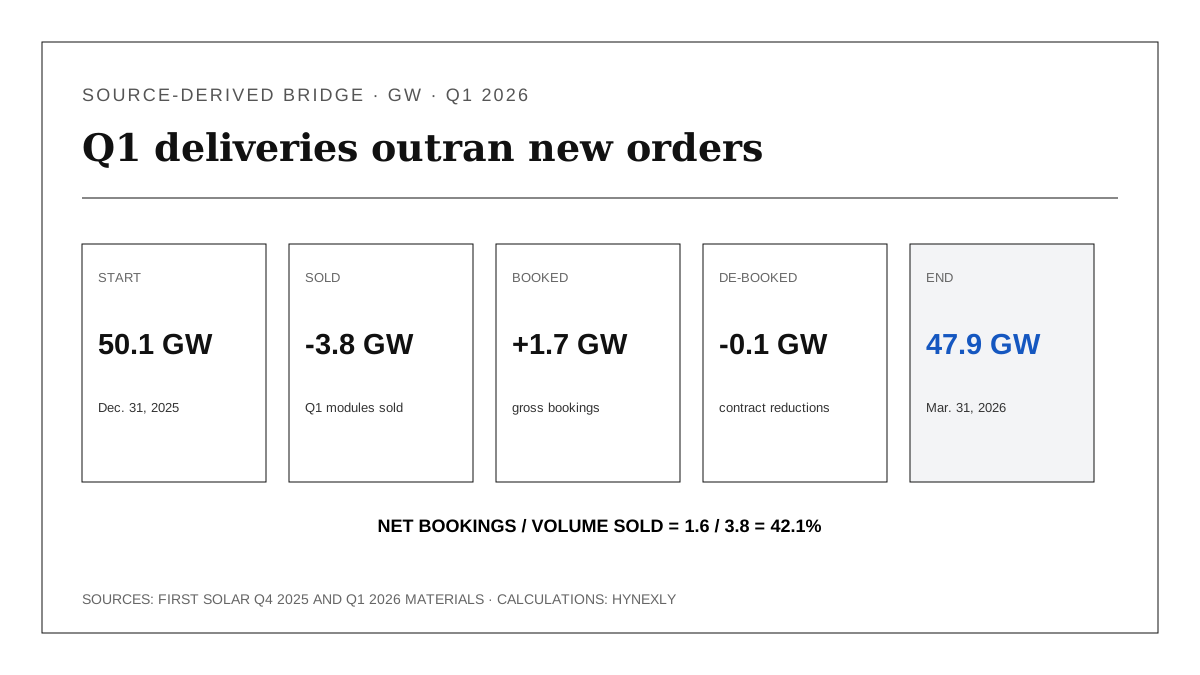
(1.7 GW - 0.1 GW) / 3.8 GW = 42.1%; rounded source values can create small bridge differences.The longer history prevents a one-quarter overreaction. In calendar 2025 First Solar sold 17.5 GW and recorded 0.9 GW of net de-bookings, taking backlog from 68.5 GW to 50.1 GW. It then added 0.5 GW of net bookings through late February of 2026; Q1 sales were not yet deducted. Backlog depletion has therefore accompanied record deliveries, but replenishment was not keeping pace before Q1 either.
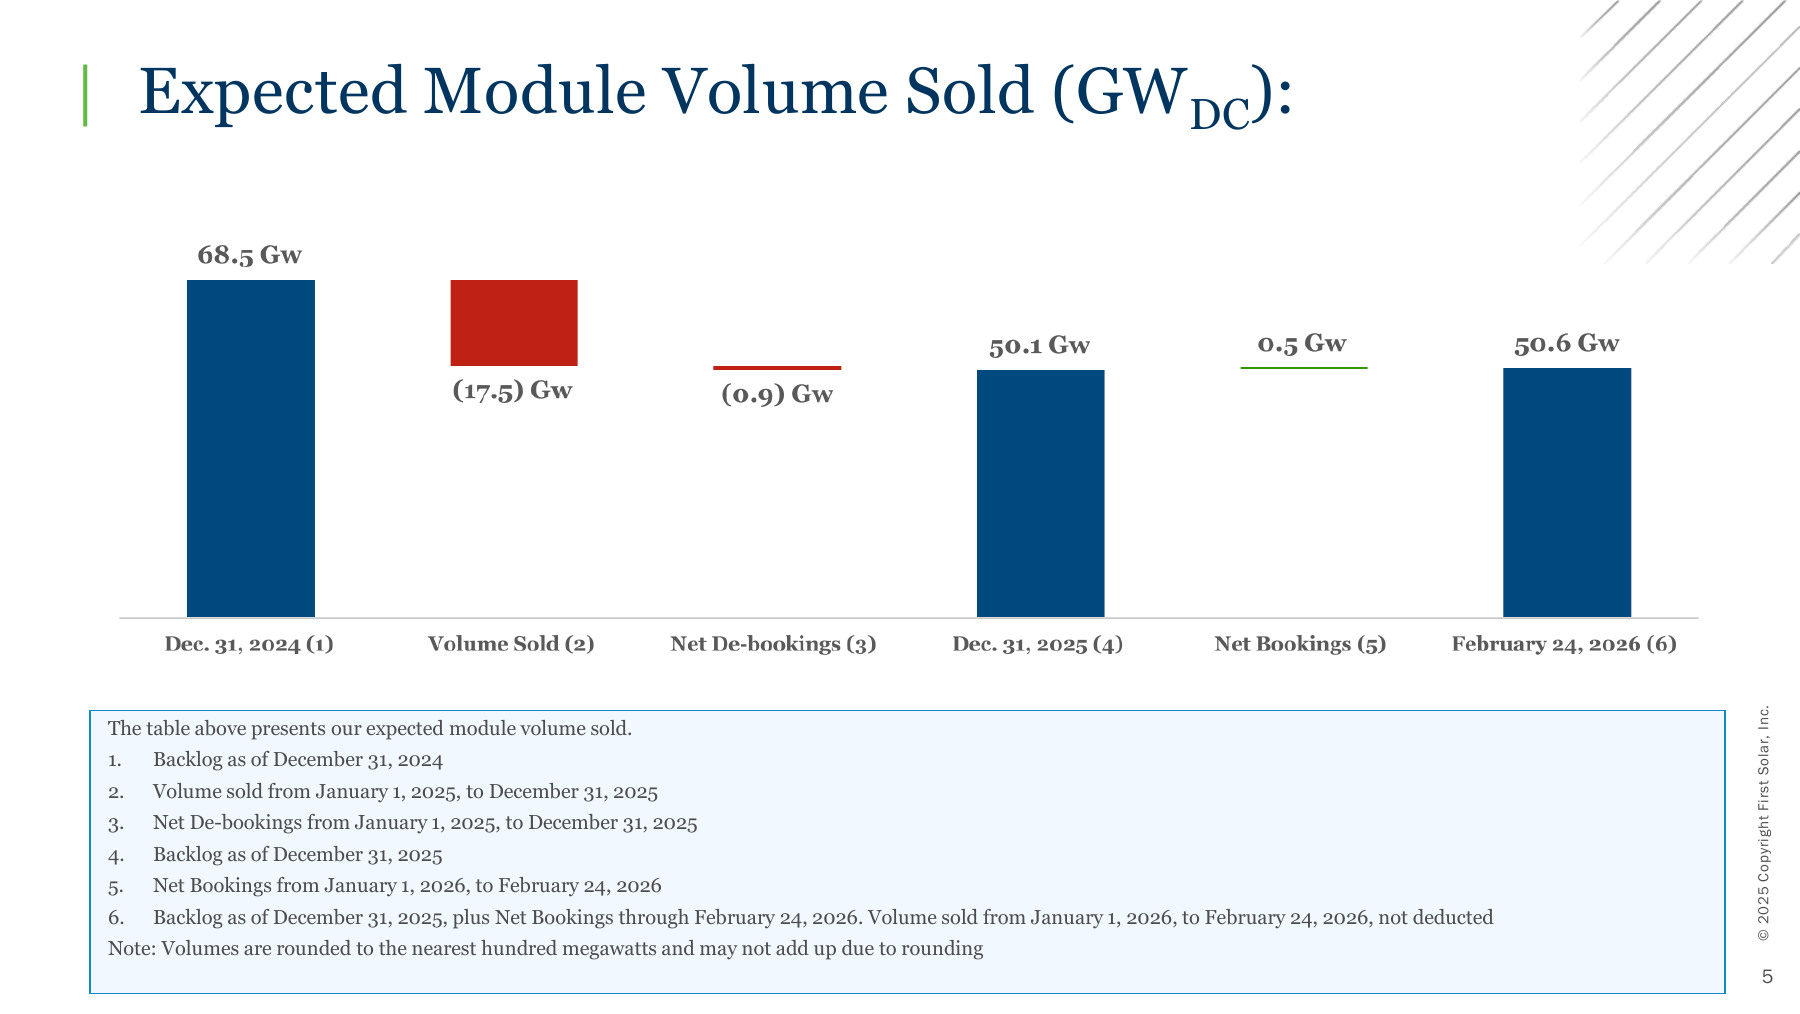
2026-02-24, rendered from the original PDF on 2026-07-15. The final 50.6 GW includes net bookings through that date without deducting 2026 sales.How Much Runway Does 47.9 GW Represent?
At the midpoint of the 17.0-18.2 GW 2026 volume guide, backlog equals 2.72 years of annual shipments. At the midpoint of the $4.9B-$5.2B net-sales guide, $14.4B of contracted value is a 2.85x annual-revenue multiple. These are useful scale ratios, not schedules.
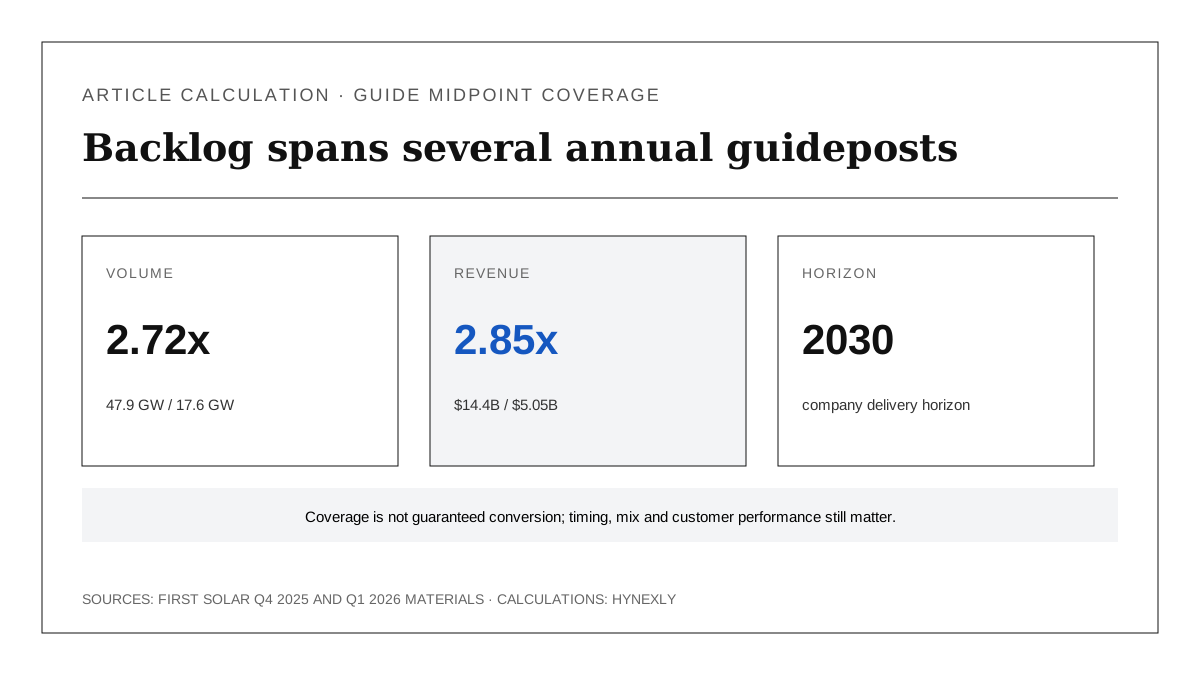
47.9 / 17.6 = 2.72; $14.4B / $5.05B = 2.85. Deliveries extend through 2030 and are not evenly distributed.Backlog value per watt adds a second lens. Dividing $14.4B by 47.9B watts gives about 30.1 cents per watt, matching the official slide. First Solar's 2026 global ASP assumption was about 28.7 cents per watt, so the backlog average is 1.4 cents, or 4.9%, higher.
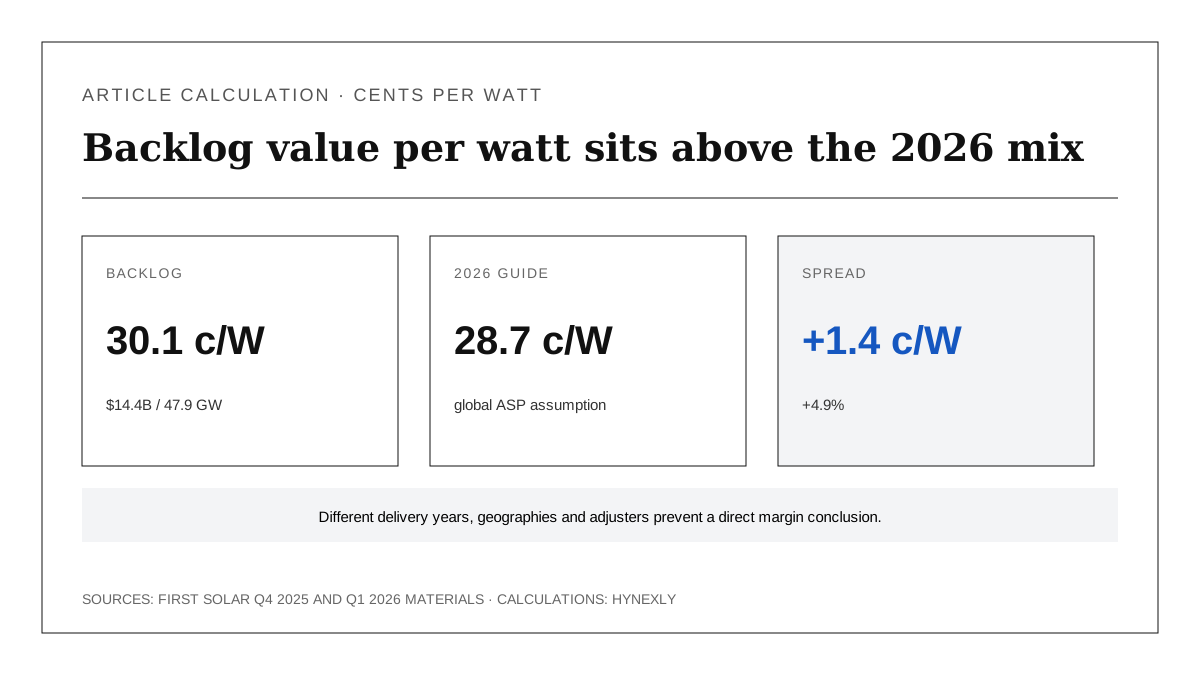
The spread is directionally favorable, but it is not an earnings model. Q1 bookings themselves ranged from about 20 cents per watt in India to about 34 cents in the US with technology adders. Geographic mix, freight, tariffs, domestic-content requirements and technology milestones all change the economics behind a headline ASP.
What the Street Is Pricing
At the 2026-07-15 00:15 UTC market snapshot, FSLR traded at $220.58 per share. Using 107.453M shares outstanding from the Q1 filing gives a simple equity-value approximation of $23.7B. The $14.4B backlog value is about 60.8% of that figure, but this is not enterprise value and backlog revenue is not profit.
The market therefore cannot be pricing backlog dollars one for one. It must be pricing the margin, policy support, capital intensity and cash timing attached to those dollars. Q1 illustrates why: net sales were $1.044B, gross margin was 47%, net income was $347M and adjusted EBITDA was $520M.
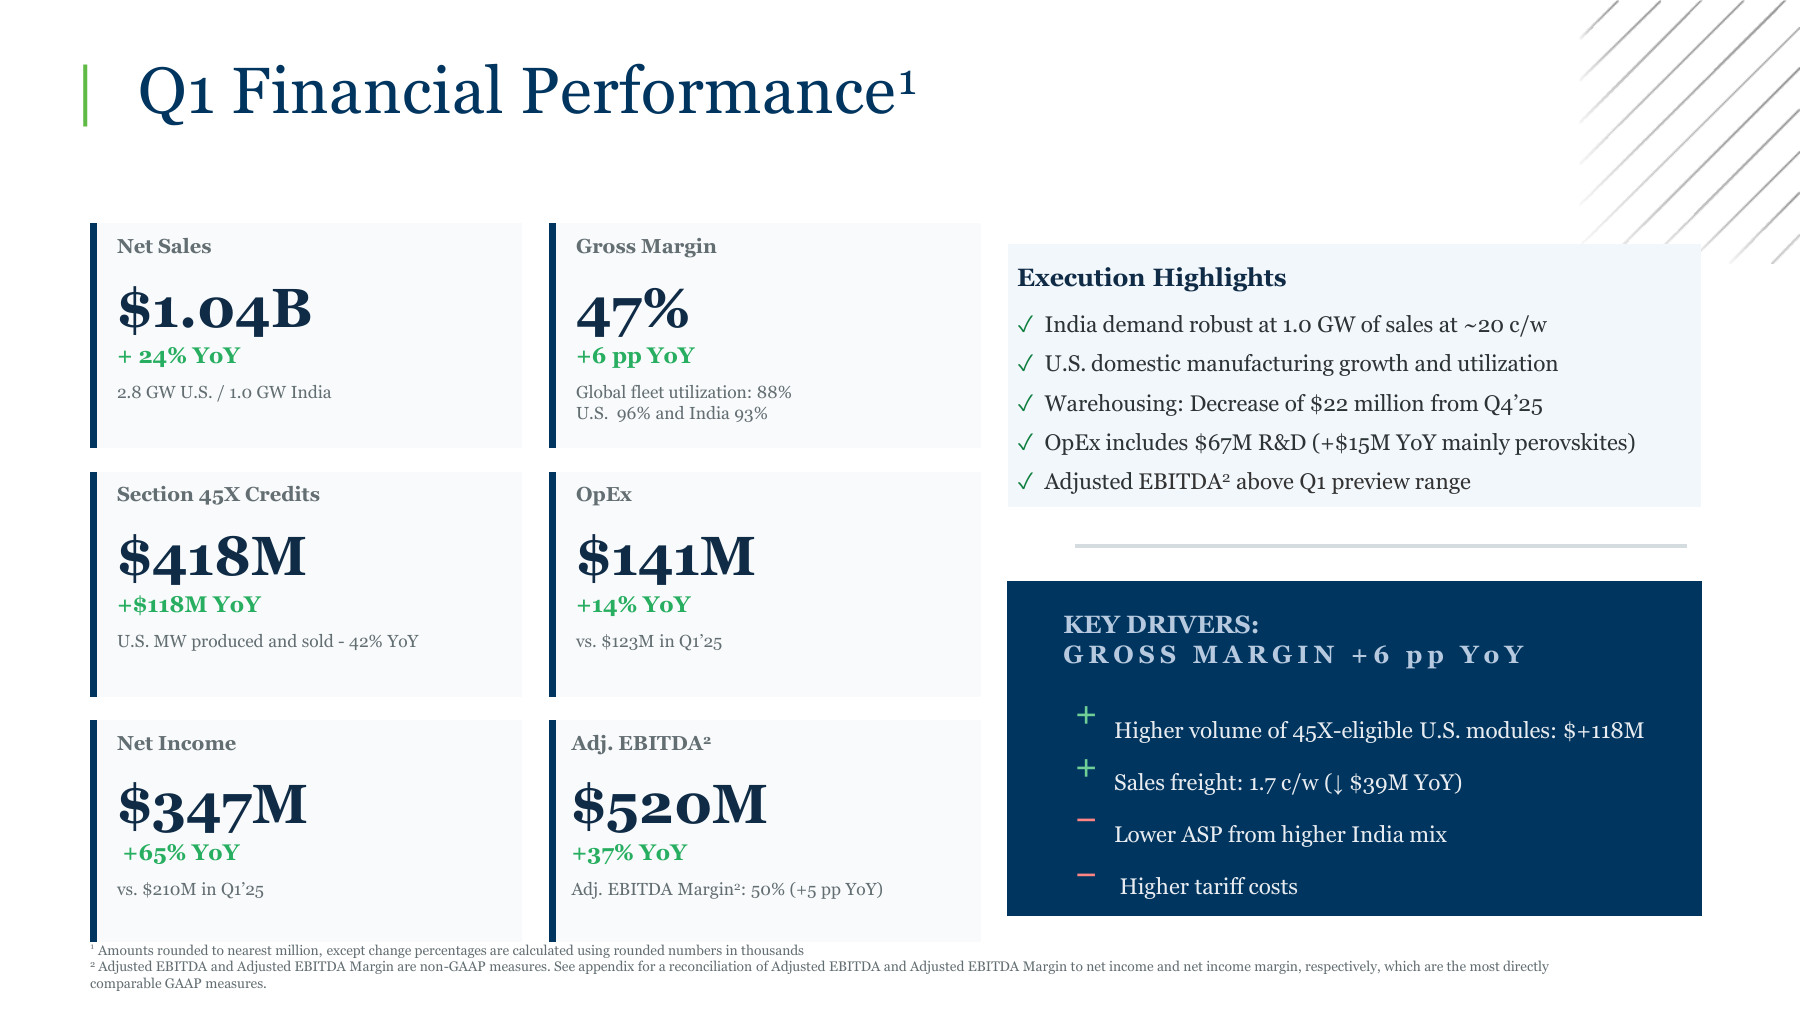
2026-04-30, rendered from the original PDF on 2026-07-15. Adjusted EBITDA is a company non-GAAP measure; the source slide preserves its reconciliation reference.The policy bridge is large. First Solar reported $418M of Section 45X credits in Q1 against $486.1M of GAAP gross profit. The credits equal 86.0% of gross profit. Mechanically subtracting them leaves $68.1M, or 6.5% of sales.
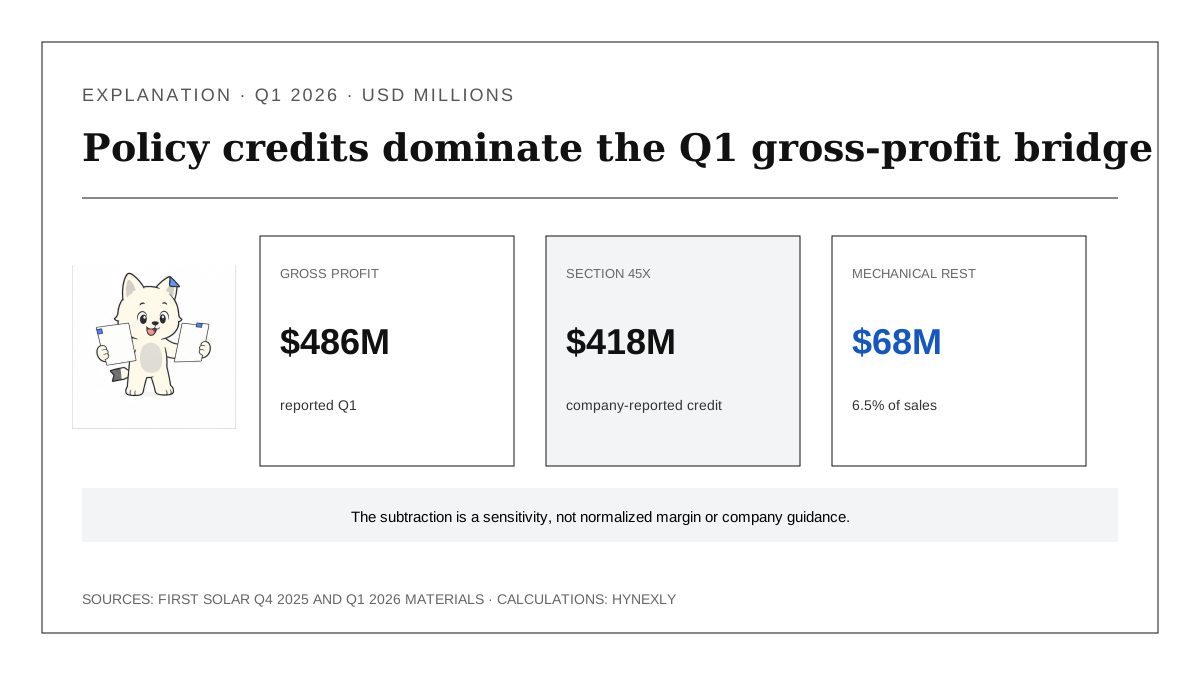
$418M / $486.131M = 86.0%; $486.131M - $418M = $68.131M. This is a mechanical sensitivity, not normalized margin, guidance or a claim that the business would otherwise be unchanged.This does not make the credits artificial. Section 45X is part of the current statutory economics of eligible US manufacturing, and management's 2026 guide assumes $2.10B-$2.19B of credits. It does mean investors must track policy duration and credit realization alongside module technology and factory execution.
Backlog Still Has to Become Cash
Q1 accounting profit did not convert into operating cash. First Solar reported $346.6M of net income but used $214.9M of operating cash, primarily as receivables, inventory and government-grant receivables absorbed funds. Capital expenditures were another $118.5M.
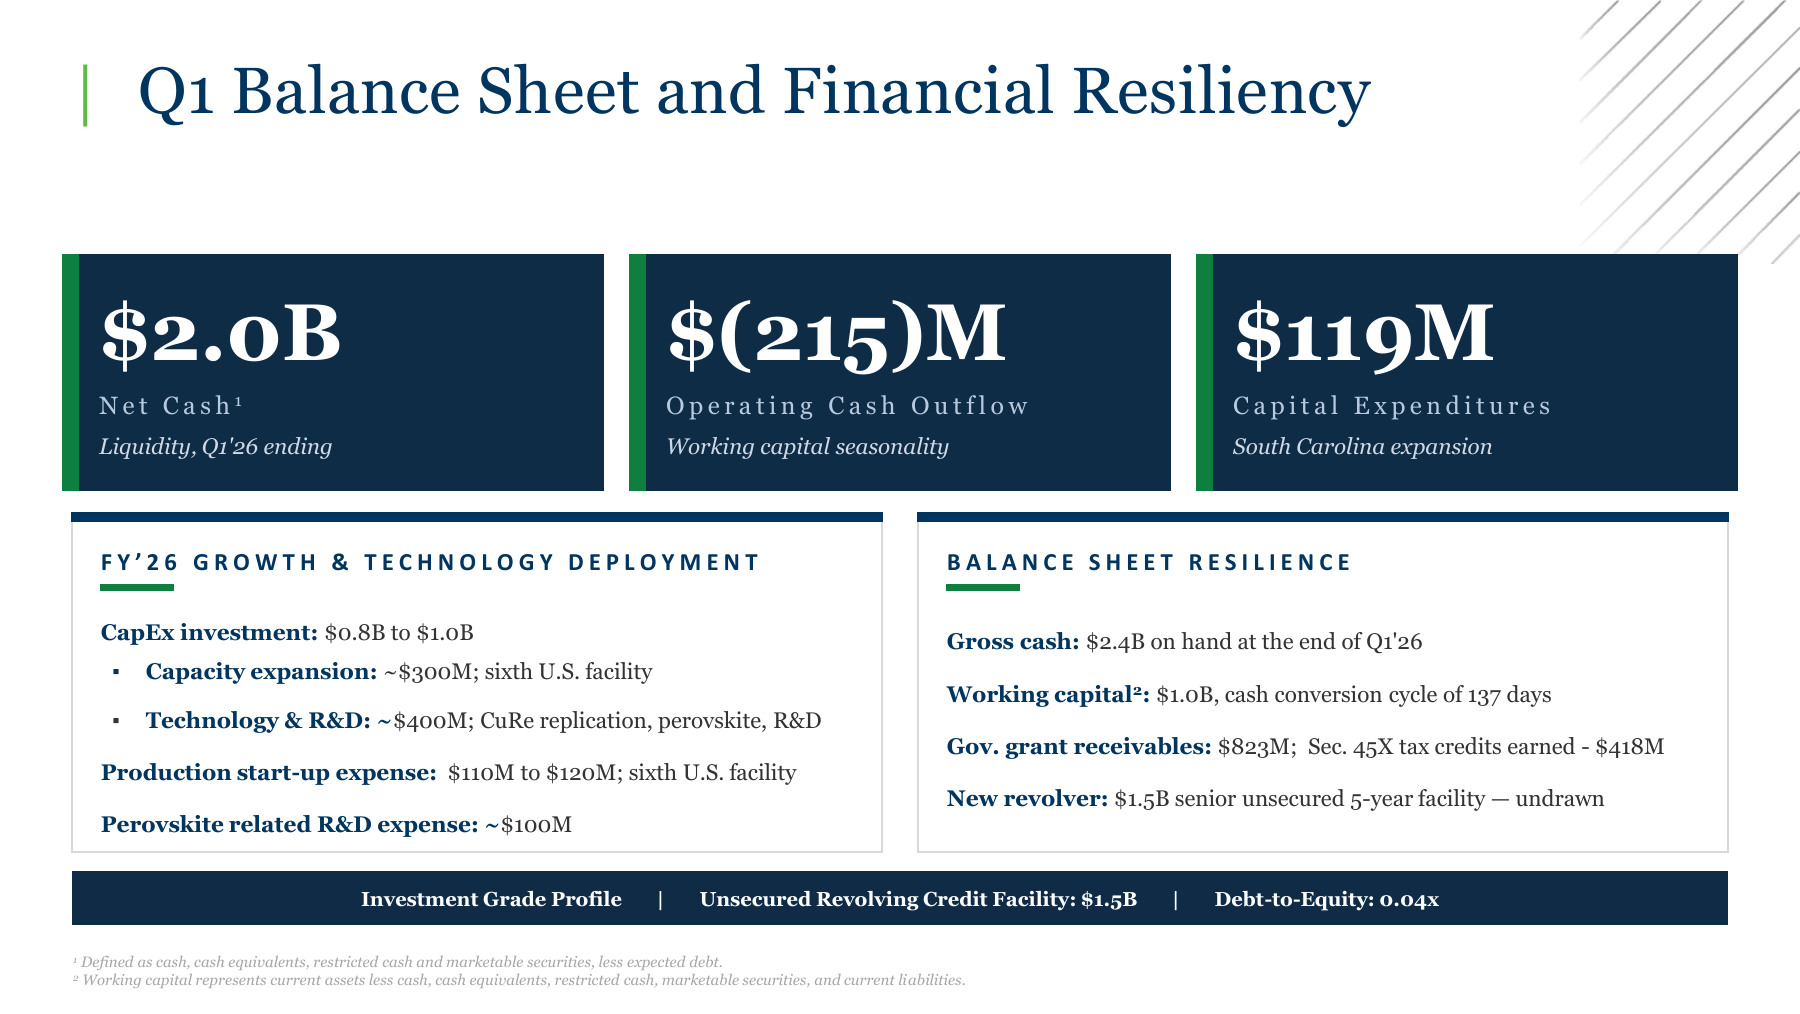
2026-04-30, rendered from the original PDF on 2026-07-15. Net cash is the company's defined measure; operating cash flow and capex are rounded.A simple operating-cash-flow-minus-capex proxy was therefore negative $333.4M. That proxy is not company-defined free cash flow, and one seasonal quarter should not be annualized. It does expose the conversion question that a backlog chart cannot answer.
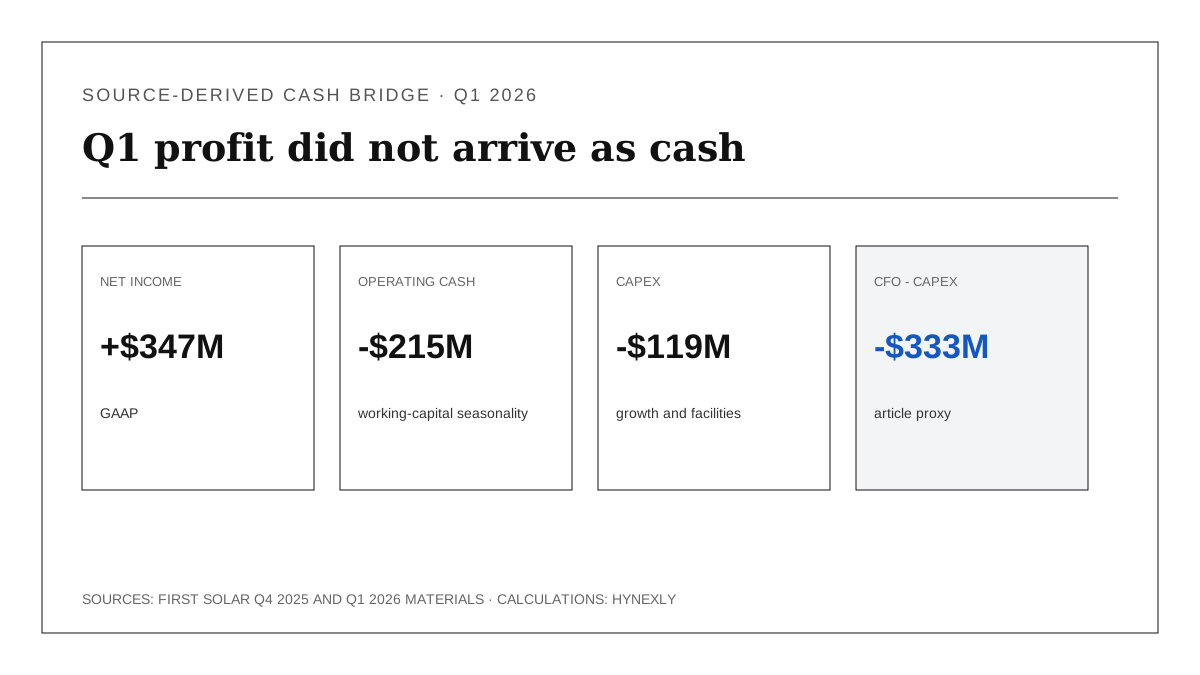
-$214.866M operating cash flow - $118.529M capex = -$333.395M. It is a simple article proxy, not First Solar's non-GAAP measure.The balance sheet provides time. Quarter-end net cash was $2.0B and the company had an undrawn $1.5B revolving facility. But net cash was down from $2.4B at year-end, while the South Carolina finishing facility and technology program still require funding. Visibility is valuable only if delivery and expansion do not consume the economics first.
Risks to the Thesis
| Risk | Current evidence | Failure signal | Why it matters |
|---|---|---|---|
| Replenishment stays below shipments | Q1 net replacement was 42.1% | Another quarter below 50% | Backlog duration falls faster than new demand refills it |
| Contract value does not equal realized revenue | Delivery extends through 2030 | Delays, de-bookings or price adjustments | Timing and mix can weaken the headline value |
| Policy economics change | $418M of Q1 Section 45X credits | Credit, tariff or eligibility assumptions worsen | Reported margin is highly policy-sensitive |
| Customer projects fail | 10-Q discloses termination and financing risks | Defaults, project abandonment or litigation | Contracted volume may not convert as planned |
| Manufacturing execution slips | New facilities and CuRe rollout are underway | Ramp delays, underutilization or warranty costs | Delivery and margin depend on factory performance |
| Cash remains trapped in working capital | Q1 CFO was -$214.9M | Repeated outflow despite deliveries | Accounting earnings would overstate owner economics |
The customer risk is not boilerplate only. The 10-Q describes a dispute in which First Solar seeks $323.6M of remaining termination payments, while counterparties assert $175M of damages plus return of $15M of credit support. No outcome should be assumed, but the case proves that signed contracts still carry enforcement and collection risk.
Trade policy can also cut both ways. Tariffs can support domestic manufacturing, yet the filing says they can raise customer costs for trackers, inverters and transformers, delay projects or allow contracts to be canceled under certain provisions. A policy tailwind for the module supplier can become a financing headwind for the project buyer.
What Flips the Call
The thesis strengthens if the next official earnings package preserves the $4.9B-$5.2B sales guide, improves the 42.1% net-booking replacement baseline, keeps de-bookings contained and shows operating cash moving toward reported earnings. It weakens if a second sub-50% replacement quarter arrives alongside guide pressure, customer disputes or worsening cash conversion.
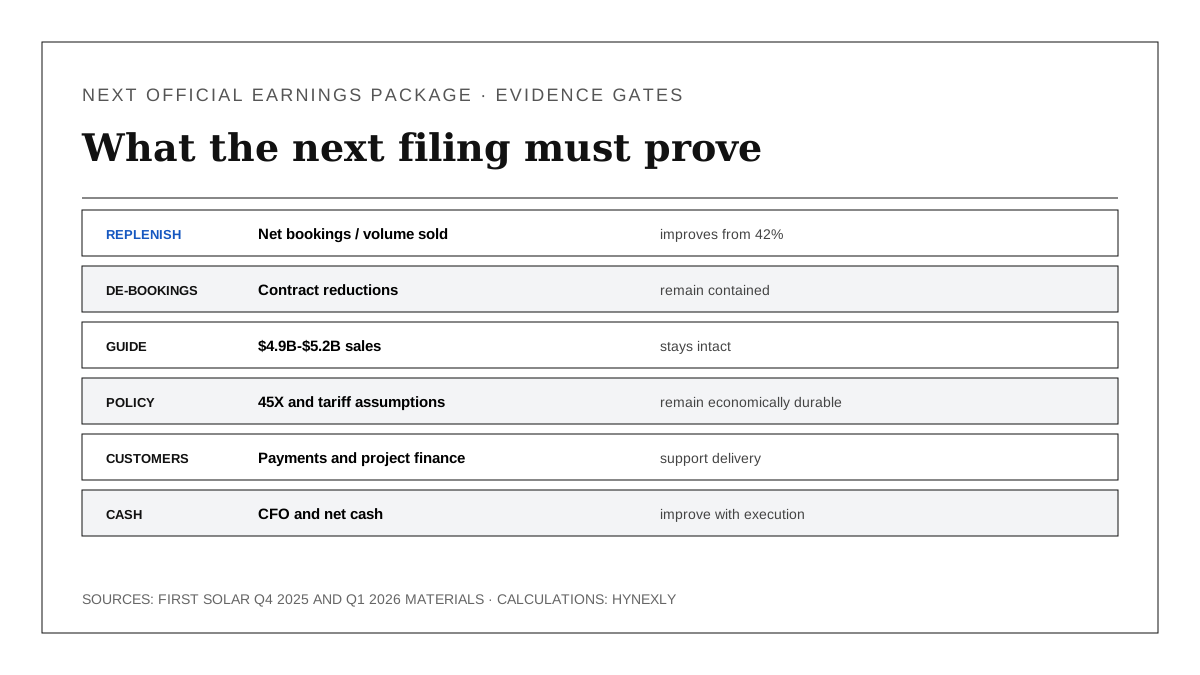
2026-07-15; these are evidence gates, not a rating or price target.| Next evidence gate | Q1 baseline | Stronger evidence | Warning evidence |
|---|---|---|---|
| Net-booking replacement | 42.1% | Clear improvement while price holds | A second quarter below 50% |
| De-bookings | 0.1 GW | Remain immaterial to deliveries | Material cancellation or termination |
| 2026 net-sales guide | $4.9B-$5.2B | Maintained with delivery detail | Cut or delayed volume |
| Section 45X | $418M in Q1 | Credit realization matches assumptions | Eligibility, discount or policy erosion |
| Operating cash flow | -$214.9M | Working-capital release | Continued outflow despite shipments |
| Net cash | $2.0B | Expansion remains funded | Cash declines without visible returns |
Methodology, Sources and Disclosure
This article uses public information available through 2026-07-15. Backlog coverage divides 47.9 GW by the 17.6 GW midpoint of volume guidance and $14.4B by the $5.05B midpoint of revenue guidance. Backlog value per watt divides $14.4B by 47.9B watts. The market comparison multiplies a $220.58 Nasdaq snapshot by 107,453,363 shares disclosed in the Q1 filing; it is not enterprise value, a DCF or a price target.
The Section 45X bridge mechanically subtracts the reported $418M credit from $486.131M of gross profit. It does not model how prices, volumes, sourcing, capacity or competitors would change under different policy. The cash proxy subtracts capex from GAAP operating cash flow and is not First Solar's definition of free cash flow.
AI assisted with organizing the public-source ledger, calculations and bilingual consistency checks. Every material number, formula, image and conclusion was checked against the cited primary documents. Educational research only; not personalized investment, legal or tax advice. No position, sponsorship or affiliate relationship is disclosed for this article.