Green Transition
EU ETS, California, RGGI, and China Show Four Carbon-Market Realities
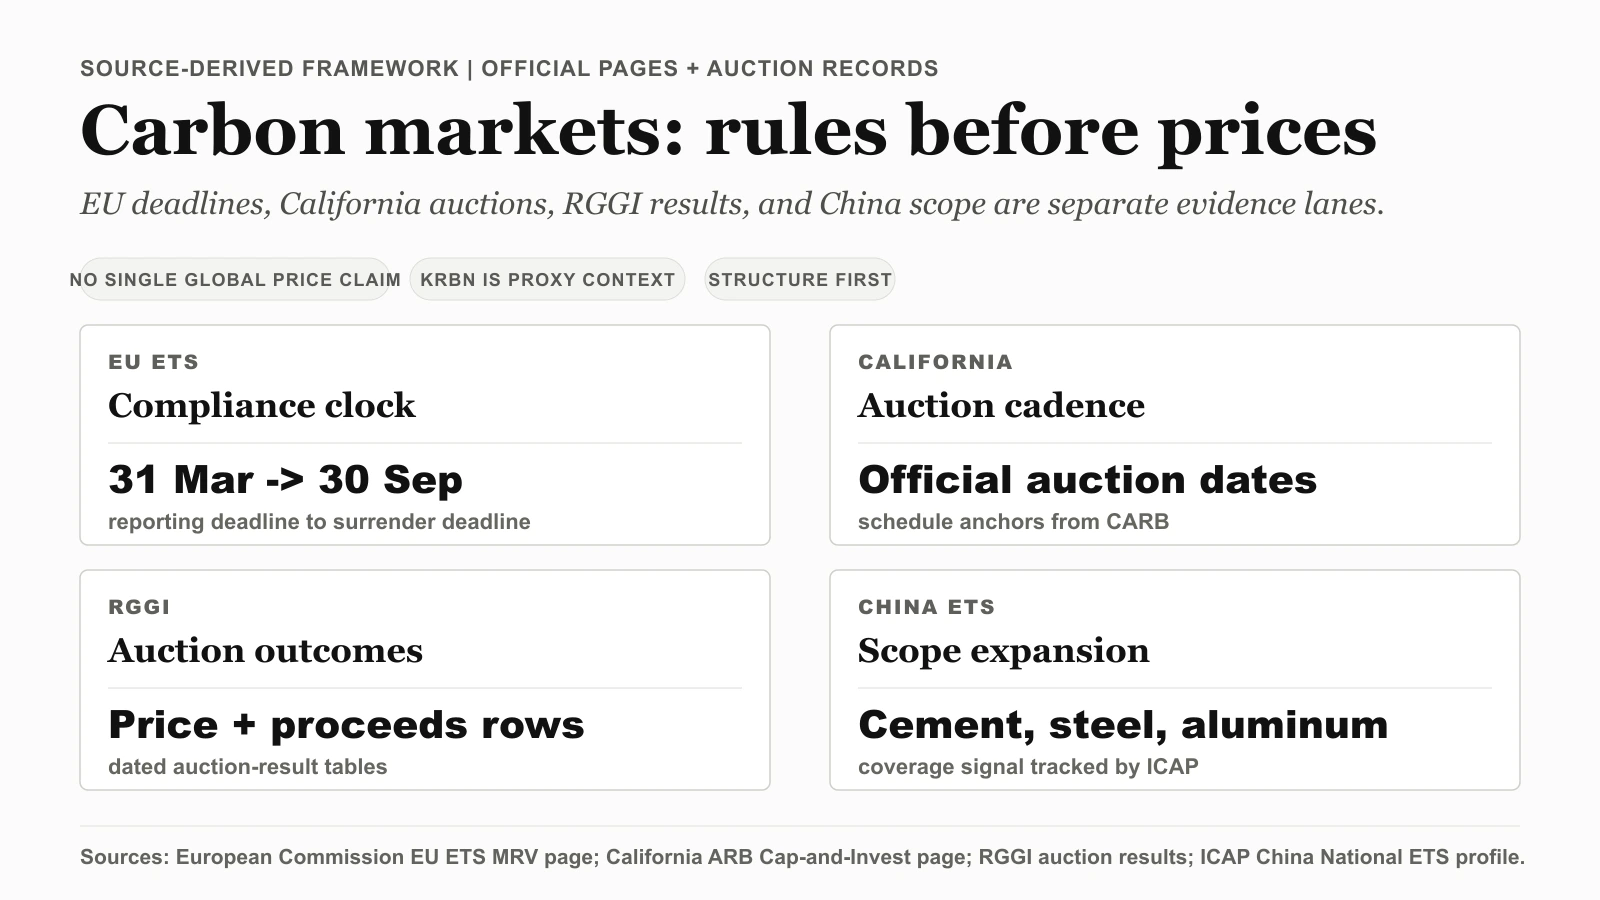
EU ETS, California, RGGI, and China's ETS, compared from official rules and auction tables — proxy prices kept separate, and no premature convergence story.
Thesis
(Source: RGGI Auction Results)
An earlier pass at this comparison was shaping up as a price story. The published version is not. It turns on two dates the EU MRV page lists separately — 31 March for emissions reporting, 30 September for allowance surrender — and that switch dictated the rest of the process. Each jurisdiction was opened from its own primary document, meaning the EU ETS MRV page, the CARB cap-and-invest page, the RGGI auction-results table, and the ICAP China tracker, and we logged what each one actually controls before letting any "convergence" framing in. Where a claim could only be sourced to a price proxy like KRBN rather than a regulator page, it stayed out of the structural section.
Related reading: The KRBN Wrapper Is the First Check Before Carbon Credit Exposure | What the 2026 FOMC Calendar Says About When Fed Cuts Can Come | Verify Your Broker Before You Pick a Single U.S. Stock
The tidy version of this story is one carbon price slowly pulling every market toward it. Hold that aside and the records say something messier: program status, reporting and surrender dates, auction design, auction outcomes, and covered-sector scope all differ by market.
The objective is not to publish a single global price forecast. It is to read official pages and auction tables first, then put the comparison framework on top of that record.
That structure also keeps this page distinct from the carbon-credit exposure guide. The guide asks which product wrapper a reader can research. This comparison asks which official source answers each jurisdiction question before any product or price proxy enters the discussion.
Source Evidence Snapshot
The hero visual is a comparison map, not a source capture. The table below maps each jurisdiction to the official page or auction table that answers the comparison question.
| Source | Evidence role | 2026 comparison question |
|---|---|---|
| European Commission EU ETS MRV page | Confirms the annual reporting and surrender rhythm, including 31 March and 30 September dates. | How deadline-driven is the compliance architecture? |
| California Air Resources Board - Cap-and-Invest Program | Defines California's cap-and-invest framework and publishes auction cadence. | Is the program giving market participants dated auction anchors? |
| RGGI Auction Results | Provides dated auction rows with clearing-price and proceeds fields. | Are there observable auction outcomes rather than only policy language? |
| ICAP - China National ETS | Tracks China ETS status and scope updates, including the cement, steel, and aluminum expansion signal cited in the article. | Is the system's coverage breadth changing, even before assuming global linkage? |
This keeps the article's role distinct from a price chart page. It is a jurisdiction-by-jurisdiction evidence map, so the useful evidence is which official source controls each claim.
What These Sources Prove
1) The EU ETS remains rule-dense and deadline-driven
The EU page highlights that market participation is tied to a strict annual cycle. Operators monitor and report, submit by 31 March of the following year, and surrender allowances by 30 September. The same page also documents the excess-emissions penalty framework.
One derived read sharpens the calendar. The post's own two dates bracket a fixed window: from the 31 March report deadline to the 30 September surrender deadline is exactly six months — half the year — leaving the other six months (30 September to the next 31 March) for the following compliance cohort. So the EU cycle is not a single annual deadline; it is two back-to-back six-month halves, and the surrender half is the one where an operator that is short allowances has a hard, dated settlement clock running.
That structure is what makes compliance timing legible. The surrender half-year is when entities that have not yet secured allowances face the closing window, so it is the predictable interval to watch for compliance-driven demand — not a vague "sometime in the year" risk.
2) California is not static; it runs with explicit auction cadence
The CARB page confirms program continuity under the cap-and-invest label and publishes a concrete upcoming auction date. That visible cadence is useful for risk planning because it gives market participants a schedule anchor rather than a purely discretionary policy timeline.
3) RGGI provides live auction evidence, not just policy language
The RGGI results page provides dated rows with quantity, clearing price, and proceeds fields. This is the type of evidence that supports comparative analysis across programs because it gives observable outcomes, not only program intent.
4) China's national ETS status and scope evolution are explicitly tracked
ICAP's China page marks the system as in force and references the official expansion headline to cement, steel, and aluminum. That is a material scope signal for anyone comparing carbon-market breadth, even before making stronger claims about pricing depth or international linkage effects.
What These Sources Do Not Prove
- They do not prove a single global carbon price path.
- They do not prove automatic market linking across jurisdictions.
- They do not prove identical enforcement intensity across all systems.
This distinction is important because over-aggregated carbon-market narratives often collapse very different legal and compliance structures into one storyline.
Listed Proxy Context
A Practical Comparison Framework for 2026
When comparing carbon markets across jurisdictions, treat each system as a separate structure and score it on four dimensions:
- Compliance architecture.
- Auction transparency.
- Scope breadth.
- Policy update cadence.
Applied to the sources above:
- EU: highly explicit compliance and penalty architecture.
- California: clear policy framing and dated auction-forward communication.
- RGGI: transparent, repeatable auction-outcome reporting.
- China ETS (ICAP tracker): in-force status and scope-expansion signals.
The point is not to rank one market as universally better than another. It is to make the comparison auditable. If a reader can trace each claim back to a specific regulator page, auction table, or ICAP status update, the market map is less likely to drift into broad climate-policy generalization.
Update Workflow You Can Reuse
Use fixed checkpoints instead of ad-hoc commentary:
- EU: re-check MRV and compliance-rule pages after major legislative updates.
- California: monitor posted auction notices and proceeds reports.
- RGGI: update comparisons after each new auction row appears.
- China ETS: track ICAP profile updates and official expansion notices.
Evidence Freshness Note
This comparison uses source pages reviewed on 2026-04-07. If RGGI posts new auction rows, recheck the official auction results page first, then recheck any cross-market timing statements before updating conclusions.
What Changes the Comparison
Carbon markets are expanding, but they are not interchangeable. The strongest analysis in this space starts with rule text, compliance deadlines, and auction tables, then layers interpretation on top. For operating teams, a dated evidence log with source URLs and review dates improves cross-market comparability and editorial auditability.
Related reads: