Market & Macro
10-K Filings in 2026: Filing-First Checks Before a Stock Thesis
A 2026 filing-first guide to reading annual 10-K reports through EDGAR, business sections, risk factors, MD&A, audited financial statements, and cash-flow checks before forming a stock thesis.
(Sources: Investor.gov - How to Read a 10-K, SEC - Using EDGAR to Research Investments, NVIDIA FY2026 Form 10-K)
Thesis
Many retail readers still approach stock research in reverse order. They start with a chart, a social post, or a one-line earnings headline, and only later look for the filing that actually explains the business.
Related reading: Fed Rate Outlook in 2026: Data Triggers Before Cuts | Carbon Credit Exposure in 2026: Product Structure and Diligence Questions | U.S. Stock Investing in 2026: Broker Checks Before Stock Selection
That workflow is backwards. If the goal is to build a more disciplined company view, the 10-K is usually the better starting point. The SEC's EDGAR guide describes Form 10-K as the annual report filed by domestic public companies, and says it provides audited annual financial statements, a discussion of material risk factors, and management's discussion and analysis of results of operations. That combination matters because it pushes a reader out of narrative mode and into disclosure mode.
This does not mean a 10-K is perfect. It is still written by the company and its counsel. It is still selective. But it is one of the few places where management has to explain the business, the risks, and the numbers inside a structured filing readers can compare year over year.
Source Evidence Snapshot
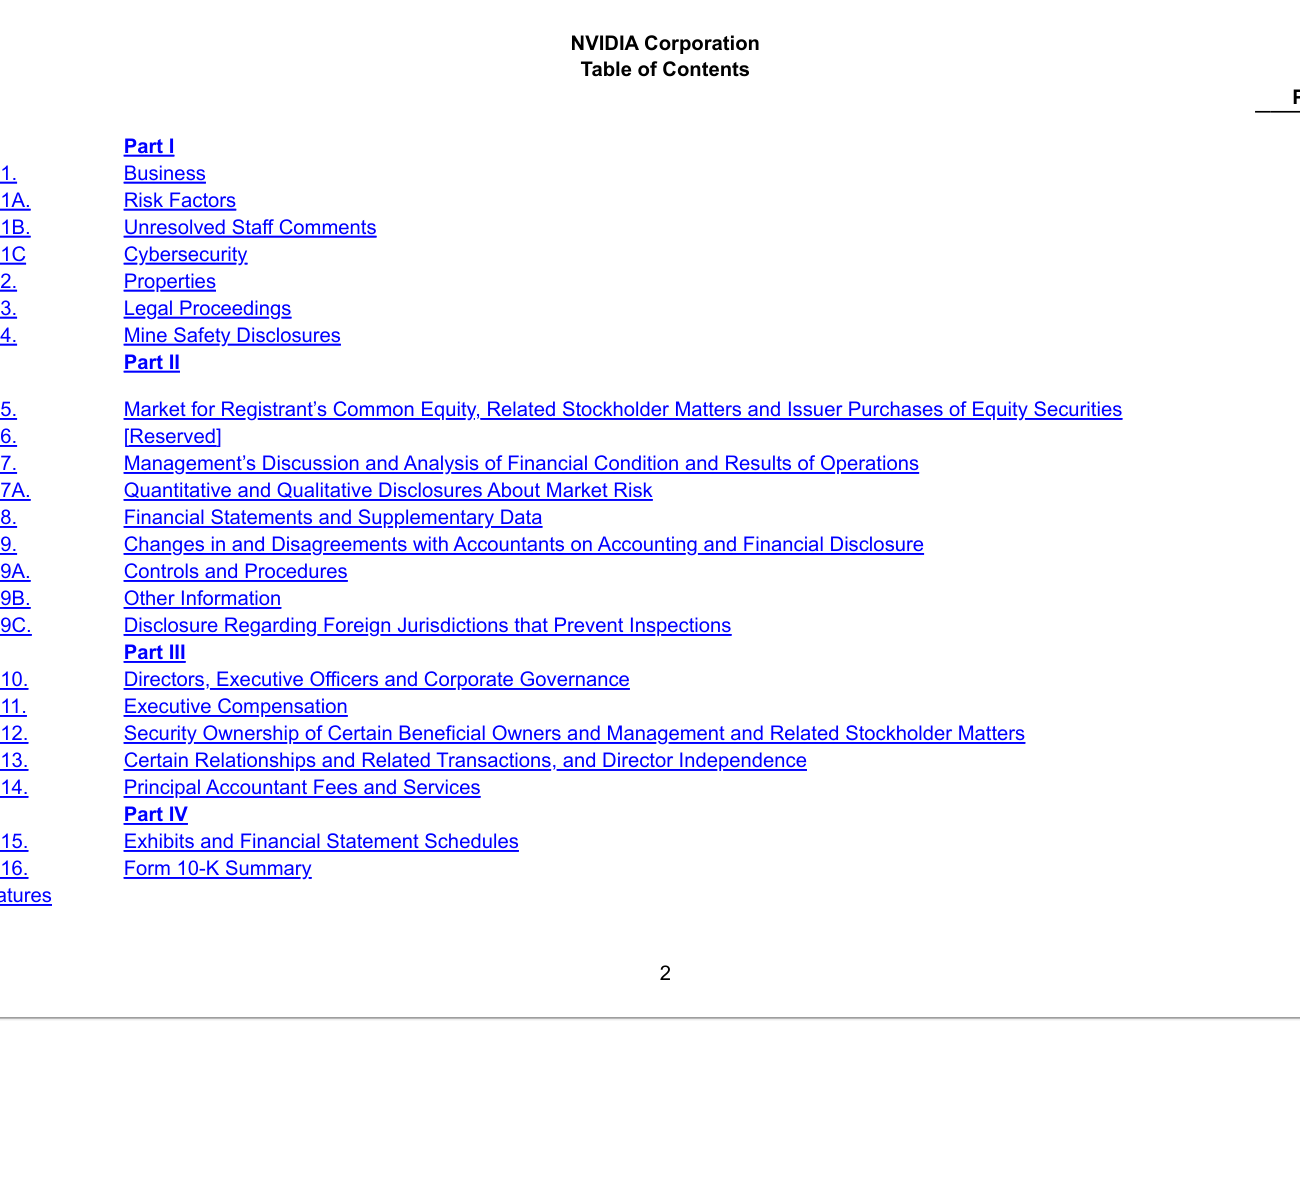
The hero image already carries the NVIDIA 10-K table-of-contents map. The body evidence avoids repeating that page and uses the MD&A excerpt as a separate filing layer for checking management narrative against risks and audited statements.
 Source capture: NVIDIA FY2026 Form 10-K, captured from page
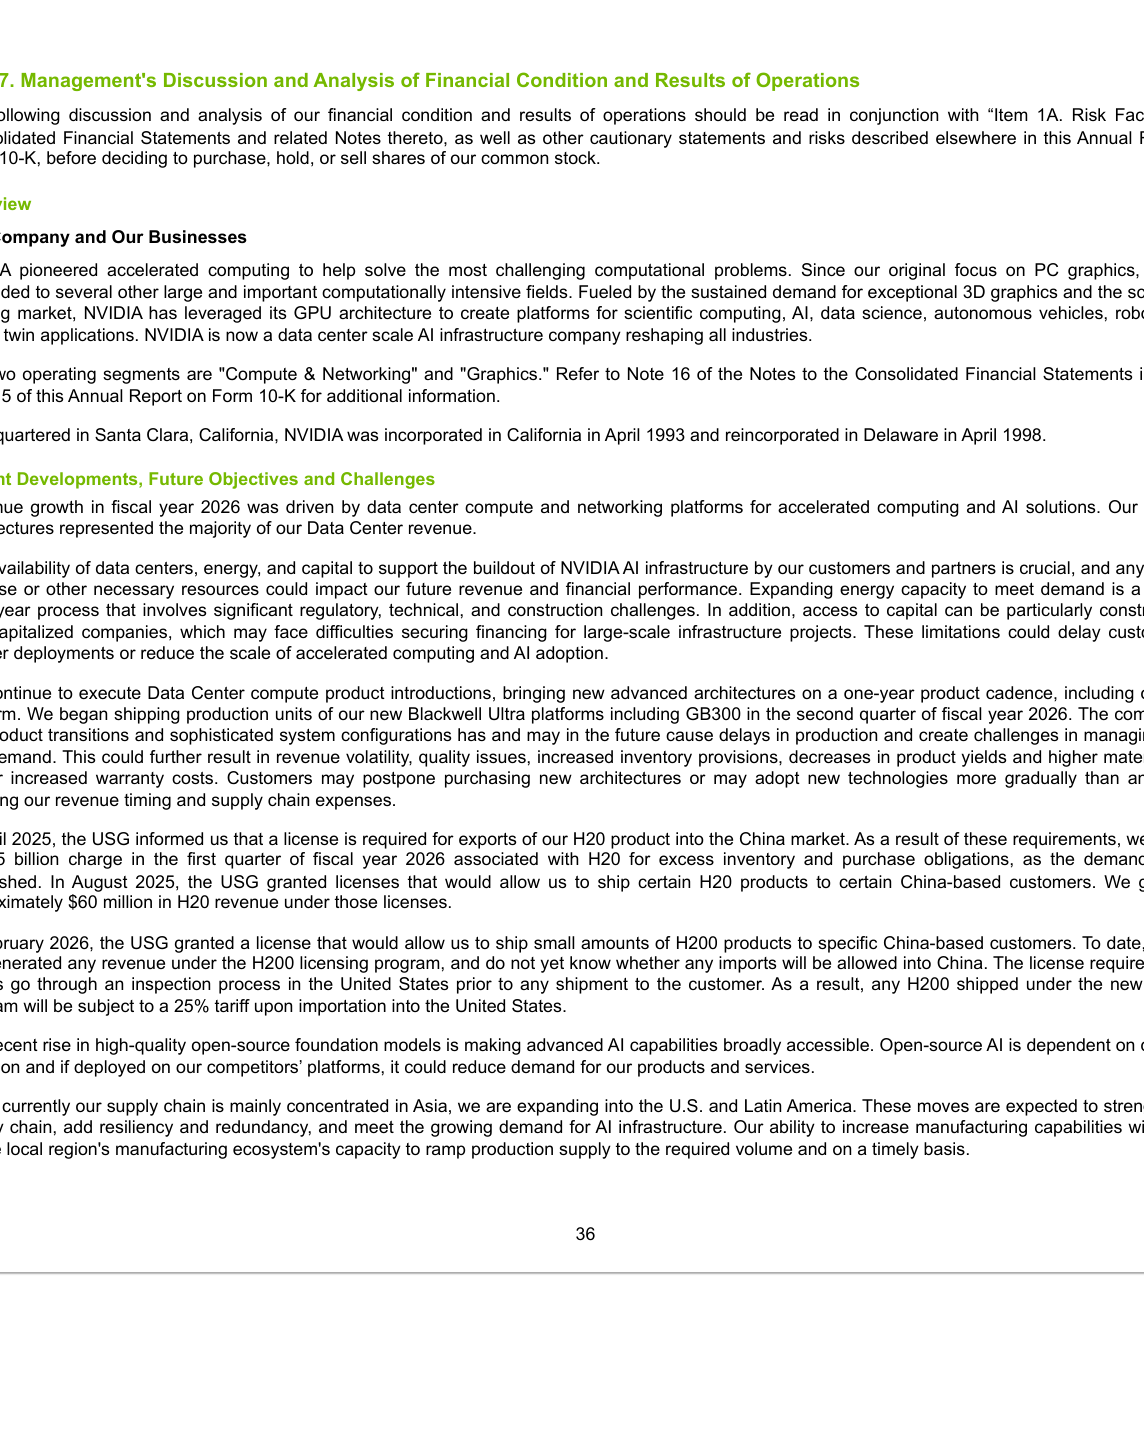
 36, MD&A opening paragraph used to anchor management-narrative checks against risk and audited statements.
Start with the Table of Contents, Not the Story
The fastest way to make a 10-K readable is to stop thinking of it as one giant document. It is really a set of sections with different jobs.
In NVIDIA's fiscal 2026 annual report, for example, the table of contents puts Item 1 "Business" on page 4, Item 1A "Risk Factors" on page 12, Item 7 "Management's Discussion and Analysis of Financial Condition and Results of Operations" on page 36, and Item 8 "Financial Statements and Supplementary Data" on page 45.
That structure is useful because it tells you where each kind of answer lives:
- What does the company actually earn revenue from? Go to Business.
- What could break the thesis? Go to Risk Factors.
- What does management say explains the year? Go to MD&A.
- What do the audited numbers actually show? Go to Financial Statements.
That is a much better starting map than reading random excerpts quoted on finance social media.
Read the business section like a product map
Investor.gov's 10-K primer says the Business section is a good place to start because it describes the company's main products and services. That sounds basic, but it is where many research mistakes begin.
Readers often think they understand a company because they know the ticker and the headline narrative. A filing forces a more precise question: what revenue engine is actually being described here?
In NVIDIA's filing, the business section says the company is now a "data center scale AI infrastructure company" and identifies two operating segments: "Compute & Networking" and "Graphics." Even if someone already knows the stock, that framing matters. It tells the reader how management itself organizes the business and where it wants the market to focus.
For any company, the business section is where to look for:
- revenue drivers by segment or product family
- major customer groups or end markets
- distribution model and sales channel language
- dependence on specific technologies, suppliers, or platforms
This is also the section that helps separate real business complexity from branding language. If the company story sounds simple in interviews but complicated in the 10-K, trust the filing.
Risk factors are not filler
Many readers skip risk factors because they are long, repetitive, and often written in legal language. That is understandable, but it is still a mistake.
Investor.gov says the Risk Factors section includes significant risks the company faces and that they are generally listed in order of importance. The exact ordering will not always match how the market prices risk in real time, but the section still shows what management and counsel believe they must disclose formally.
A useful way to read risk factors is to scan for clusters, not isolated sentences. In practical terms, look for repeated exposure to:
- customer concentration
- regulation and export controls
- supply chain dependence
- cyclicality and pricing pressure
- litigation, cybersecurity, or accounting controls
The goal is not to memorize every page. The goal is to identify the handful of risks that would genuinely change your view of the stock if they worsened. A filing is most useful when it tells you what has to stay true for the bullish case to keep working.
MD&A is where management explains the year in its own words
Investor.gov describes MD&A as the section that gives the company's view on the business results of the past fiscal year and allows management to tell its story in its own words. That is exactly why it deserves special attention.
The reason MD&A matters is that it creates a bridge between raw numbers and management's explanation of those numbers. On page 36 of NVIDIA's fiscal 2026 10-K, the filing explicitly says the discussion should be read together with Risk Factors and the consolidated financial statements before forming a company-level view. That instruction is worth taking literally.
When reading MD&A, three questions usually matter more than everything else:
- What does management say drove growth or weakness?
- What constraints does management admit are still present?
- Are the explanations consistent with what the financial statements show?
If management says demand is strong but inventory, margins, or receivables are deteriorating, that tension matters. If management says growth is broad-based but the business is becoming more concentrated, that matters too. MD&A is not useful because it is objective. It is useful because it reveals how management wants the market to interpret the year.
The audited financial statements still decide the argument
The filing story matters, but the audited financial statements still carry the most weight. Investor.gov's primer highlights the income statement, balance sheet, and statement of cash flows as core pieces of the annual report.
For a first-pass read, this is the simplest working order:
- income statement: check revenue growth, operating income, and whether profitability is expanding or narrowing
- balance sheet: check cash, debt, inventory, and whether the capital structure looks stronger or more fragile
- cash flow statement: check whether accounting profit is actually turning into operating cash
In practice, the cash flow statement often does the most work. A company can produce a clean narrative around adjusted earnings for a surprisingly long time, but it is much harder to fake persistent cash generation. That is why many experienced readers end up spending disproportionate time on cash flow, capital expenditures, stock-based compensation, and share count.
The income statement tells you what the company earned. The cash flow statement helps show what the business actually converted into cash. The difference between those two is often where the most important questions live.
EDGAR is the simplest place to verify what kind of filing you are reading
The SEC's EDGAR guide is useful because it explains the mechanics of finding filings without turning the process into a scavenger hunt.
According to the SEC, EDGAR can be searched by typing a public company's name or ticker symbol on SEC.gov. The guide also says EDGAR search results are presented in chronological order and identify filings by form type in the first column.
That small detail is important because it immediately tells you what you are reading:
10-K= annual report10-Q= quarterly report8-K= current report for material events before the next scheduled quarterly or annual report
This is one of the cleanest habits a new reader can build. Before reacting to any market-moving claim, check the form type. A thesis based on an 8-K headline is not the same thing as a thesis based on a full annual report with audited statements.
A practical 20-minute first-pass workflow
A 10-K becomes much less intimidating if the first read has a fixed order.
Minutes 1 to 3: read the business summary and segment language
Start by answering one question: how does this company actually make money? If you cannot explain that in two or three sentences after reading the business section, you do not yet understand the company well enough to research it.
Minutes 4 to 8: scan risk factors for the real failure points
Do not try to score every disclosed risk. Look for what would actually damage revenue durability, margins, capital access, or regulatory permission to operate.
Minutes 9 to 14: read MD&A for management's causal story
Look for what management claims drove the year, where it admits constraints, and whether the explanations are specific or vague.
Minutes 15 to 20: check the audited statements, especially cash flow
Focus on whether the business is producing cash, whether balance sheet risk is rising or falling, and whether the accounting story and the cash story still match.
That is enough to form a much better first judgment than most market commentary provides.
Why This Still Matters for Filing-First Research
The value of a 10-K is not that it tells you which action to take. The value is that it helps you ask better questions before building a company view.
A strong filing does not automatically mean the stock is attractive. A weak filing does not automatically mean the stock is uninvestable. But a disciplined filing read can tell you whether the thesis depends on facts you can verify or on assumptions you have not tested yet.
That is why the 10-K remains one of the most practical tools in public-market research. It is audited where it needs to be audited, structured where a market narrative is often messy, and comparable across time in a way most commentary is not.
That is the core point for any disciplined reader. Good stock research starts when a story meets disclosure. The 10-K is where that meeting happens.