Market & Macro
10-Q Filings in 2026: Post-Earnings Checks Before a Stock Thesis
A filing-first 2026 guide to checking a 10-Q after earnings through the reporting period, statements of operations, cash flow, MD&A, and disclosure updates before forming a stock thesis.

(Sources: Investor.gov - How to Read a 10-K/10-Q, Apple Form 10-Q for the quarter ended December 28, 2024, Apple FY25 Q1 Consolidated Financial Statements PDF)
Thesis
Many post-earnings reads still start in the wrong place. They begin with the beat or miss headline, check the post-market move, and only later ask what the company actually filed.
Related reading: Fed Rate Outlook in 2026: Data Triggers Before Cuts | Carbon Credit Exposure in 2026: Product Structure and Diligence Questions | U.S. Stock Investing in 2026: Broker Checks Before Stock Selection
That sequence is backwards. If a stock thesis is going to survive more than one news cycle, the filing matters more than the first headline. Investor.gov describes the 10-Q as a shorter quarterly filing than the 10-K, but it still includes the pieces a reader needs to verify before deciding whether the quarter was genuinely strong, weak, or simply different from the market narrative.
Apple's quarter ended December 28, 2024 is a useful example because the filing and the official quarterly statements show how sales, margins, and cash generation can move together but not always in the same direction.
Source Evidence Snapshot
The hero image already carries the Apple 10-Q cover page, so the body evidence starts one layer deeper: the operations statement and the cash-flow statement. The point is to move from "which filing is this?" to "what did the quarter actually prove?"
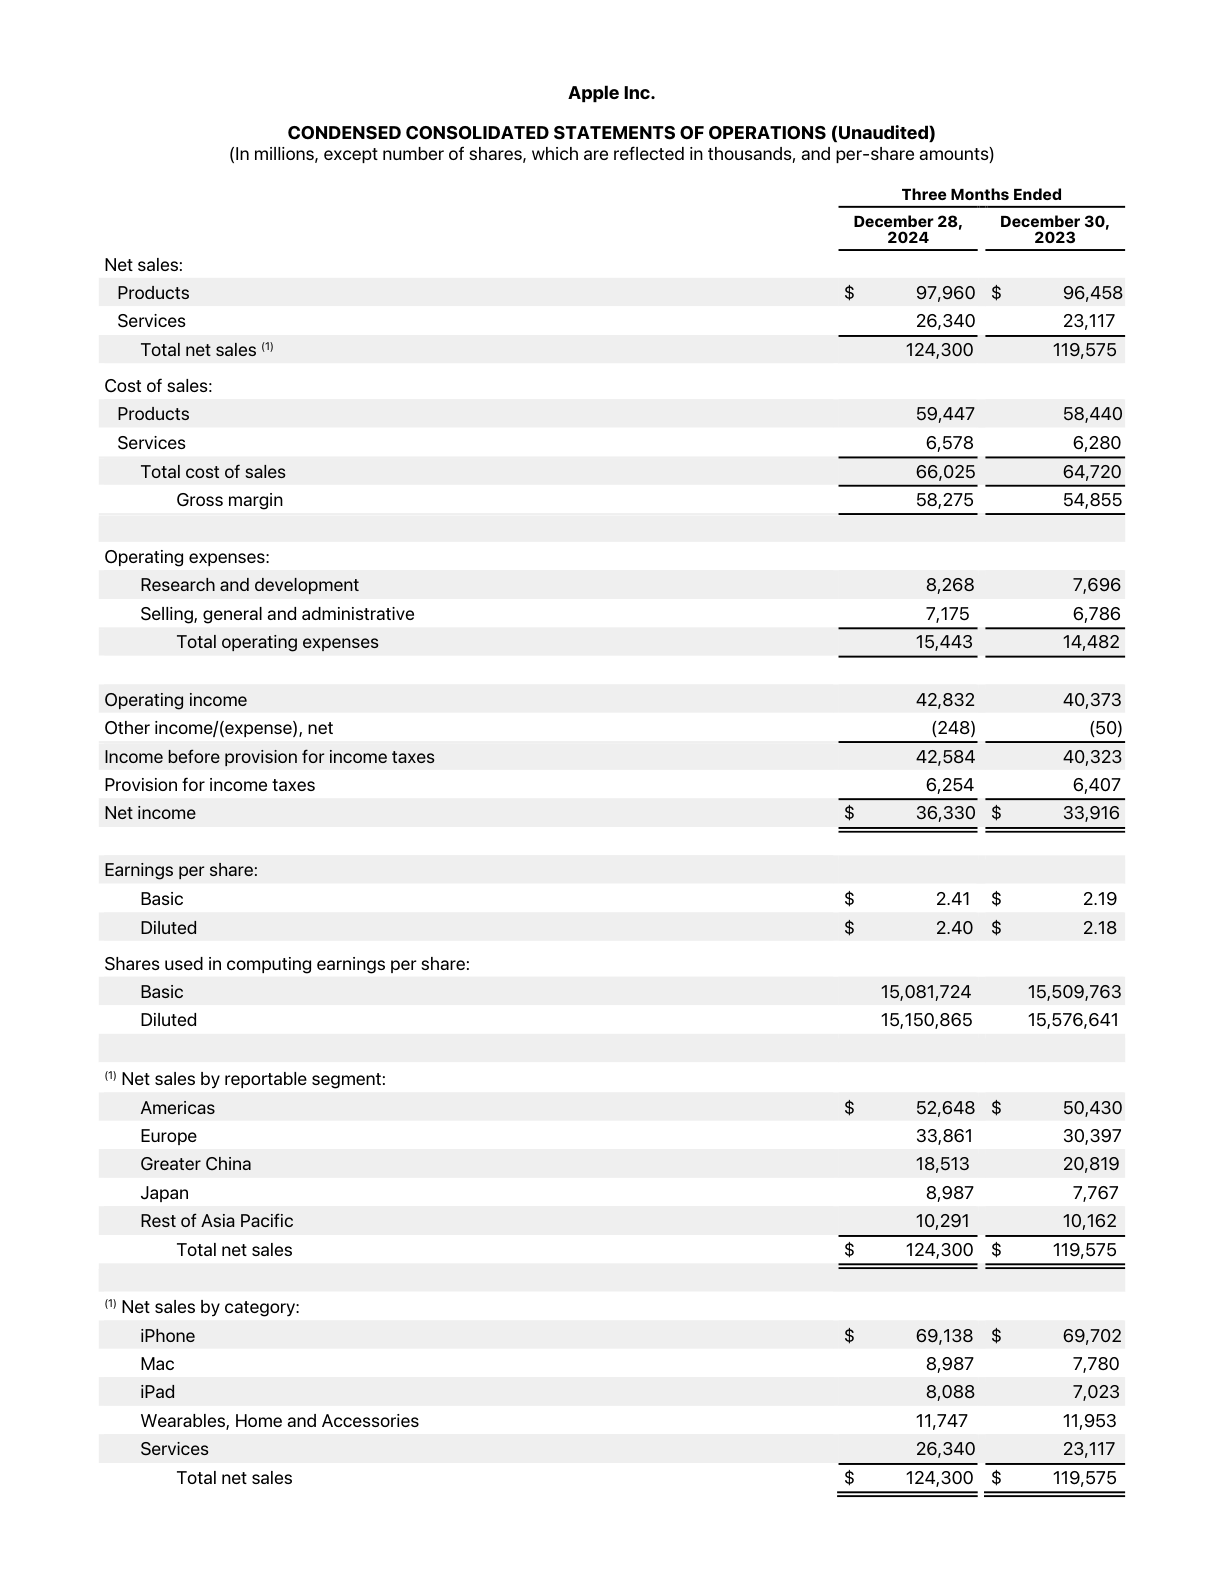 Source capture: Apple's FY25 Q1 statements of operations, captured 2026-04-05 from the official financial statements PDF. Notice the net sales, gross margin, operating income, and diluted EPS lines that test whether the headline summary is too simple.
Open source.
Source capture: Apple's FY25 Q1 statements of operations, captured 2026-04-05 from the official financial statements PDF. Notice the net sales, gross margin, operating income, and diluted EPS lines that test whether the headline summary is too simple.
Open source.
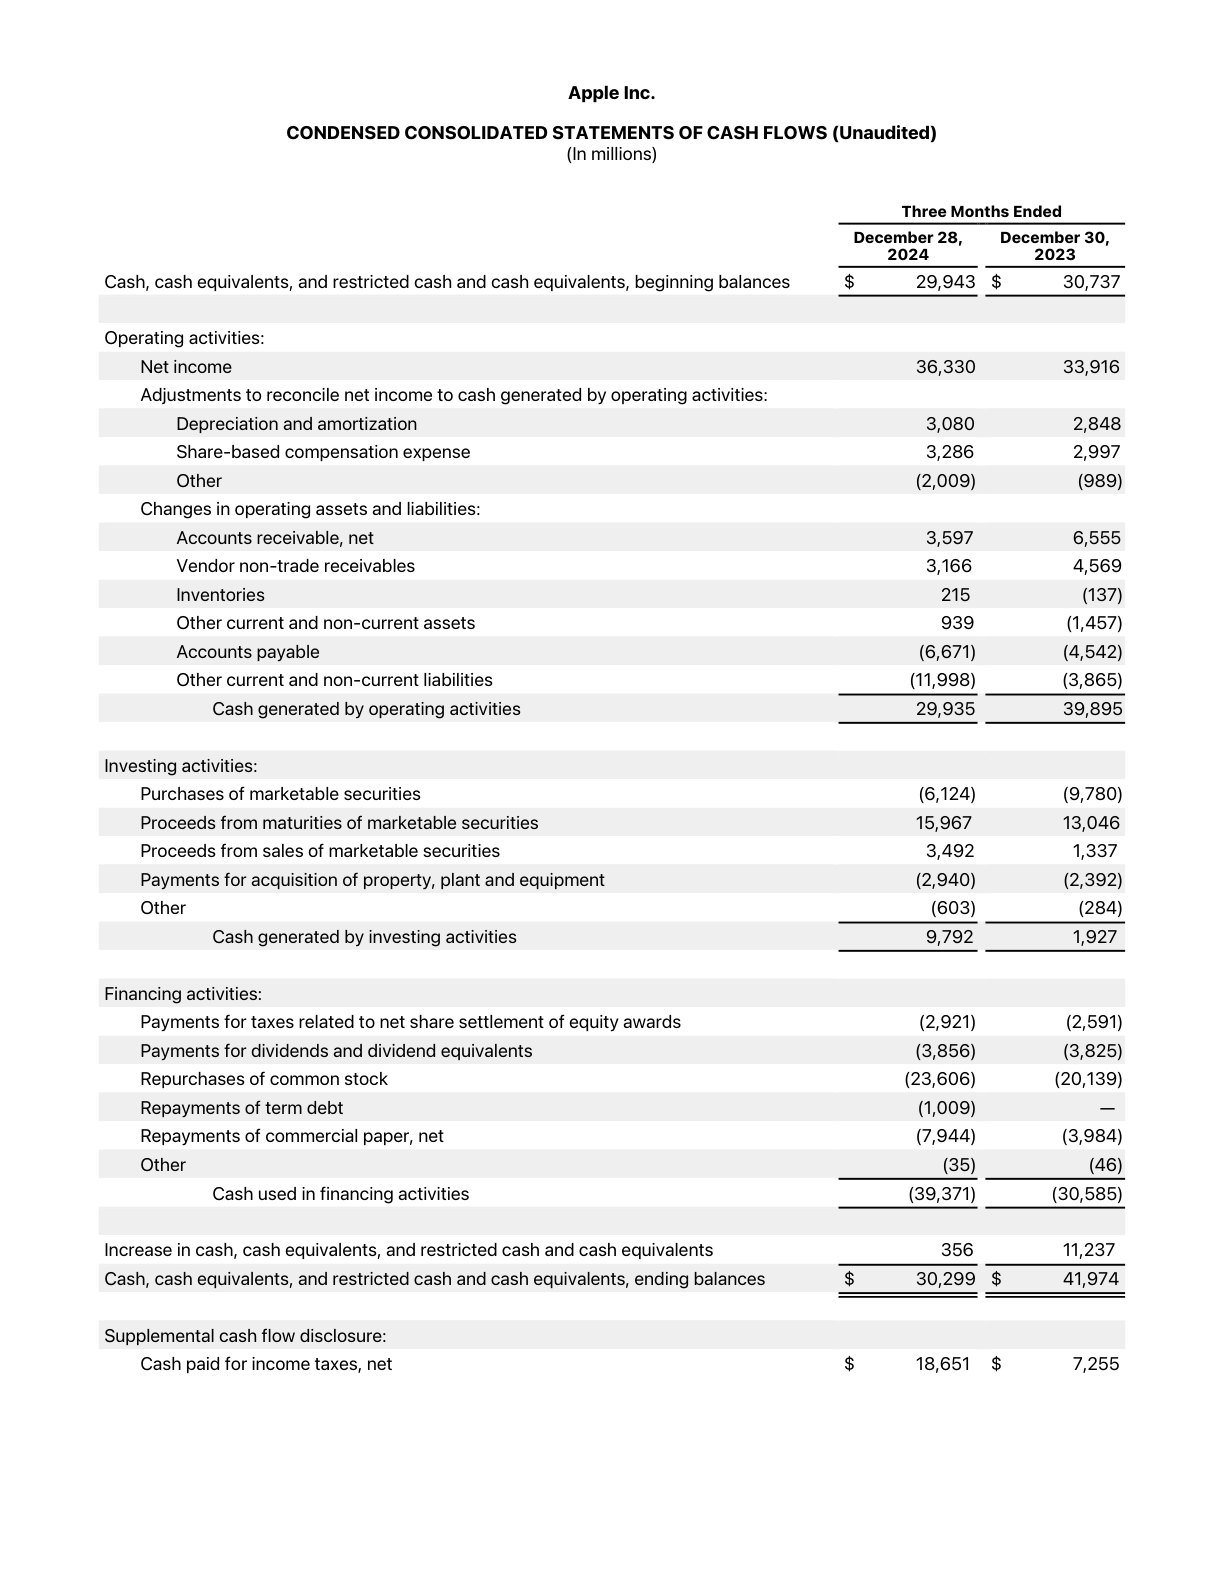 Source capture: Apple's FY25 Q1 cash-flow statement, captured 2026-04-05 from the official financial statements PDF. Notice how operating cash generation, investing flows, dividends, and share repurchases can change the read on the same quarter.
Open source.
Source capture: Apple's FY25 Q1 cash-flow statement, captured 2026-04-05 from the official financial statements PDF. Notice how operating cash generation, investing flows, dividends, and share repurchases can change the read on the same quarter.
Open source.
Start by confirming the filing, not the commentary
The first good habit after earnings is to confirm exactly what was filed and for which period. The Apple cover page makes the point clearly: this is a Form 10-Q for the quarter ended December 28, 2024. That sounds basic, but it is the step that stops investors from reacting to summary commentary without anchoring the discussion to the actual reporting period.
This is why the cover page matters. It pins the story to a legal filing, a date range, and an issuer before you start interpreting any management framing.
The income statement tells you whether the headline is too simple
The next step is the statements of operations. Apple's quarterly statement shows net sales of $124.3 billion, gross margin of $58.3 billion, operating income of $42.8 billion, and diluted earnings per share of $2.40.
Those are strong numbers, but the point of reading the statement is not to celebrate them. The point is to see which line is doing the work. Revenue, gross margin, and operating income can all improve while the mix of the business changes underneath. That is where you start checking whether the quarter was driven by broad demand strength, better product mix, cost control, or some combination of the three.
In practical terms, the statements of operations answer three useful questions quickly:
- Did sales actually grow, or did the quarter rely too heavily on expense control?
- Did gross margin expand enough to support the bullish commentary?
- Did operating income confirm that the improvement was not just cosmetic?
If those three lines do not support the earnings narrative, the quarter deserves a slower second read.
The cash-flow statement keeps the quarter honest
The cash-flow statement is where many quick takes fall apart. Apple's FY25 Q1 cash-flow statement shows net cash provided by operating activities of $29.9 billion, common-stock repurchases of $23.6 billion, and dividends of $3.9 billion.
That is exactly why the cash-flow page belongs in the first read, not the last one. A quarter can still look strong on revenue and operating income while cash generation, financing choices, or working-capital movements tell a more nuanced story.
The most useful questions are simple:
- Is the business still converting earnings into operating cash?
- Did the company use cash mostly for reinvestment, buybacks, debt reduction, or something else?
- Is the cash profile consistent with the market narrative, or does it complicate it?
This matters even more in expensive stocks, where investors often act as if a clean headline is enough.
A practical 15-minute post-earnings workflow
The goal is not to become an accountant in one sitting. The goal is to stop making lazy decisions off a headline.
Minutes 1 to 3: verify the filing
Open the 10-Q and confirm the reporting period, issuer, and filing type. Do not assume the article summary got it right.
Minutes 4 to 8: read the statements
Check total sales, gross margin, operating income, and any product, segment, or geographic mix tables. Ask what actually changed and where.
Minutes 9 to 12: read MD&A
Review management's explanation for the quarter. Then compare that explanation with the lines you already saw in the statements. If the story and the numbers feel misaligned, slow down.
Minutes 13 to 15: check cash flow and disclosure updates
Review operating cash flow, capital spending, financing flows, and any notable risk or controls language. This is often where the most useful second-order information lives.
Why this process still matters
The value of a 10-Q is not that it tells you which action to take. The value is that it narrows the gap between a market headline and a filed set of facts.
That discipline matters because quarterly narratives are often too clean. A stock can rally on a beat while showing weaker cash conversion. A stock can fall on one disappointing line while the filing still shows stronger breadth or resilience than the market assumed.
That is why the 10-Q remains one of the most practical documents in public-market research. It is short enough to read, formal enough to trust more than a headline, and detailed enough to catch what commentary often leaves out.
If the goal is filing-grounded stock research, the quarter does not start with a press release headline. It starts when the filing is opened and the story is tested against the numbers.