Bank Earnings: When Two Correct Calculations Disagree
Read bank earnings from revenue to net income. A BAC–Citi worked example separates growth rates, profit dollars, provisions and the attribution line.
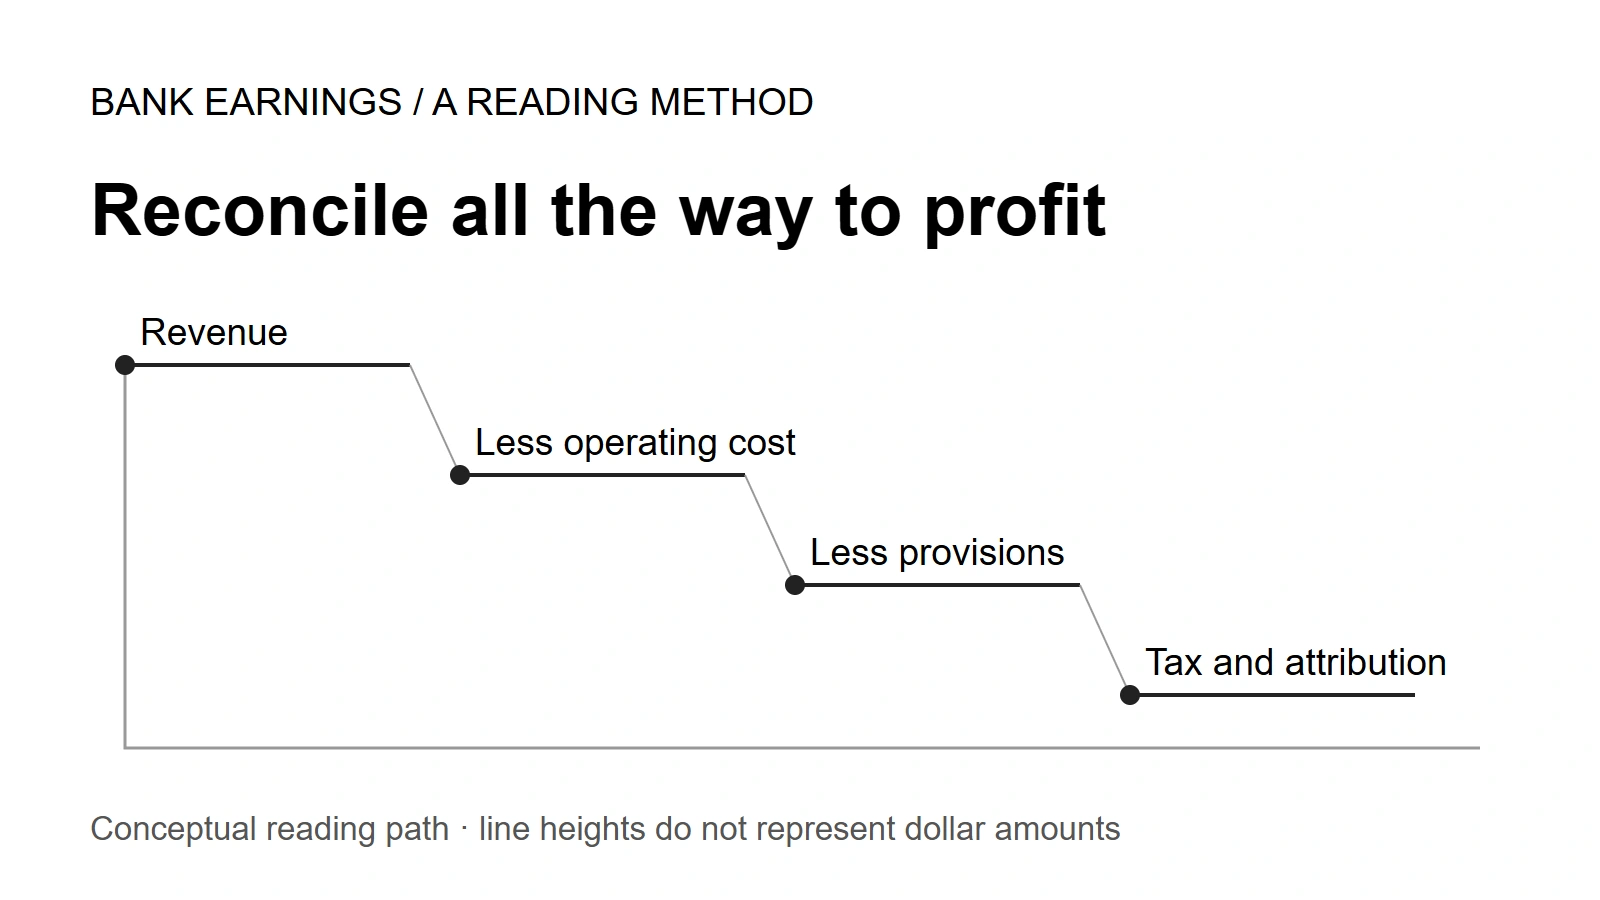
Open a bank earnings release and resist the urge to pick a winner from the first percentage. In the worked example below, Citi has the wider gap between revenue and expense growth. Bank of America adds more dollars after operating expenses. Both calculations are correct. They answer different questions.
First, decide what you are trying to measure
The practical starting point is a profit bridge: copy matching periods, subtract expenses, and keep going until the result agrees with reported net income. Ratios become more useful once you can explain the dollars underneath them.
| Question | Start here | Do not substitute |
|---|---|---|
What did the company report? | Income statement and adjustment reconciliation | An unlabeled adjusted headline |
How much growth survived costs? | Revenue increase less expense increase | A gap between growth percentages |
Did borrowers perform better? | Matched loan-loss and portfolio series | A smaller total provision alone |
This is an accounting reading method, not a forecast or a bank-quality score. It will help you find an omitted line. It cannot tell you which stock offers the best return.
Label the adjustment before doing the comparison
JPMorgan reported EPS of $7.70. Its release attributes $1.27 to a Visa gain and $0.29 to equity-investment gains, leaving $6.14 excluding those significant items. Keep that company-defined adjustment beside the reported figure; do not quietly replace one with the other. JPMorgan earnings release.
An exclusion is not a certificate of recurring earnings. Trading conditions, credit costs and taxes still affect the remainder. The JPMorgan analysis follows that narrower question. Here, we will use unadjusted consolidated income-statement amounts for BAC and Citi, without claiming the two businesses are fully normalized or identical.
Copy the same columns, then subtract
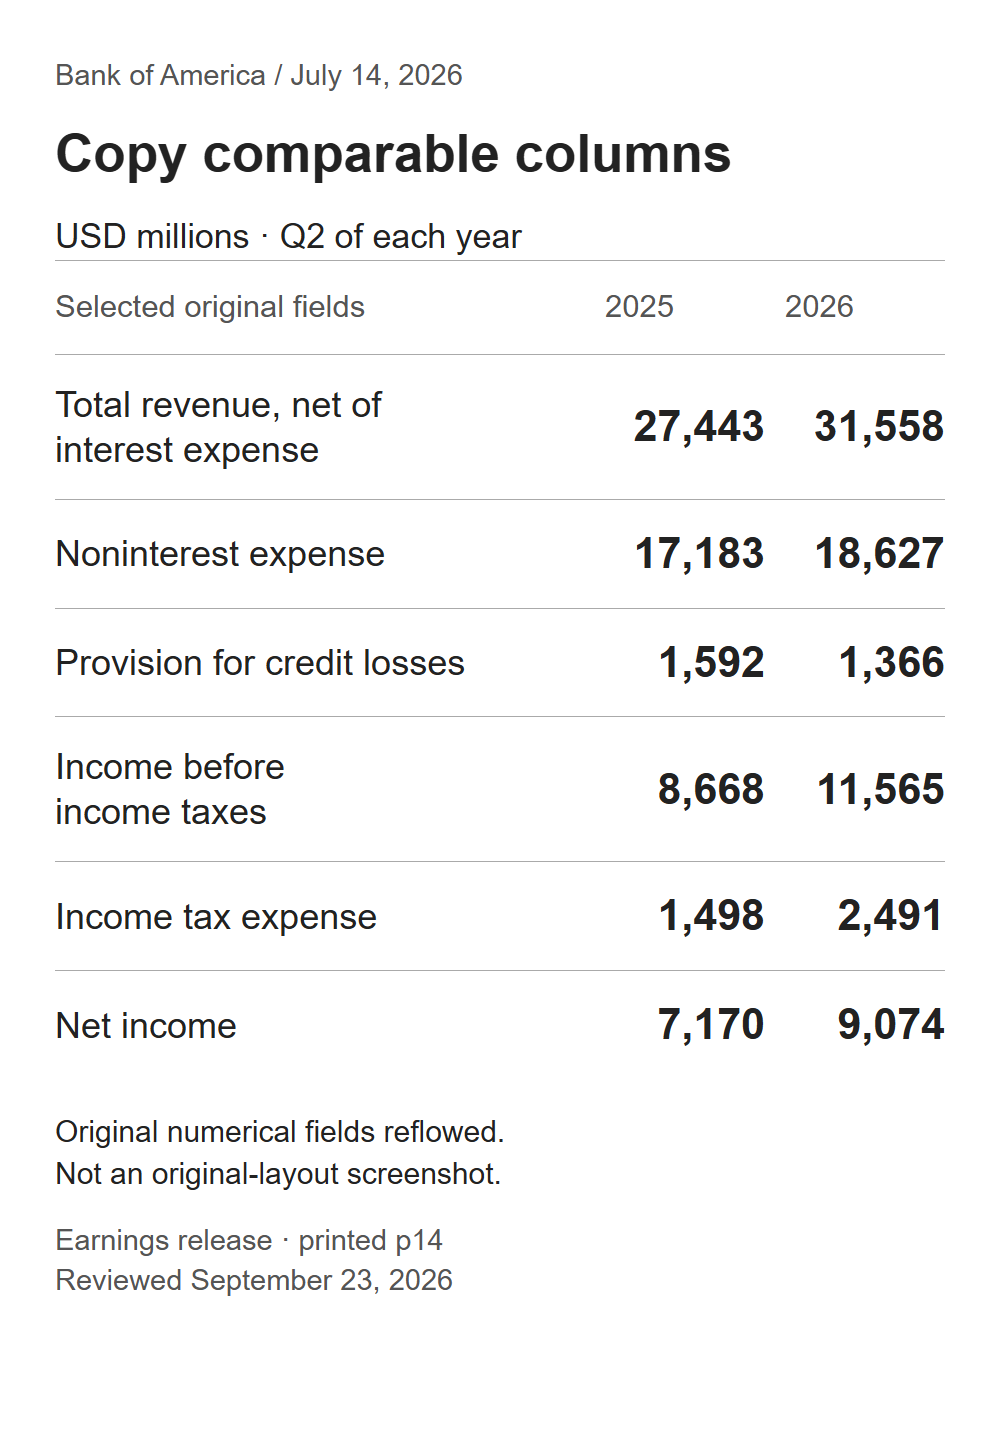
Source evidence: BAC earnings release, printed page 14, published 2026-07-14, reviewed 2026-09-23. Selected original GAAP numerical fields reflowed for readability; not an original-layout screenshot. Q2 2026 versus Q2 2025; USD millions.
The revenue line is already net of interest expense. Do not deduct that expense again. Noninterest expense and provision remain separate deductions. Use the same quarter in both columns, rather than mixing a quarterly amount with a year-to-date total.
At BAC, subtracting the expense increase from the revenue increase leaves $2,671M before the change in provision. Repeating the calculation for Citi leaves $2,460M. These are changes in dollars, not margins, and neither amount is yet the change in net income.
Now ask the percentage question. Divide each bank's revenue increase by its own prior-year revenue; divide the expense increase by its own prior-year expense; subtract the resulting growth rates. The gap is 6.59 percentage points for BAC and 9.60 percentage points for Citi.
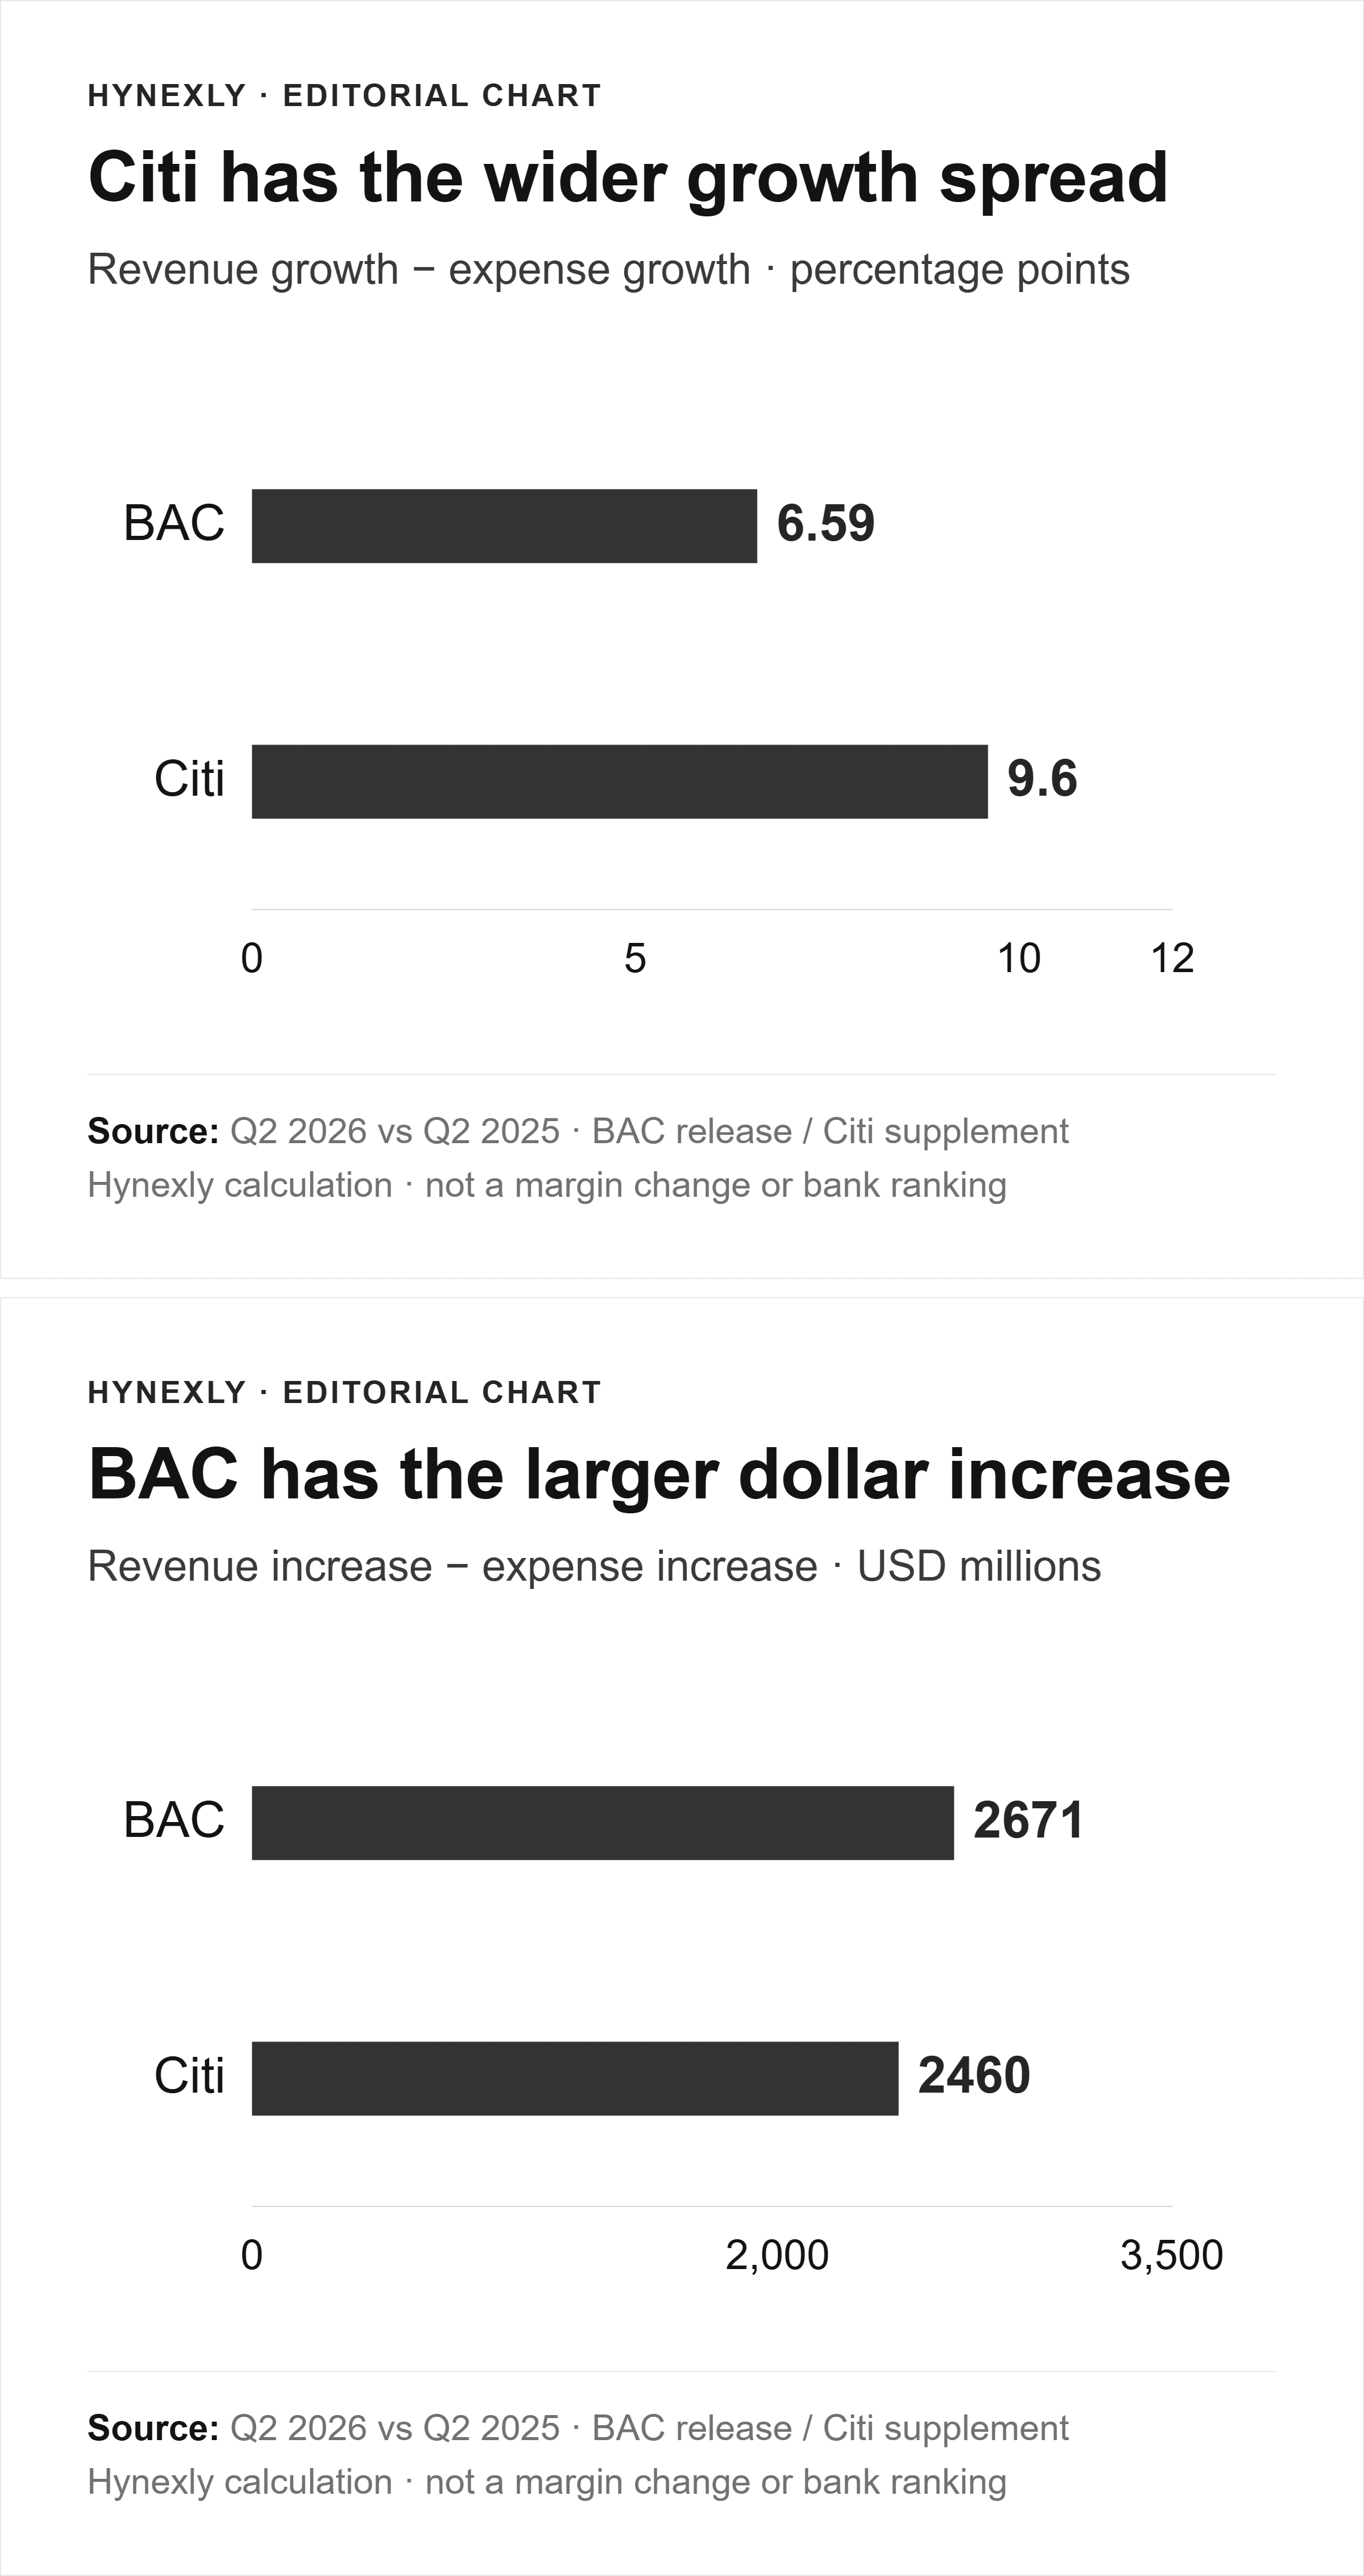
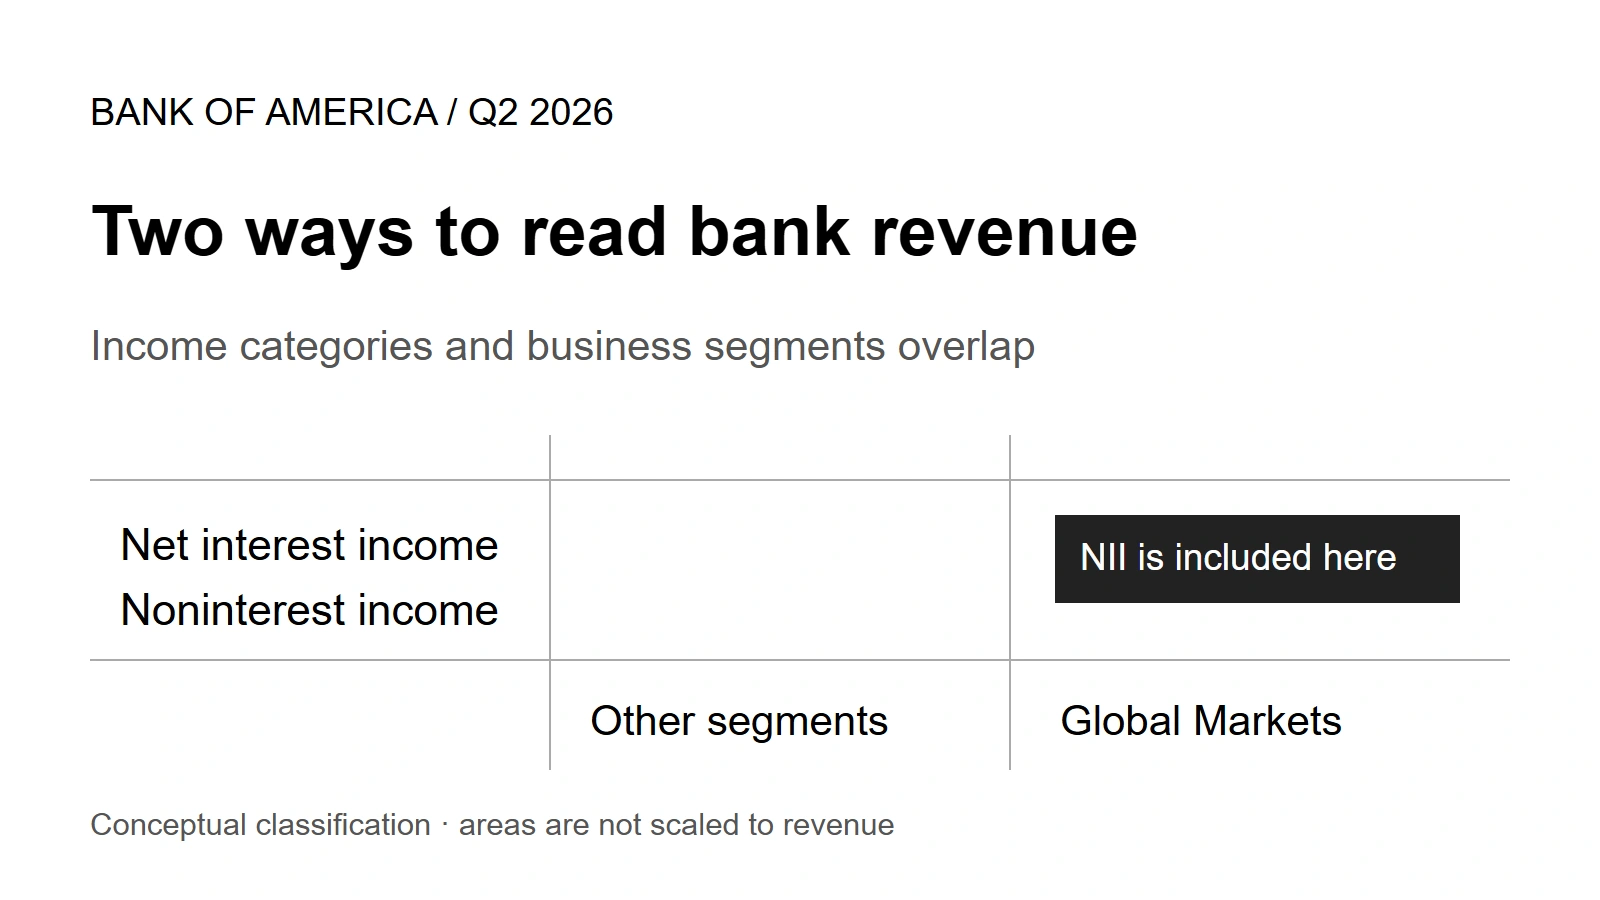
Citi leads on the growth-rate gap because that calculation uses different starting bases. BAC leads on added dollars before provisions. There is no contradiction to resolve by choosing a favorite metric. Write down the question first. The BAC revenue guide also explains why income categories and business segments must not be added as if they were independent revenue streams.
Do not stop at pretax profit
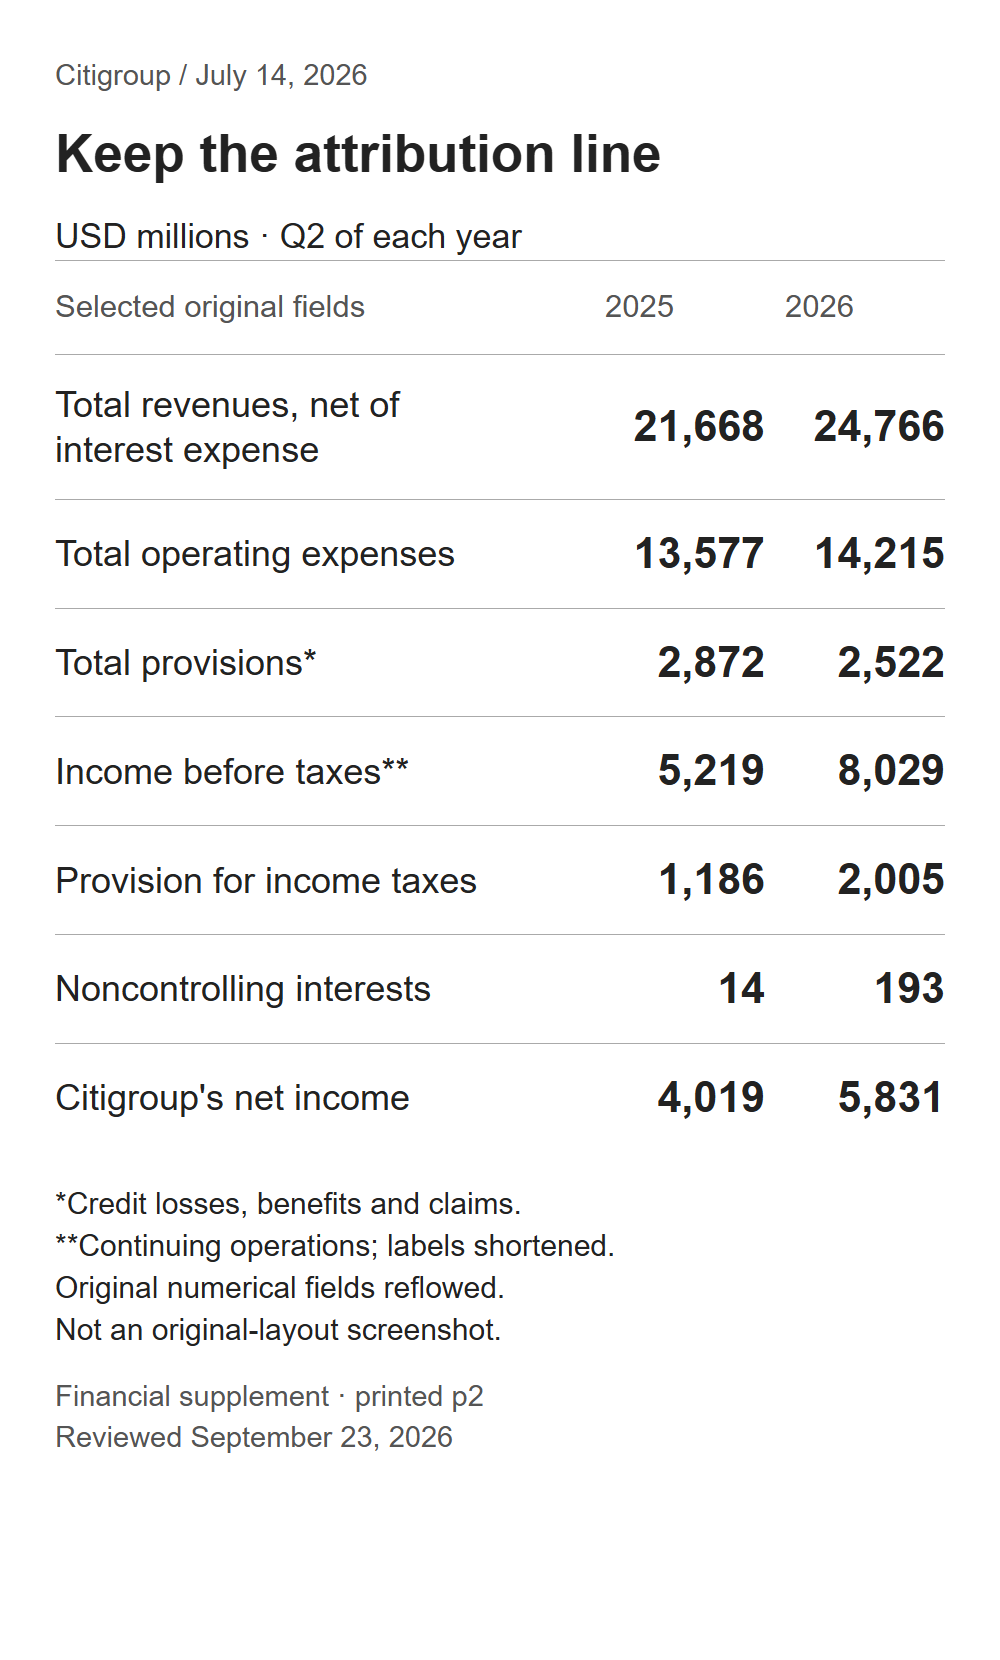
Source evidence: Citi financial supplement, printed page 2, published 2026-07-14, reviewed 2026-09-23. Selected original numerical fields reflowed, not an original-layout screenshot. Q2 2026 versus Q2 2025; USD millions. Total provision includes credit losses, benefits and claims.
The following bridge uses changes, not the full expense balances. A positive sign adds to the year-over-year profit increase; a negative sign reduces it. Each subtotal replaces the rows above it rather than adding to them.
| Change in USD millions | BAC | Citi |
|---|---|---|
Revenue increase | +4,115 | +3,098 |
Less operating-expense increase | −1,444 | −638 |
Before provision: subtotal | +2,671 | +2,460 |
Benefit from lower total provision | +226 | +350 |
Pretax-income increase: subtotal | +2,897 | +2,810 |
Less tax-expense increase | −993 | −819 |
Less increase attributable to noncontrolling interests | Not a separate line in this bridge | −179 |
Net-income increase: result | +1,904 | +1,812 |
Derived reconciliation: current quarter minus the same prior-year quarter, using the source fields above. The final row agrees with each company's net-income change. This bridge does not reconcile earnings available to common shareholders or EPS.
Citi's attribution line is easy to skip. It represents profit belonging to minority owners in consolidated subsidiaries, not another operating expense. Omitting it leaves a result that does not match Citigroup's net income.
EPS needs another reconciliation: earnings available to common shareholders and the applicable weighted-average share count. Dividing this bridge's net income by period-end shares would not reproduce that calculation. Keep the finish line explicit.
A smaller provision can hide a different credit story
Citi's total provision fell $350M, but its realized loan net credit losses rose $170M and its loan provision rose $126M. The total and the loan-only lines cover different things. The Citi credit breakdown follows those components; a favorable total alone does not establish healthier borrowers.
Nor can you rank JPMorgan's 3.34% Card Services net charge-off rate against BAC's 0.47% consolidated ratio. One describes cards; the other covers a broader loan book. Compare a consistently defined portfolio with its own history before making a credit judgment.
The profit bridge also leaves capital needs, business mix and future investment unresolved. A bank can improve short-term conversion while postponing necessary spending. A larger dollar increase may reflect size; a wider growth gap may reflect an easier starting point. Neither settles valuation. For the related amount-versus-share distinction, see the Goldman revenue analysis.
Leave a worksheet for the next filing
| Copy into your notes | Check before drawing a conclusion |
|---|---|
Matching income-statement periods | Same units and accounting basis; no missing attribution line |
Reported and adjusted results | Which items changed, and what the adjustment still leaves exposed |
Dollar bridge and growth-rate gap | Different questions, clearly labeled denominators |
Loan losses, provision and capital | Matching portfolios; enough capital and spending to support growth |
The published calendars list JPMorgan and Citi for 2026-10-13 and BAC for 2026-10-14; dates can change. Rebuild the worksheet when the releases arrive. A restatement, an omitted line or a changed definition requires revising the calculation, not defending the previous ranking.
The useful habit is simple: do not stop until the arithmetic reaches the profit line you actually meant to explain.
Sources and calculation notes
Primary releases were rechecked on 2026-09-23. The worked comparison uses Q2 2026 and Q2 2025 consolidated amounts. Growth gaps use unrounded input values and are rounded only at the end. They are not changes in profit margin. This method is not a backtested prediction of earnings or share returns.
Source calendar links: JPMorgan, Bank of America, Citi. Filing links beside the evidence panels allow readers to inspect the original context.
AI assisted with research organization, deterministic visuals and bilingual checks. Hynexly's owner-operated desk retains editorial responsibility. This is general information, not individualized investment advice.
Frequently Asked Questions
Copy matching income-statement periods, label any company adjustments, and reconcile changes from revenue to net income before interpreting ratios.
No. It is a percentage-point gap between growth rates with different prior-year denominators, not a change in margin.
Not necessarily. Provision expense and realized net credit losses are different measures, and a total provision may contain more than loans.
Primary references cited or linked in this analysis. Click through to read each source in full.
Choose the next evidence gap to investigate.
Bank of America: How Much Growth Survives Quieter Markets?
BAC's Q2 growth was broad, but Global Markets also supplied nearly half the NII increase. Separate overlapping revenue measures, costs and credit before extrapolating.
Owner-operated US market research desk
Owner-operated US stock and market coverage built from public filings, SEC EDGAR, official reports, company releases, and market data.
- Source-grounded research with primary filings & official reports
- Bilingual EN / KO editorial workflow
- Manual editorial QA before publish