Citi: A Smaller Credit Bill, Not Fewer Losses
Citi's Q2 provision fell $350M while loan losses rose $170M. Follow the accounting bridge, the Cards counterexample, and September's updated return outlook.
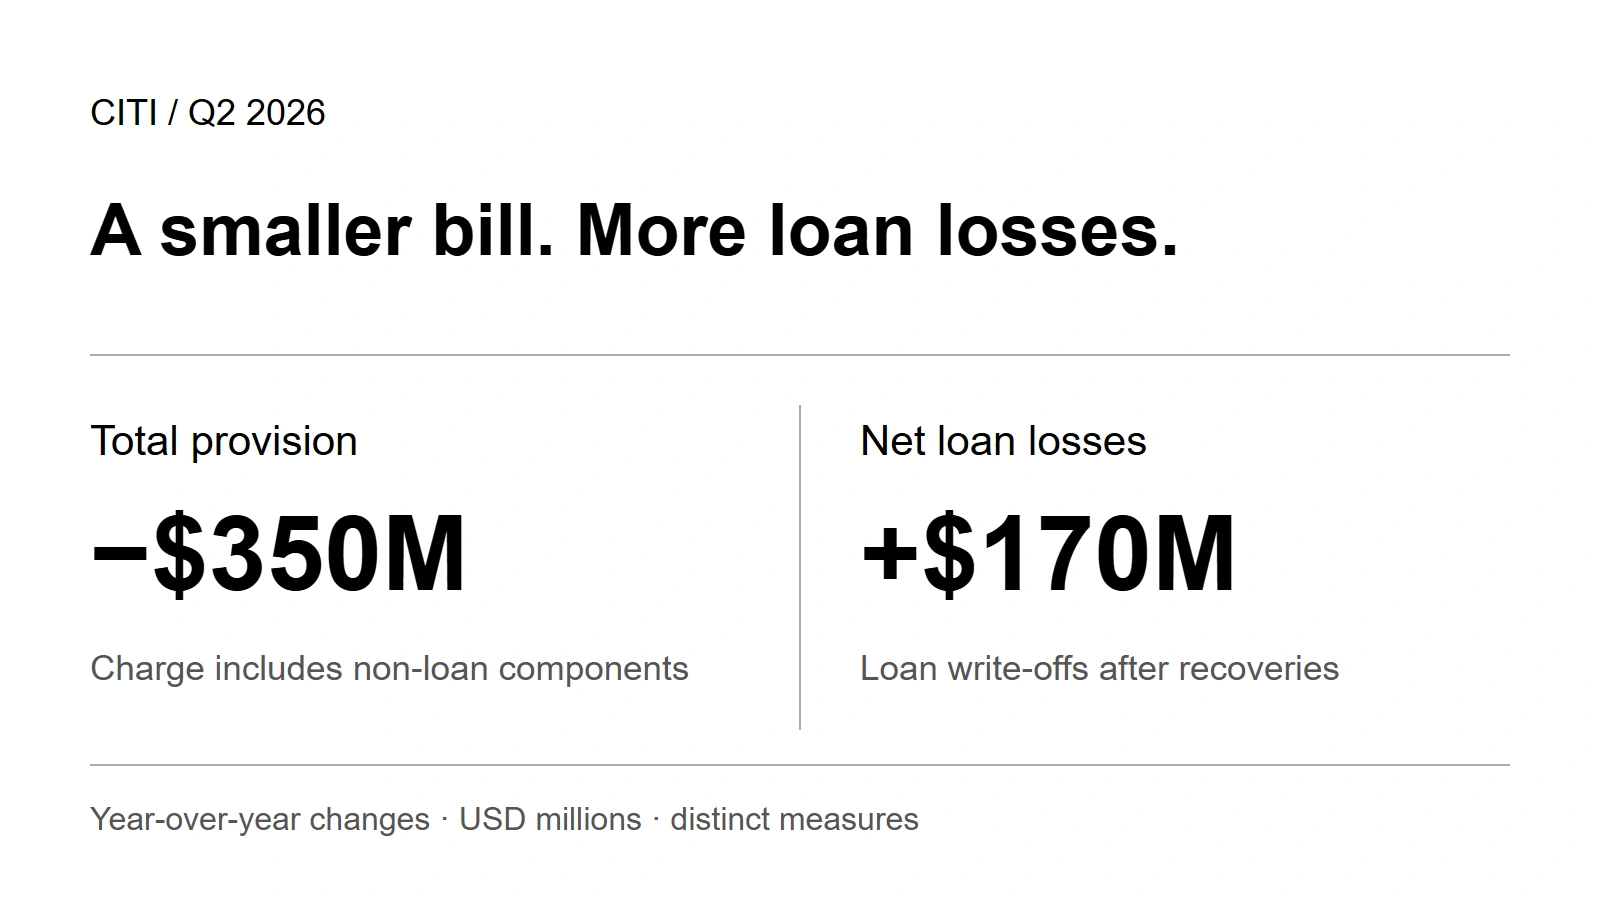
Citi's credit bill fell in Q2. Its loan losses did not. The bank recorded a $350M smaller total provision than a year earlier, even as net loan losses rose $170M.
That does not make the quarter's earnings improvement an accounting illusion. Most of the increase in pretax income came before provisions. It does mean that “lower credit costs” needs a closer look before it becomes “healthier borrowers.”
Start with the charge, not the conclusion
A provision is an income-statement charge. Net credit losses measure loans written off after recoveries. Reserve changes connect the two, while Citi's total also includes provisions for other assets, lending commitments and policyholder benefits and claims. Neither measure can substitute for the other.
The clearest clue is inside the filed income statement: the provision on loans actually increased. The broader total fell because the remaining components moved the other way.
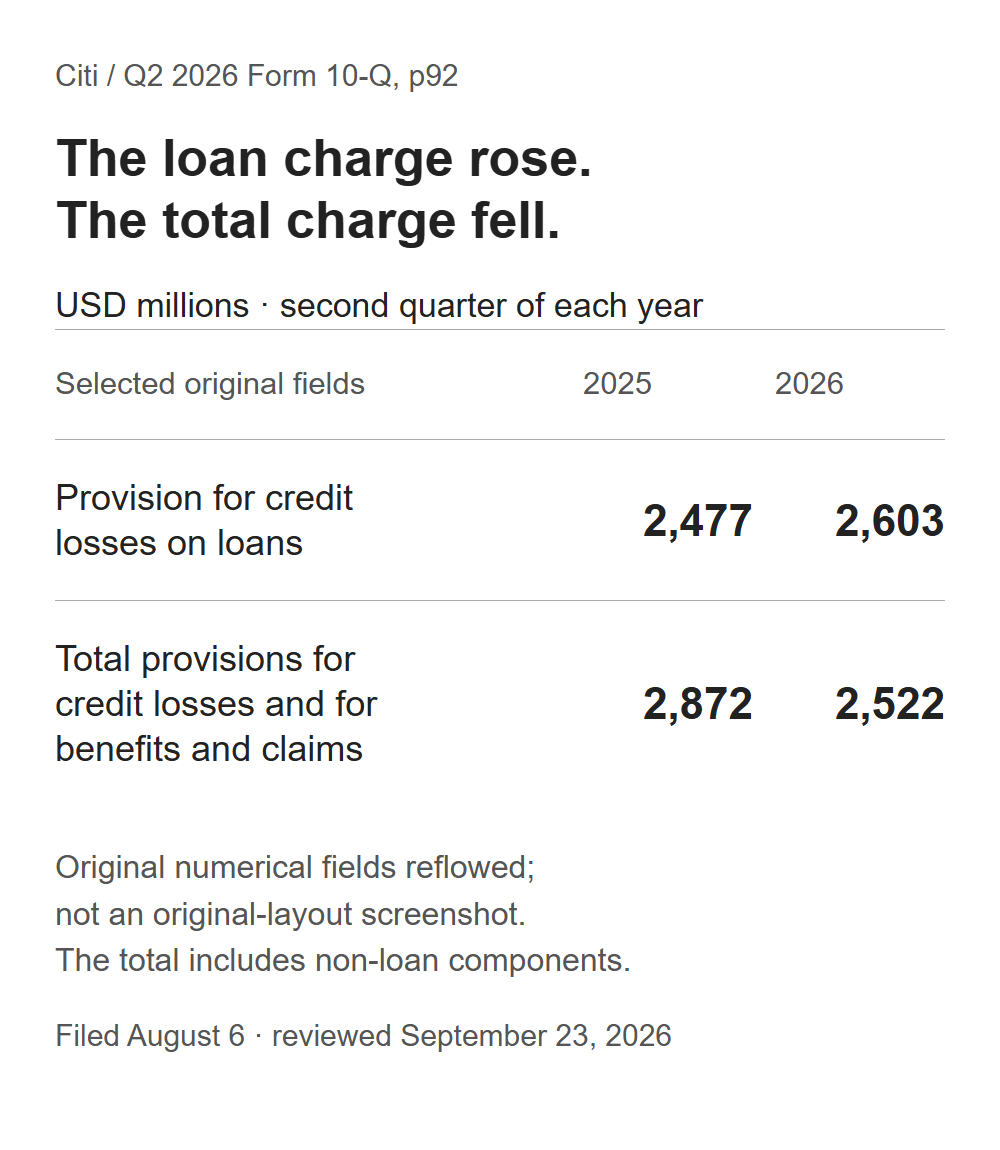
Source evidence: Citi Q2 10-Q, p 92, filed August 6, reviewed September 23. Selected original numerical fields reflowed for readability, not an original-layout screenshot. USD millions; each year's second quarter.
Where the $350M reduction came from
Here is the entire reconciliation, including the small rows. A negative change lowers the charge; it does not mean cash arrived at the bank.
| Provision component | Q2 2025 | Q2 2026 | Change |
|---|---|---|---|
Loans | 2,477 | 2,603 | +126 |
Other assets | 381 | −2 | −383 |
Held-to-maturity debt | 7 | 1 | −6 |
Policyholder benefits and claims | 26 | 17 | −9 |
Unfunded lending commitments | −19 | −97 | −78 |
Total | 2,872 | 2,522 | −350 |
USD millions. Reported fields: 10-Q p 92; changes calculated for this article. Negative reported provisions are releases.
Other assets account for the largest reduction. Looking only at the total would conceal the increase in the loan charge.
That loan charge has its own explanation. Net losses rose from $2,234M to $2,404M. The loan reserve build fell from $243M to $199M, according to the financial supplement, p 2. Higher losses outweighed the smaller build: $170M minus $44M equals the $126M increase. The bank was still adding to loan reserves through this income-statement component; a smaller build is not a release of the whole allowance.
The strongest positive evidence survives
The group did not need the provision reduction to produce a much better operating result. Revenue rose $3,098M while operating expense rose $638M. Subtracting the second increase from the first gives $2,460M of improvement before provisions.
Add the $350M provision benefit and the result is the reported $2,810M increase in pretax income, from $5,219M to $8,029M. The lower charge explains 12.5% of that increase; revenue less expense explains 87.5%.
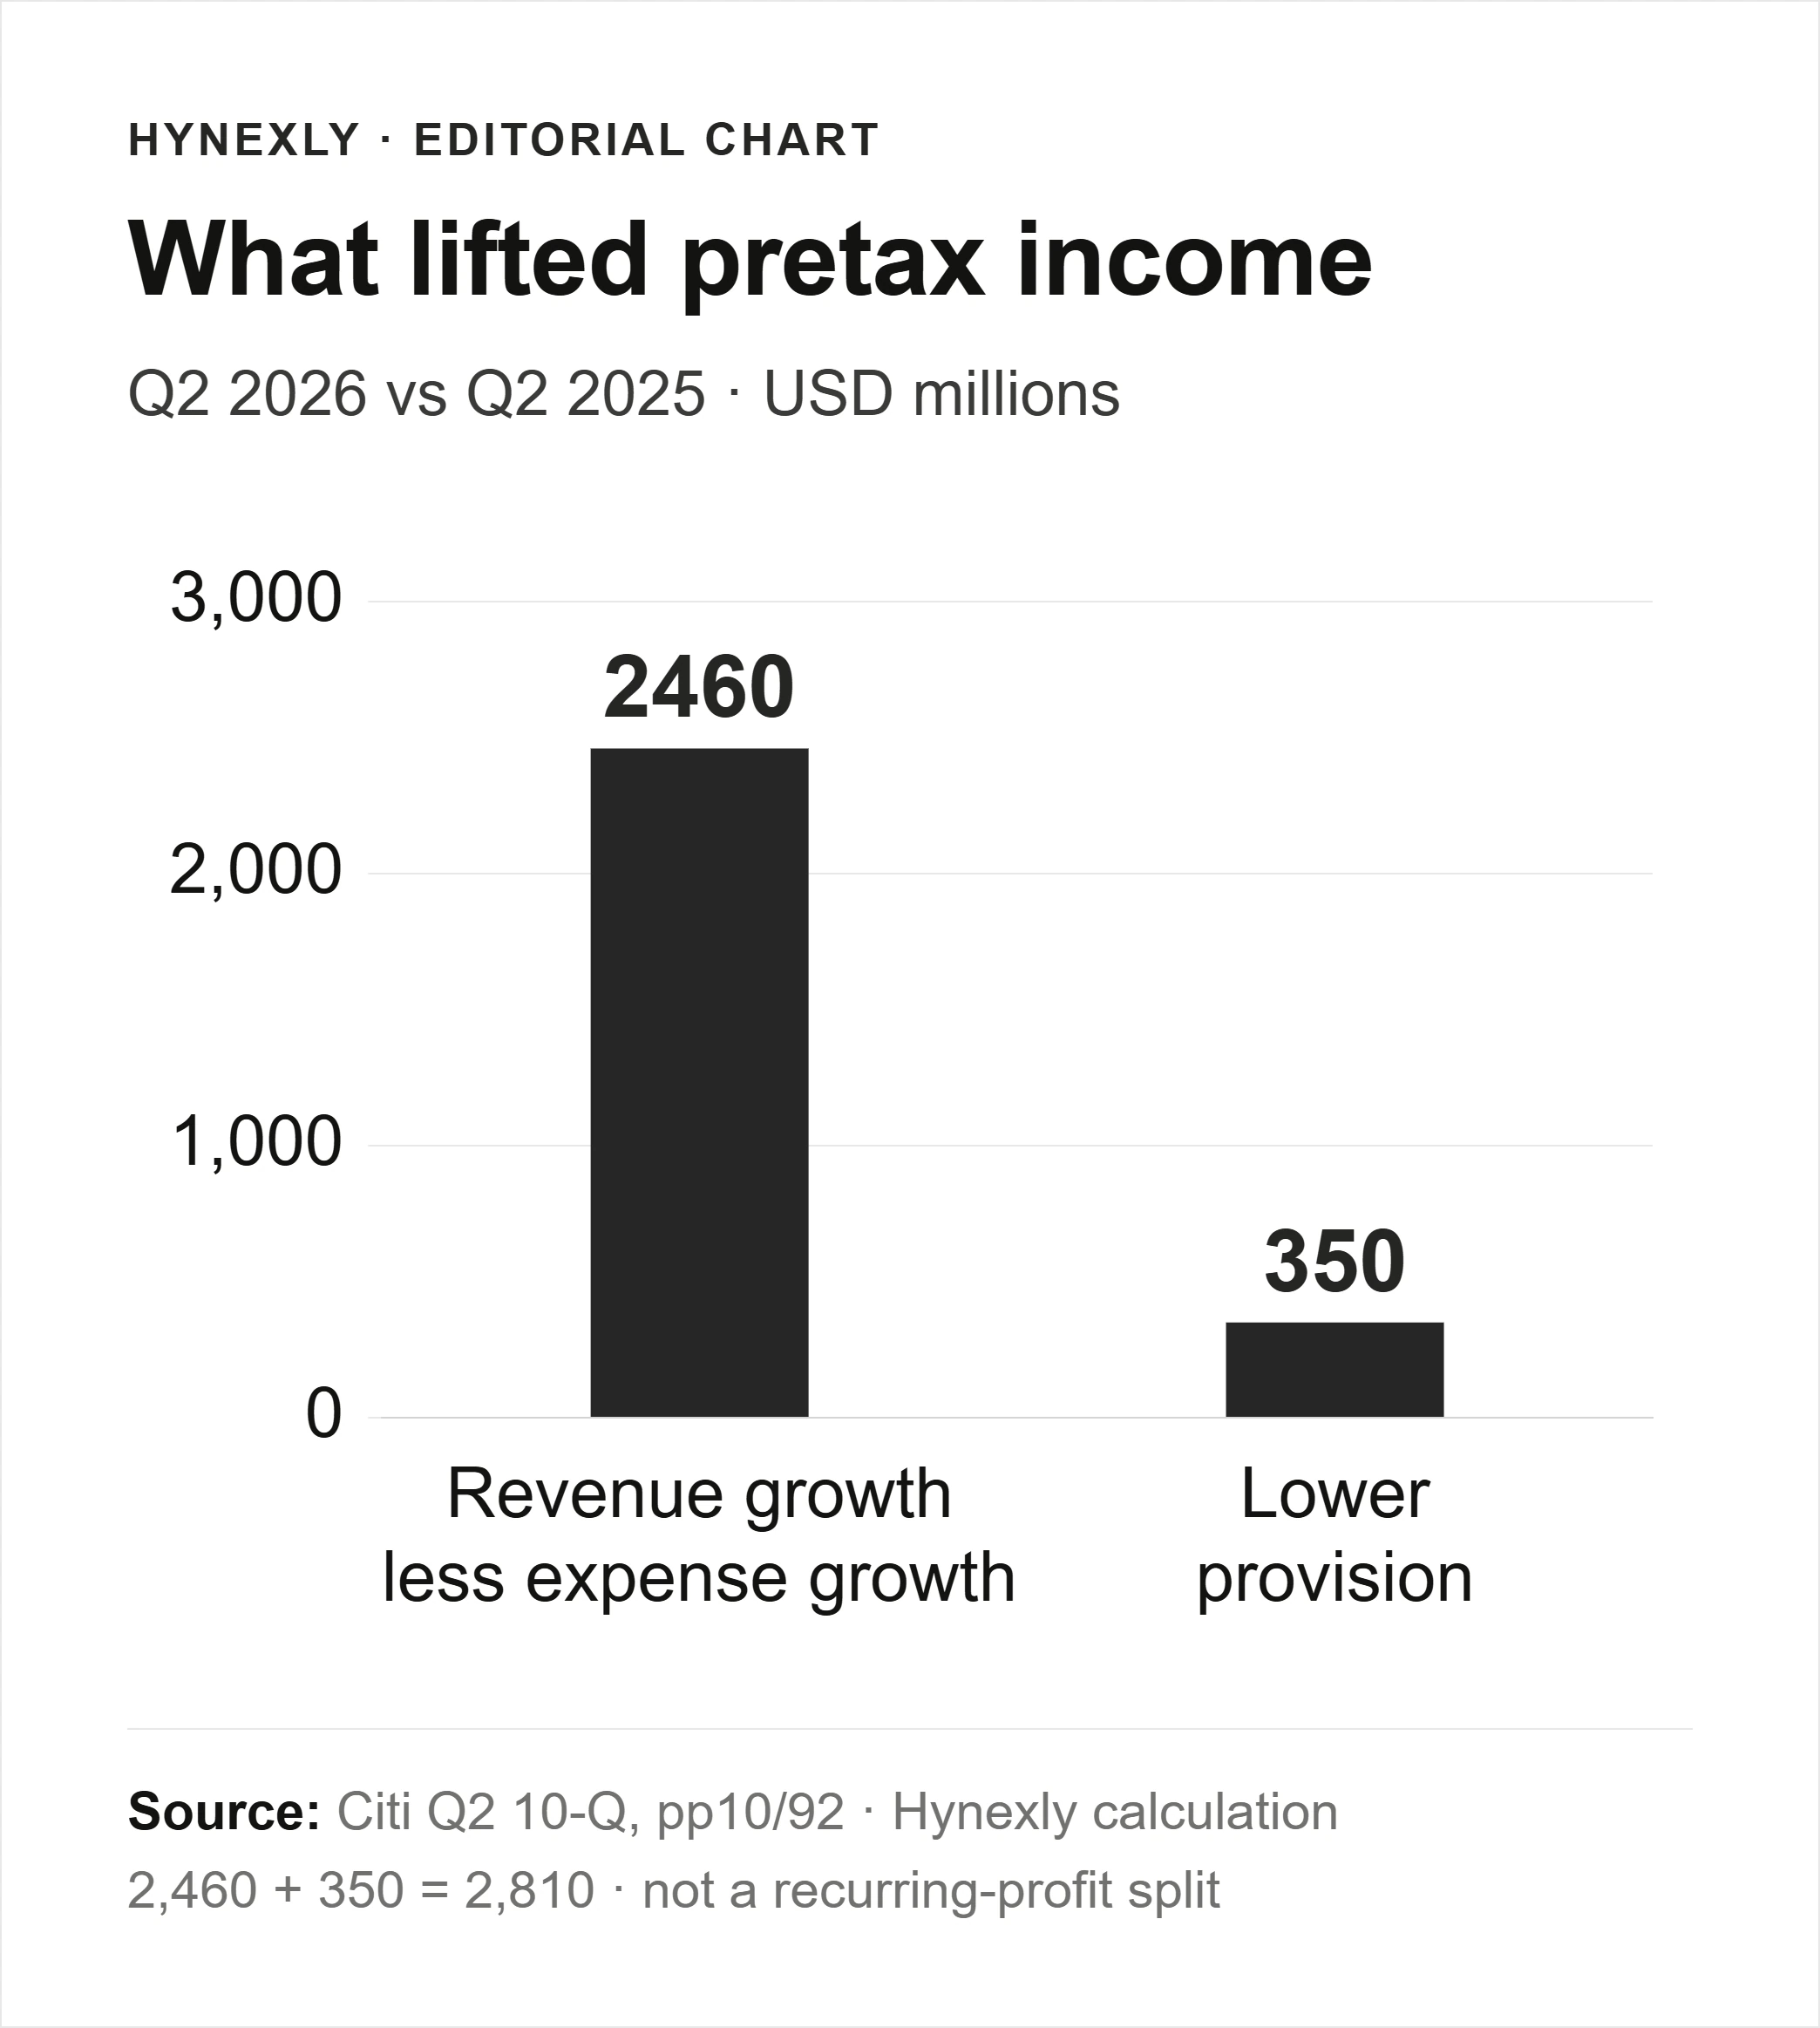
Source-derived calculation: 10-Q pages 10 and 92. Q2 2026 versus Q2 2025, USD millions. Both bars use the same scale. This separates historical contributions; it does not classify 87.5% of growth as recurring.
That is a substantial operating improvement. Calling the quarter nothing but reserve accounting would miss it. Calling all of it durable would go too far as well: this subtraction does not remove trading conditions, currency effects or other changes in revenue mix.
Cards gives a different answer
U.S. Consumer Cards is where the group-level conclusion stops being a safe shortcut. Its revenue increased just $50M while expense rose $168M. Earnings before provisions therefore fell $118M.
Yet pretax income rose $116M. A $234M reduction in the provision more than covered the operating decline.
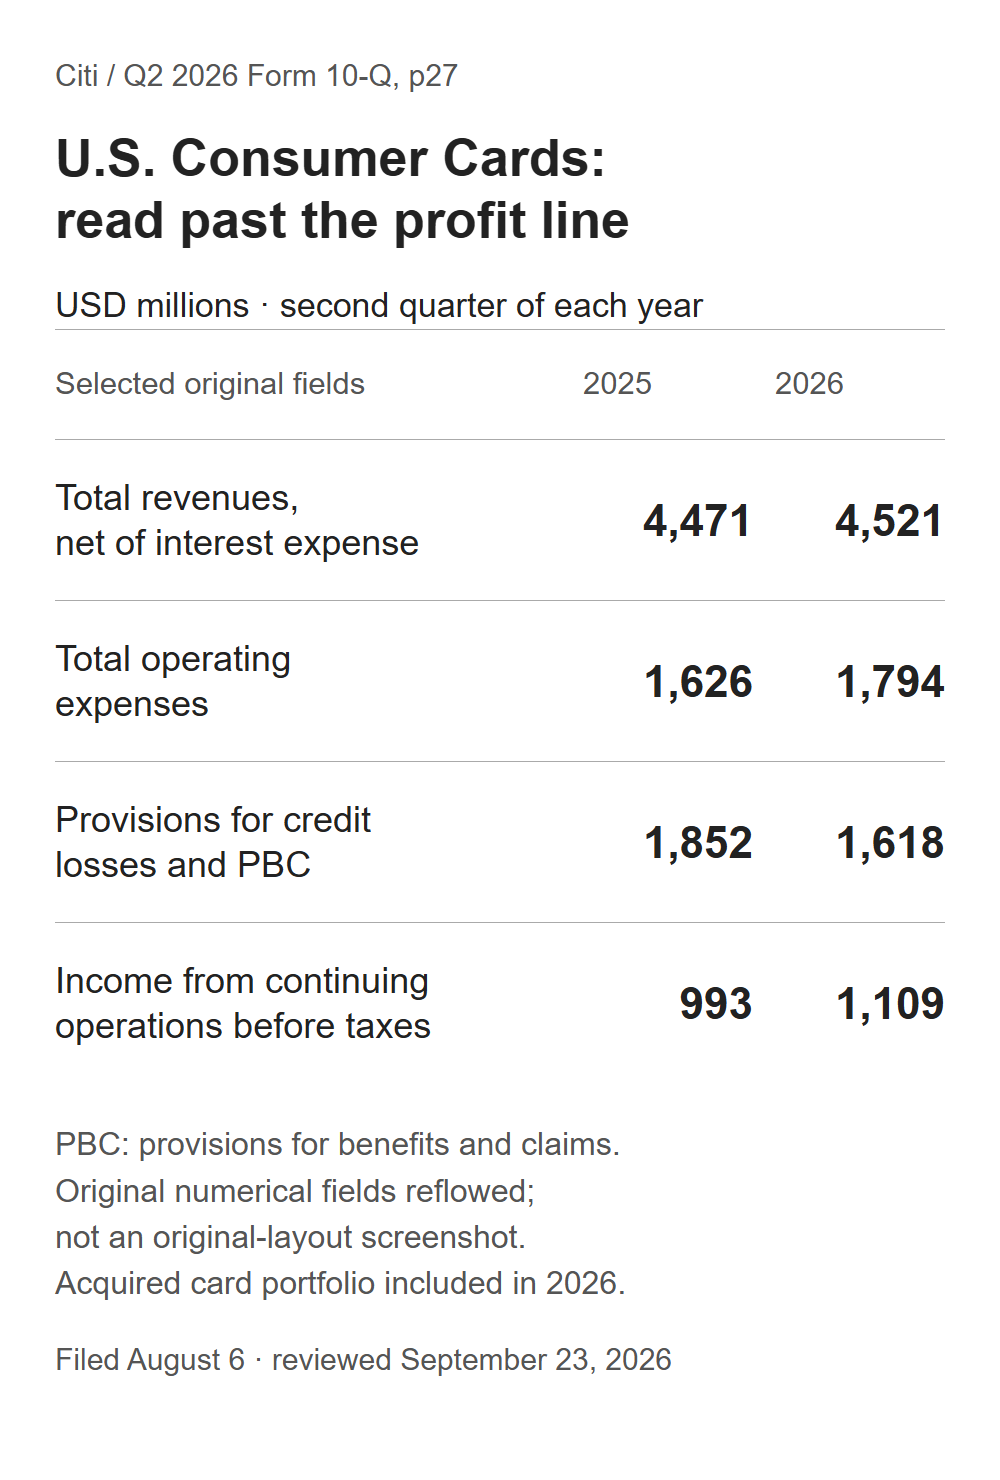
Source evidence: 10-Q p 27. Selected numerical fields reflowed, not an original-layout screenshot. USD millions. The current quarter includes the acquired American Airlines card portfolio; this is not an unchanged-book comparison.
Even here, falling provisions do not show a large fall in realized losses. Cards net losses were essentially flat: $1,850M versus $1,856M. Citi attributes the net reserve release to portfolio-quality improvements, including seasonality, offset by volume and macroeconomic changes.
There is also an acquisition detail worth keeping beside the numbers. The Cards table shows a $40M loan reserve build and a $272M release against unfunded commitments, giving a net $232M release. But footnote 3 on p 28 says a reserve established for the pending portfolio purchase was moved when the deal closed.
| When | Where the reserve sat | How to read it |
|---|---|---|
Q1, before completion | Forward purchase commitment | A provision attached to the purchase obligation |
Q2, after completion | Released from the commitment and re-established on acquired loans | A transfer between categories, not a free profit gain equal to the commitment release |
Source: 10-Q p 28, footnote 3. This explains the accounting movement, not every driver of the net reserve change.
So the sensible caution is narrower than “Citi's credit is deteriorating.” Group losses rose, with Banking and Legacy Franchises driving the increase, while Cards losses barely changed. The question is whether underlying earnings can keep absorbing costs without relying on the same provision benefit again.
The return outlook has already moved
The old 10–11% full-year RoTCE range should not be presented as today's latest guidance. The September conference updated it.
| Information date | Full-year 2026 RoTCE outlook |
|---|---|
July 14 earnings presentation | 10–11% |
September 14 CFO remarks | Likely somewhat above 11% |
Sources: July presentation, slide 20 and September transcript, p 2. RoTCE is return on tangible common equity, a non-GAAP measure. Both rows are management outlooks, not achieved full-year results.
The CFO also described consumer credit as stable at that conference. That is useful counterevidence to an overly gloomy reading of Q2, although it remains management's assessment before the next results.
No current share-price valuation or independently checked analyst consensus is established here. A higher company outlook does not tell us whether the stock is cheap, or how much optimism investors already pay for. It raises a business-performance question: can the improved return survive a less helpful provision comparison?
What would change the judgment in October?
Citi currently schedules its next results for October 13, 2026. Read the same components again rather than asking only whether earnings per share beat a headline estimate.
| Next check | Strengthens the operating case | Weakens it |
|---|---|---|
Revenue less expense | Improvement continues before provisions | Costs catch revenue while provision benefits fade |
Credit composition | Losses and new reserve needs remain manageable together | Both rise enough to absorb the operating gain |
Cards | Revenue begins to cover higher operating costs | Profit depends again on a lower charge while operating earnings fall |
These are comparisons to make, not invented numerical trigger points. A single adverse reserve movement can be prudent risk recognition; it is the combination with operating earnings that matters.
For another bank-reading trap, the Bank of America analysis separates an income category from the business segment that earns it. The Goldman Sachs return analysis asks how much a strong quarter depends on its business mix.
Citi earned a better quarter. The smaller credit bill helps explain it, but it cannot do the job of a full credit assessment.
Sources and calculation notes
The historical bridge uses GAAP figures from Citi's August 6 filing, checked against its July 14 supplement. Revenue is net of interest expense. “Before provisions” means this article's subtraction of revenue and operating expense, not a company-defined adjusted profit measure. The five provision components are mutually exclusive; their changes sum to the total.
Sources and calculations were reviewed September 23, 2026. The September outlook is kept separate from Q2 actuals. AI assisted with research organization, drafting, translation and visual production; Hynexly retains editorial responsibility. This is general information, not personalized investment advice, a rating or a price target.
Frequently Asked Questions
A $383M reduction in the other-assets provision, plus smaller changes in other components, more than offset a $126M increase in the loan provision. The total charge declined $350M.
No. Group net credit losses on loans rose from $2,234M to $2,404M. U.S. Consumer Cards losses were essentially flat at $1,850M versus $1,856M.
That was the July full-year 2026 RoTCE guidance. On September 14, the CFO said the full-year result was likely to be somewhat above 11%. This is a forward-looking non-GAAP outlook, not a completed result.
Primary references cited or linked in this analysis. Click through to read each source in full.
Choose the next evidence gap to investigate.
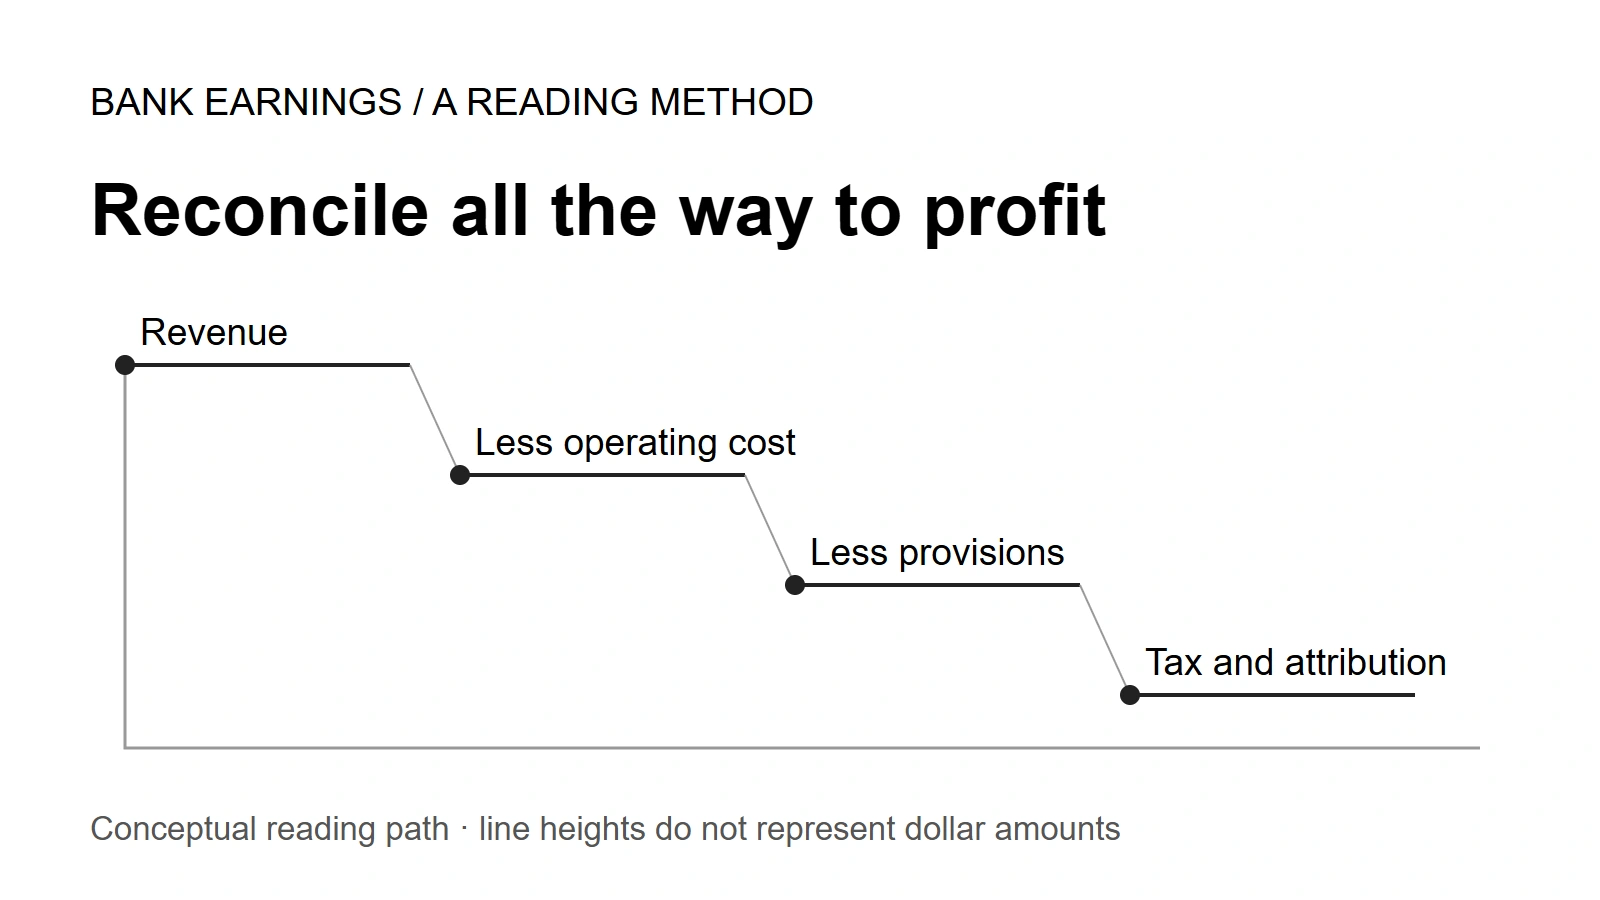
Bank Earnings: When Two Correct Calculations Disagree
Read bank earnings from revenue to net income. A BAC–Citi worked example separates growth rates, profit dollars, provisions and the attribution line.
Owner-operated US market research desk
Owner-operated US stock and market coverage built from public filings, SEC EDGAR, official reports, company releases, and market data.
- Source-grounded research with primary filings & official reports
- Bilingual EN / KO editorial workflow
- Manual editorial QA before publish