Bank of America: How Much Growth Survives Quieter Markets?
BAC's Q2 growth was broad, but Global Markets also supplied nearly half the NII increase. Separate overlapping revenue measures, costs and credit before extrapolating.
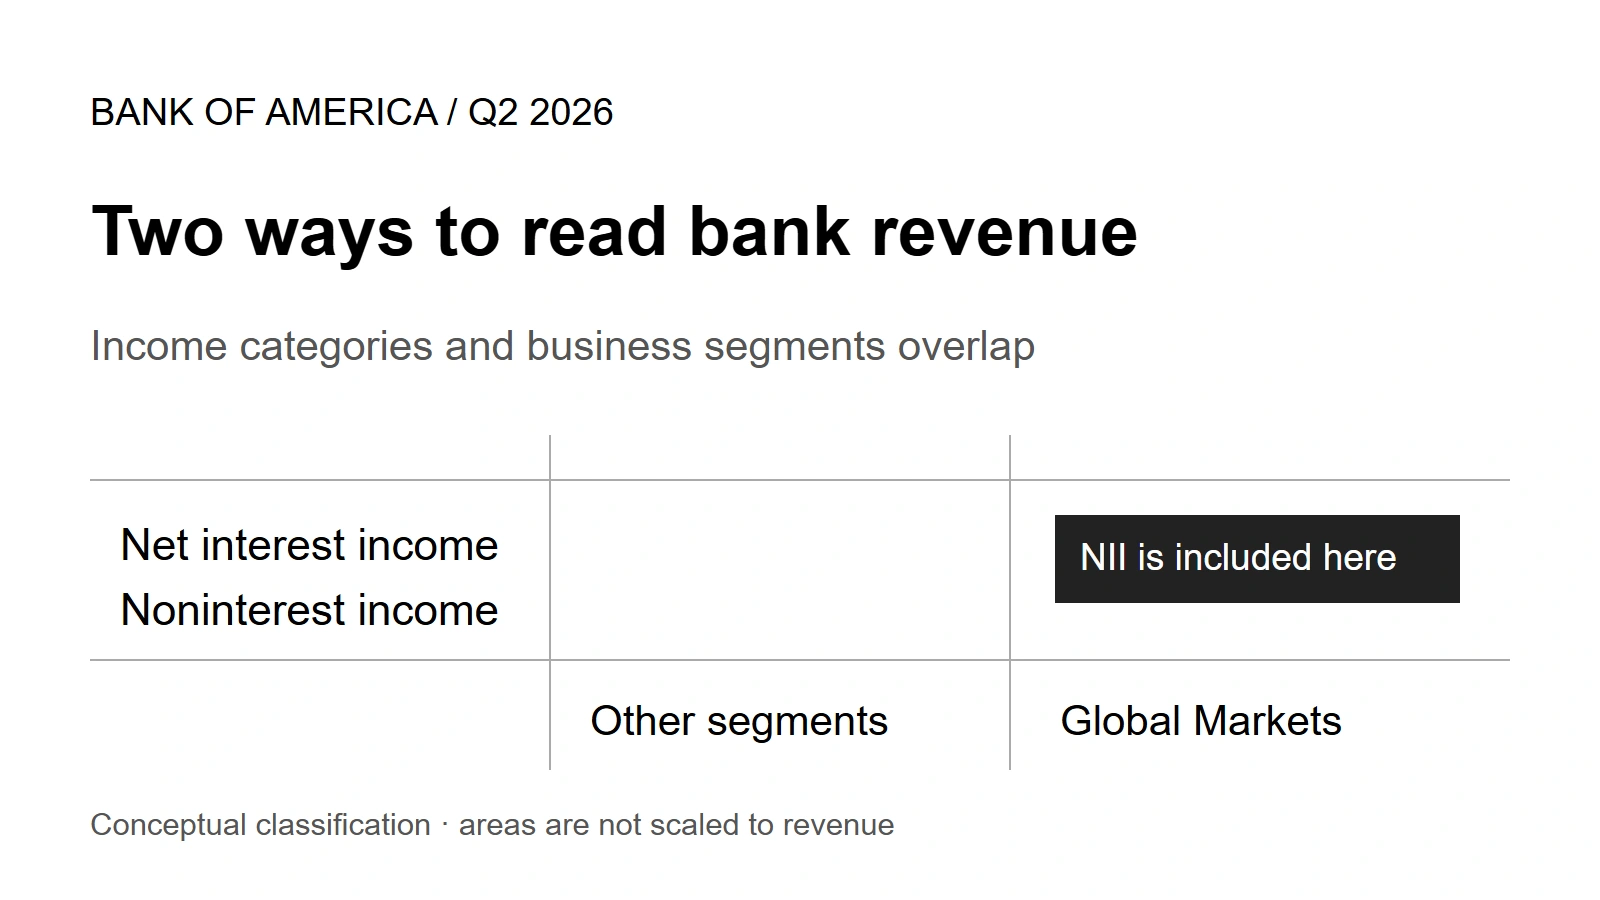
Nearly half of Bank of America’s second-quarter revenue increase came from Global Markets: 49.4% on the bank’s taxable-equivalent segment basis. That does not mean the rest of the bank stood still. It does make the source of growth worth a closer look.
The tempting shortcut is to separate volatile trading from steadier net interest income. The accounts do not divide that neatly. Global Markets earns net interest income too, and its contribution matters to this quarter’s result.
Our reading is cautiously constructive on operating performance, not on the stock’s valuation. Revenue growth converted into higher profit, and other businesses contributed. But “more net interest income” cannot, by itself, establish growth independent of market activity. The useful question for the next report is how each business earned its increase.
Start with the income statement
Bank revenue is reported after interest expense. Net interest income, or NII, is interest earned less interest paid. Noninterest income includes fees and other revenue. These categories describe the type of income; they do not tell us which business produced it.
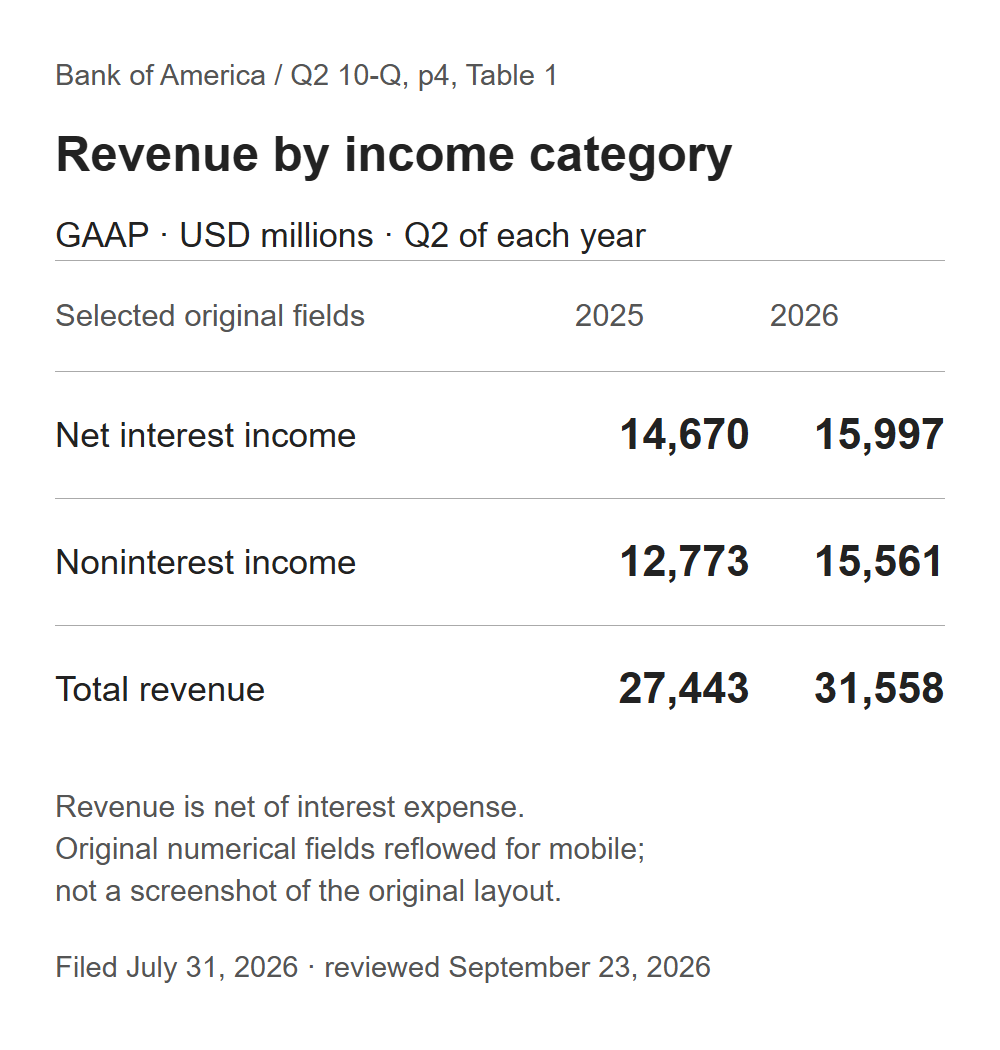
Source evidence: Q2 10-Q, printed page 4. Original numerical fields reflowed for mobile reading, not a screenshot of the original layout.
Subtracting the earlier quarter’s reported revenue from the later one gives $4,115M of growth. That is a substantial improvement. Before labeling it repeatable, though, we need to switch from income categories to business segments.
Which businesses contributed?
The segment accounts use fully taxable-equivalent, or FTE, figures. This non-GAAP adjustment makes income from tax-exempt securities more comparable with taxable income. It does not represent extra cash received.
The FTE adjustment was $163M in the current quarter and $145M a year earlier. That $18M difference explains why segment revenue growth is $4,133M rather than the GAAP increase above. Keep the denominator consistent.
| FTE revenue increase, year over year | USD millions |
|---|---|
Consumer Banking | +523 |
Global Wealth & Investment Management | +934 |
Global Banking | +547 |
Global Markets | +2,040 |
All Other | +89 |
Total | +4,133 |
Calculation from the 10-Q, printed page 96, Note 17. All Other’s negative revenue became less negative. Global Markets is broader than sales and trading alone.
Every operating segment contributed positive revenue growth. That is the strongest objection to calling this merely a trading quarter. Consumer banking, wealth management and business banking all helped.
Yet revenue outside Markets is not automatically recurring revenue. Wealth fees can move with asset values; business-banking activity can vary with financing demand. The table measures where growth occurred. Persistence still needs to be demonstrated.
NII and Markets are not separate buckets
Here is the overlap that the headline categories conceal.
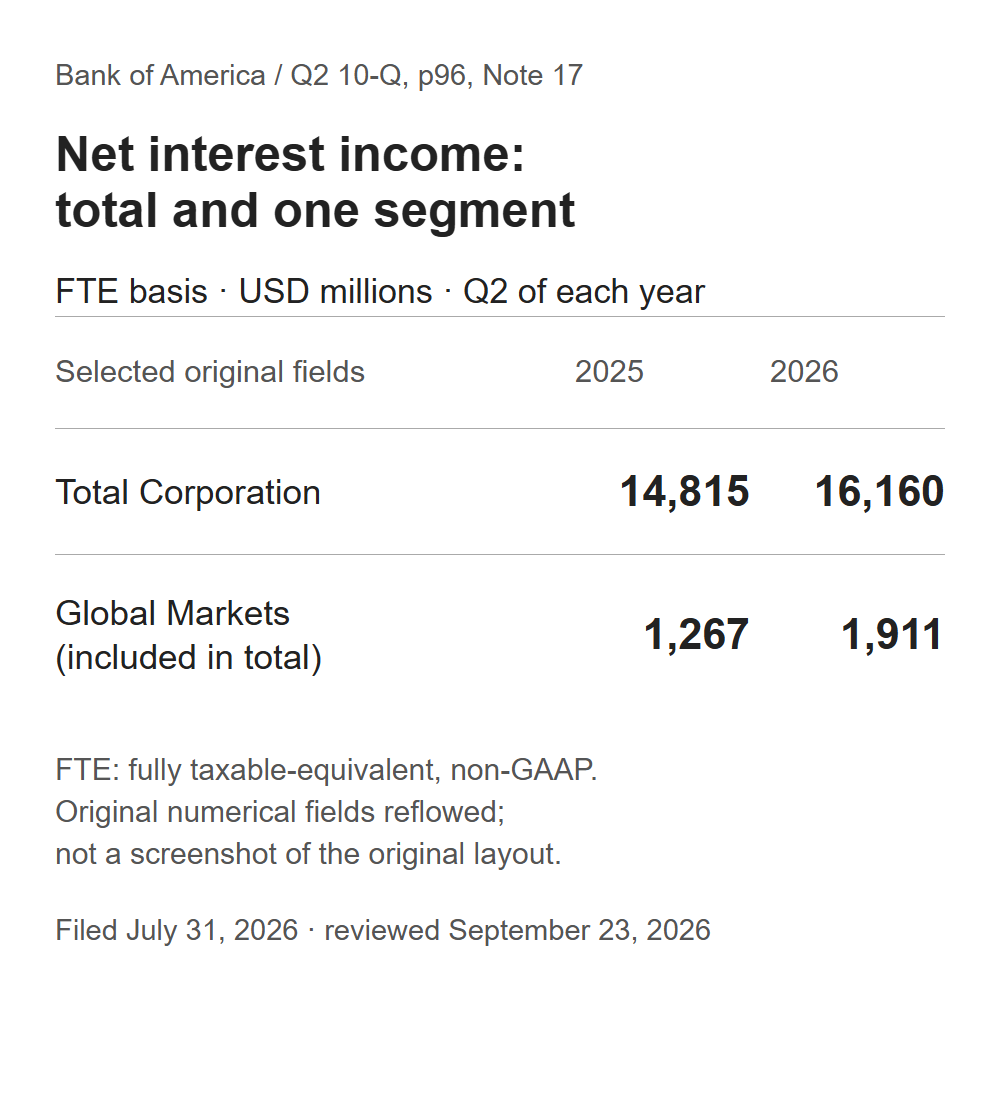
Source evidence: 10-Q, printed page 96. Selected original numerical fields, reflowed. The segment row is included in the consolidated row.
On this consistent FTE basis, total NII increased $1,345M. Global Markets supplied $644M of that increase. The remaining operations together supplied $701M. In other words, 47.9% of NII growth came from the same segment already driving much of revenue growth.
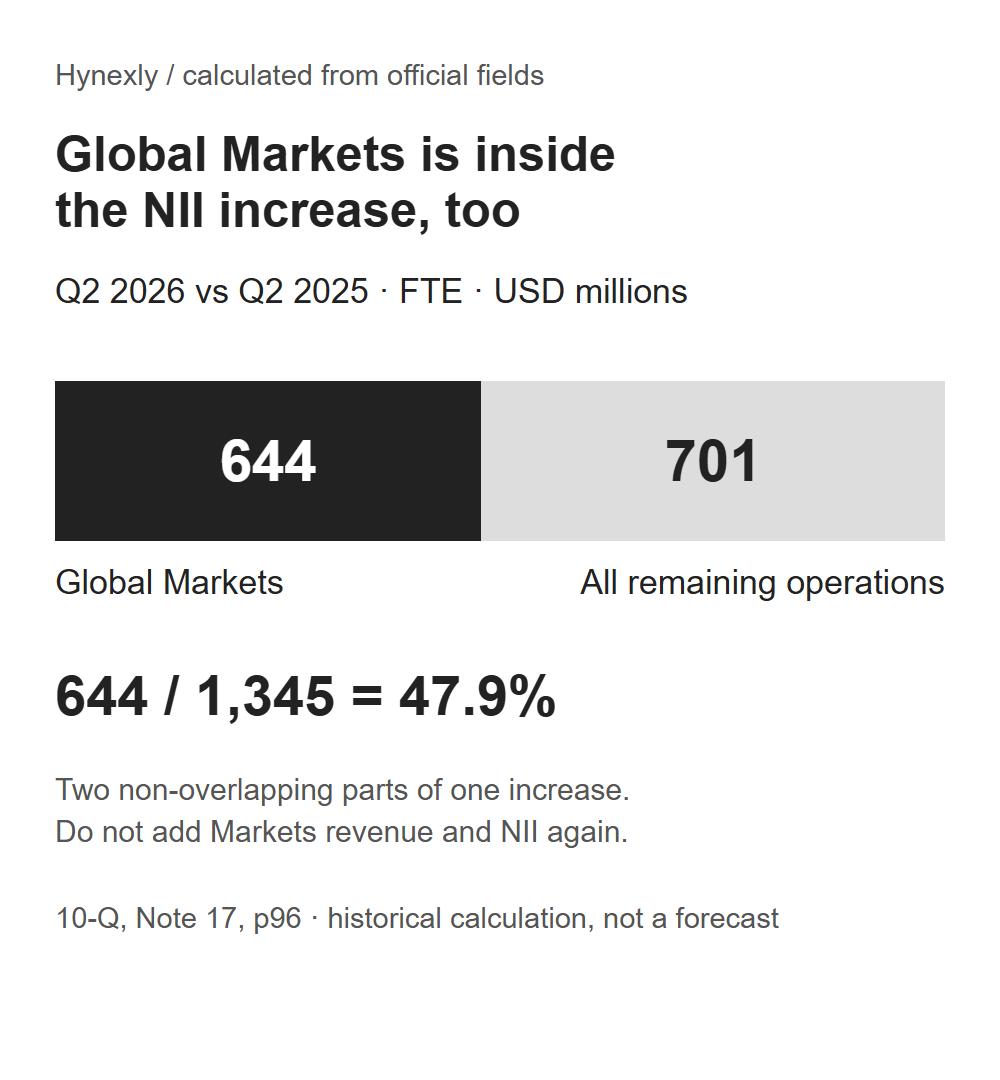
Hynexly calculation from the same filing. The bar shows mutually exclusive parts of one increase; it is not a forecast.
This does not make the income less real. It changes what can be inferred from it. Adding NII growth to Markets growth would count some revenue twice. Treating all NII as an independent, steady banking contribution would also overstate what the classification tells us.
The bank itself identifies Global Markets activity among the drivers of NII growth, alongside loan and deposit growth and fixed-asset repricing, partly offset by lower interest rates. Those are management’s explanations, not a published dollar-by-dollar attribution of the entire increase.
How much growth reached profit?
There is a separate reason to take the quarter seriously: costs did not consume all the additional revenue. On the consolidated GAAP basis, incremental noninterest expense absorbed 35.1% of incremental revenue.
| Change from the prior-year quarter | USD millions |
|---|---|
Higher revenue | +4,115 |
Higher noninterest expense | −1,444 |
Lower provision for credit losses | +226 |
Higher income tax expense | −993 |
Increase in net income | +1,904 |
Hynexly arithmetic using the 10-Q income statement, printed page 4. Signs show each change’s effect on total net income, not income available to common shareholders.
The distinction between operating improvement and credit support matters. Lower provisions helped profit, but explain only part of the increase. Higher revenue still more than covered higher operating expenses before that benefit.
A good conversion quarter is not a fixed cost promise. Compensation linked to revenue may ease when activity slows; spending on people and technology may persist. The next comparison should examine both the revenue base and the cost response, not assume the current incremental margin continues.
Credit improved; future losses remain uncertain
The realized credit figures were favorable.
| Credit measure | Q2 2025 | Q2 2026 |
|---|---|---|
Net charge-offs, USD millions | 1,525 | 1,412 |
Annualized net charge-off ratio | 0.55% | 0.47% |
Provision for credit losses, USD millions | 1,592 | 1,366 |
Source: Q2 supplemental information. Charge-offs record losses; provisions are the period’s expense for expected credit losses. They answer different questions.
Lower charge-offs support the quality of the reported result. They do not certify the future loan book. A change in delinquencies, borrowers’ finances or loan mix could alter the next outcome before a headline ratio makes the deterioration obvious.
Nor is a recent historical range a sensible automatic pass mark. The composition of losses and the assumptions behind provisions deserve attention even when an aggregate ratio looks familiar.
What does this say about the share price?
It supplies an operating test, not a valuation conclusion. This review does not use a current share price, a dated analyst-consensus comparison or an independently estimated required return. It therefore cannot establish whether investors have already paid too much for these earnings.
Markets activity might remain strong, and growth elsewhere might persist. That is a fair favorable case. The weaker case is relying on the same market-sensitive income twice when describing diversified growth. The filing lets us reject that accounting shortcut without pretending to know the next market cycle.
The next useful checkpoint
The issuer’s reporting calendar schedules the next quarterly release for 2026-10-14. At that report, compare year-over-year changes using the same accounting basis.
| What to examine | Strengthens durability | Weakens durability |
|---|---|---|
NII by business | Contributions beyond Markets persist | Growth becomes more concentrated |
Revenue and expenses | Revenue growth continues to exceed cost growth | Costs outlast the income that supported them |
Credit | Losses and forward-looking indicators remain controlled | Deterioration broadens despite a benign headline ratio |
A lower Markets share alone would not prove improvement: the percentage can fall because Markets shrinks. Look for the underlying businesses to earn more and for that income to reach profit. That is a tougher, more useful test than asking whether a headline growth rate repeated.
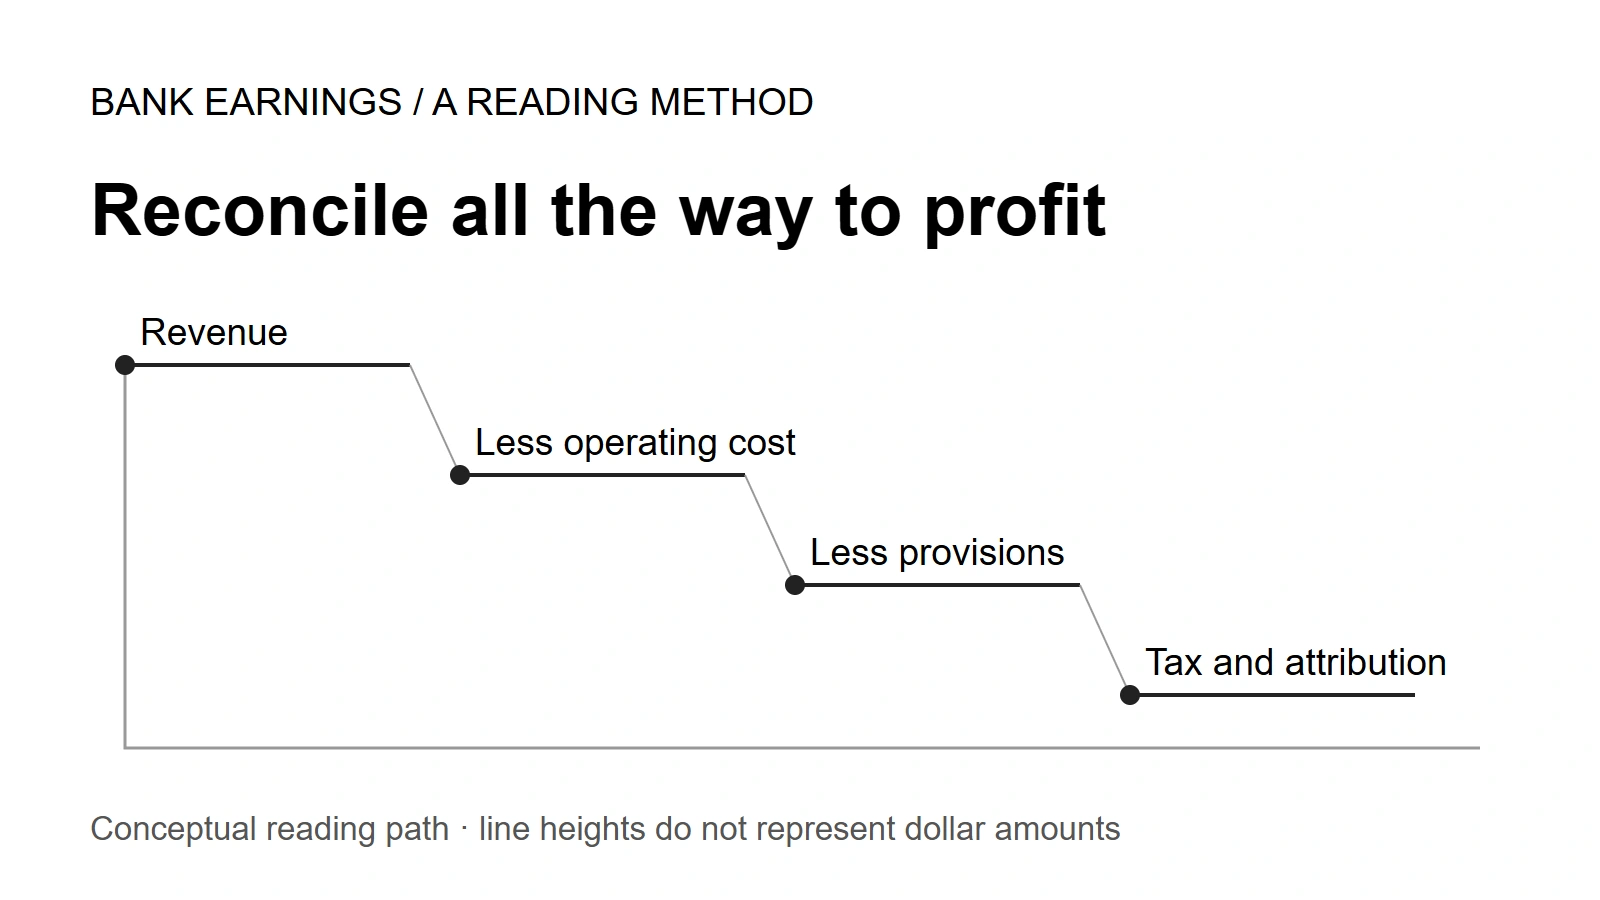
For a wider framework, read how to read bank earnings. The JPMorgan return-quality analysis examines another version of the gap between a reported result and a repeatable one.
The same classification discipline applies outside banking. The AI revenue claims guide separates company totals, business segments and narrower product claims before comparing them.
Sources and method
Reviewed 2026-09-23 using the earnings release, supplemental tables, subsequent quarterly filing and issuer calendar. Actuals refer to the quarter ended 2026-06-30 and the matching prior-year quarter. M means millions of US dollars.
Calculations retain the distinction between GAAP and FTE and use disclosed, rounded inputs. Proof figures reproduce selected numerical fields with a changed layout; the overlap chart is our calculation. AI assisted source organization, drafting, graphics and bilingual checks. Hynexly retains editorial responsibility. This is general educational analysis, not personalized investment advice.
Frequently Asked Questions
No. Every operating segment grew revenue. However, Global Markets accounted for nearly half the increase on the FTE segment basis.
No. Global Markets includes net interest income. Adding those categories would double-count some revenue.
The issuer calendar checked September 23 schedules the next quarterly report for October 14, 2026. Dates remain subject to issuer changes.
Primary references cited or linked in this analysis. Click through to read each source in full.
Choose the next evidence gap to investigate.
Bank Earnings: When Two Correct Calculations Disagree
Read bank earnings from revenue to net income. A BAC–Citi worked example separates growth rates, profit dollars, provisions and the attribution line.
Owner-operated US market research desk
Owner-operated US stock and market coverage built from public filings, SEC EDGAR, official reports, company releases, and market data.
- Source-grounded research with primary filings & official reports
- Bilingual EN / KO editorial workflow
- Manual editorial QA before publish