Nvidia's Sales Grew. Why Did Operating Cash Flow Halve?
Nvidia's Q2 sales rose while operating cash fell. A $20.1B increase in receivables-related cash use explains much of the gap, without proving customer default.
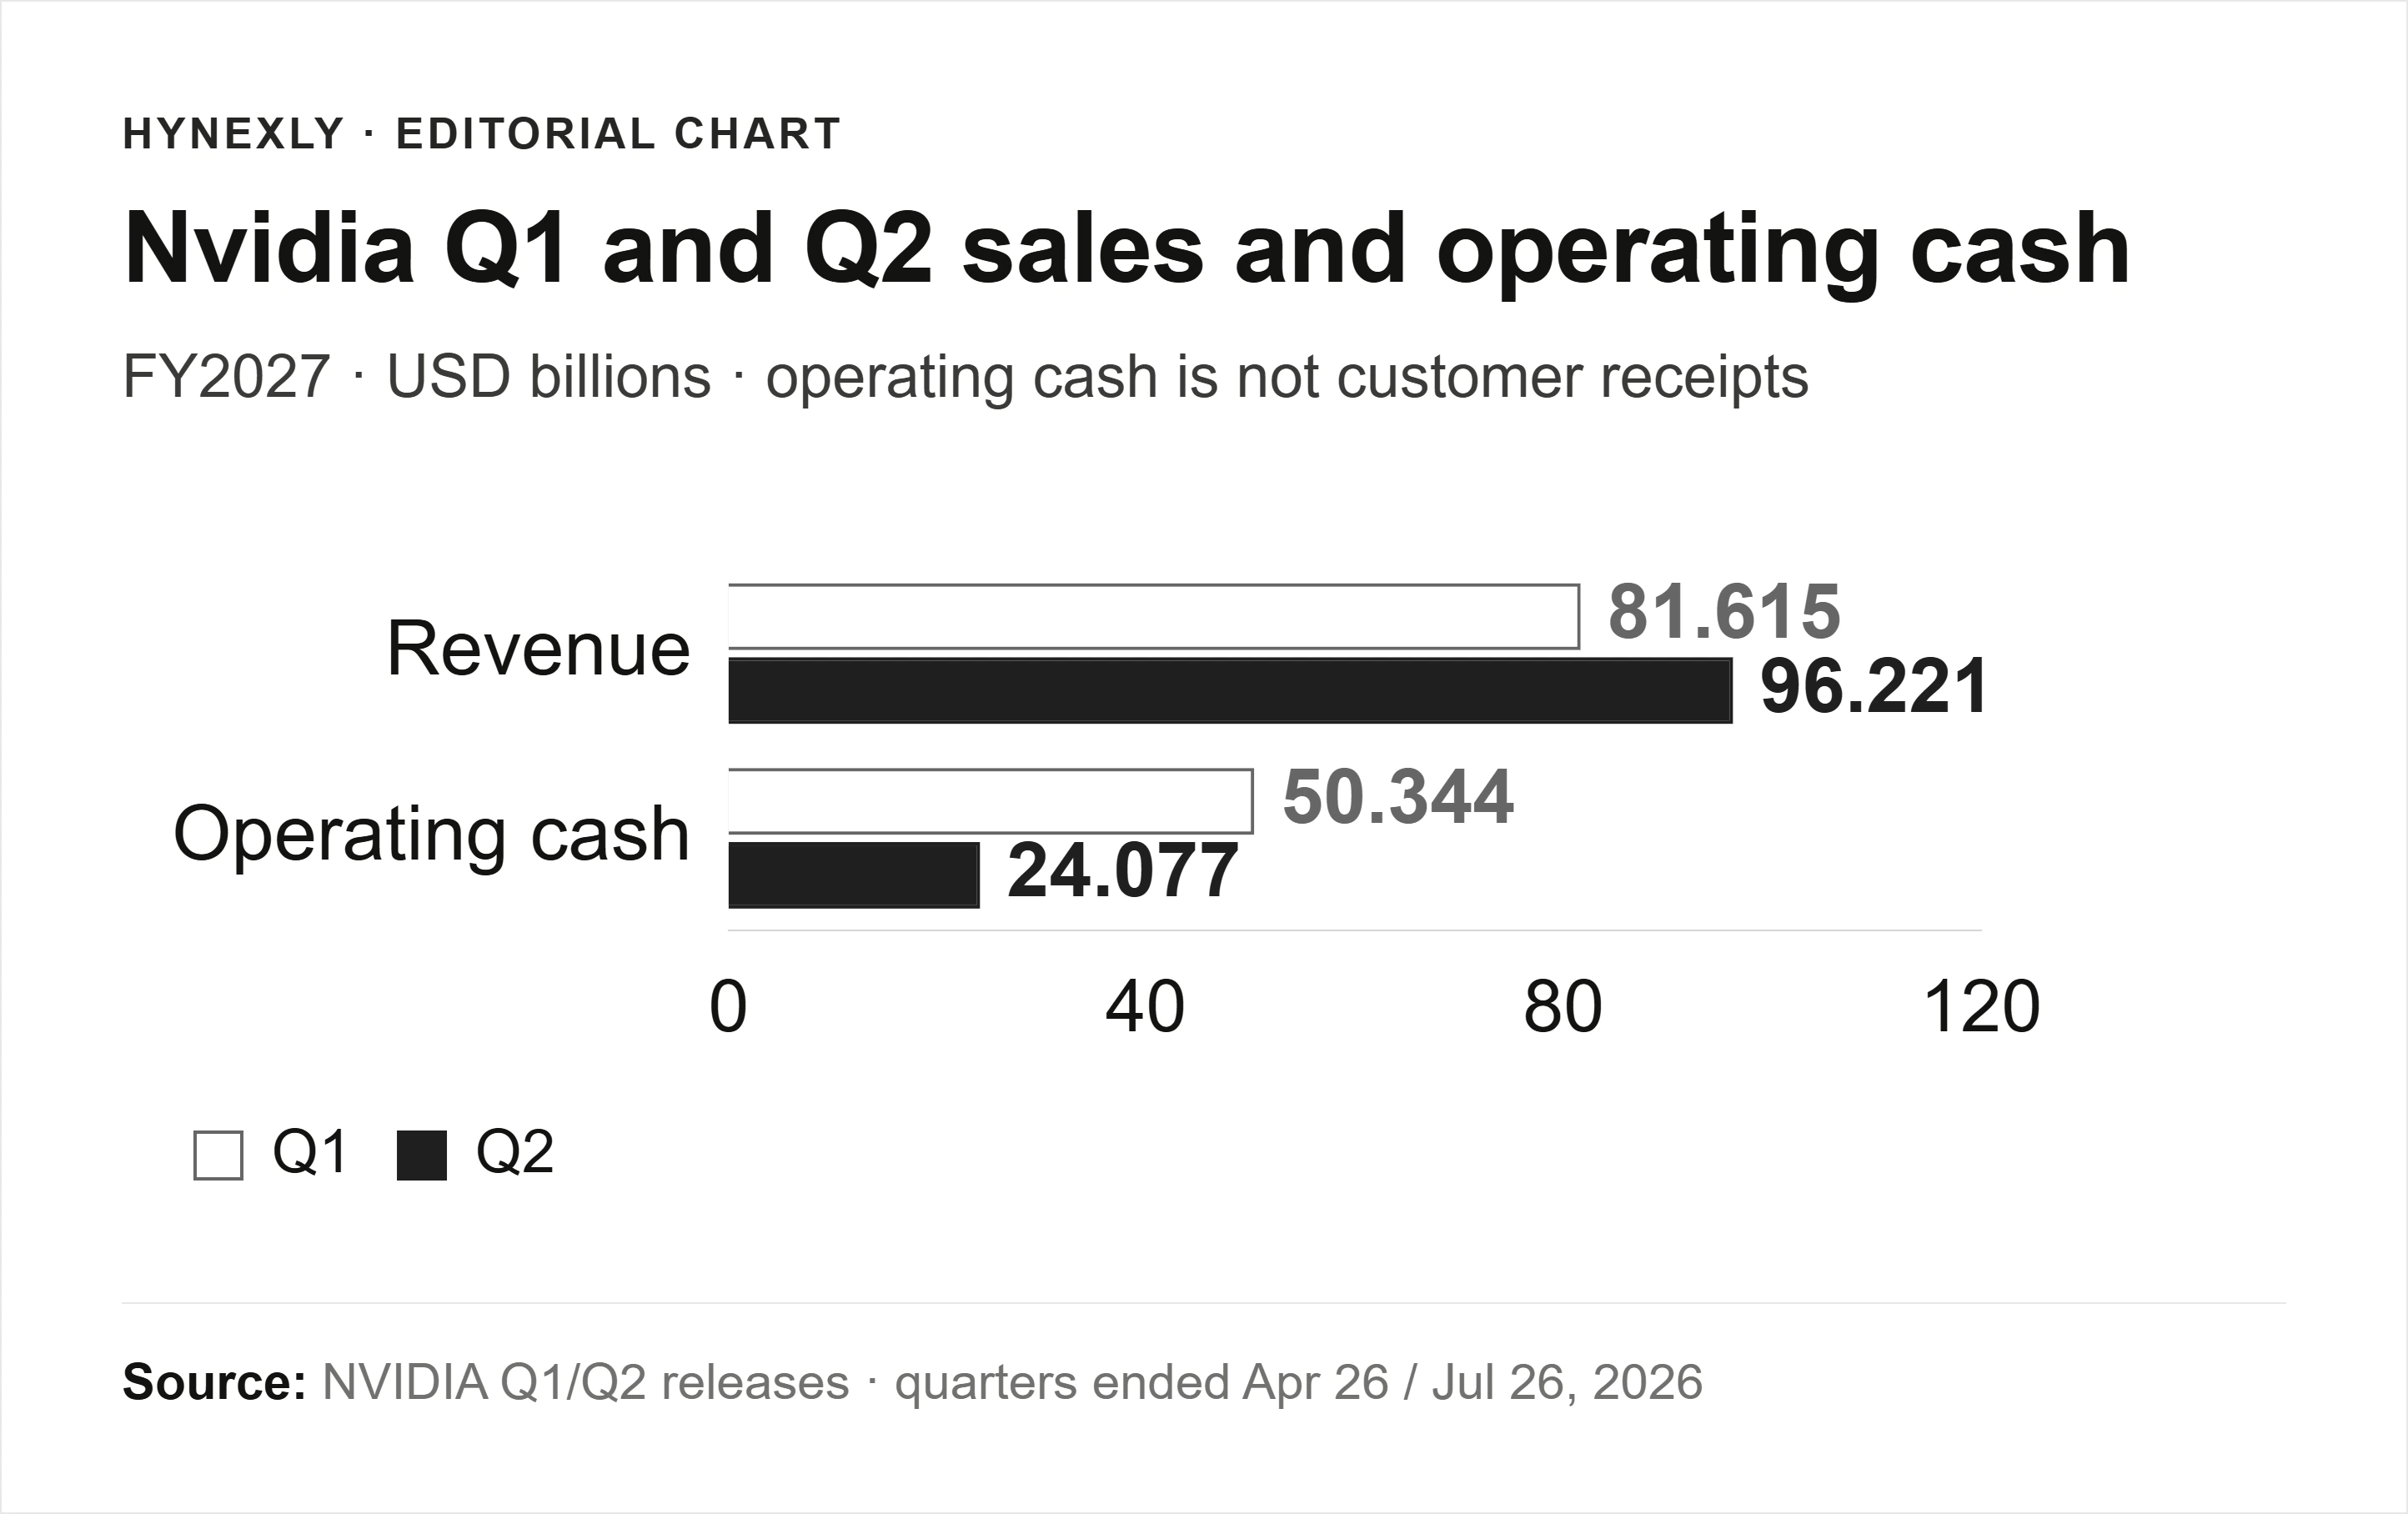
Nvidia's second-quarter sales rose, but the cash left after running the business fell by more than half from the previous quarter. A customer can receive equipment before its payment is due. Meanwhile, Nvidia still buys components, holds inventory and pays taxes.
The cash decline deserves follow-up, not a verdict that the sales are fictitious. The largest adverse movement in the cash reconciliation was money tied up in customer receivables. Longer payment terms explain part of that timing. They do not guarantee eventual collection, and a growing sales base makes the next quarter's collection evidence more important.
Two statements, two different questions
Revenue measures recorded sales. Operating cash flow measures cash generated by the business after its operating inflows and outflows; it is not gross customer receipts.
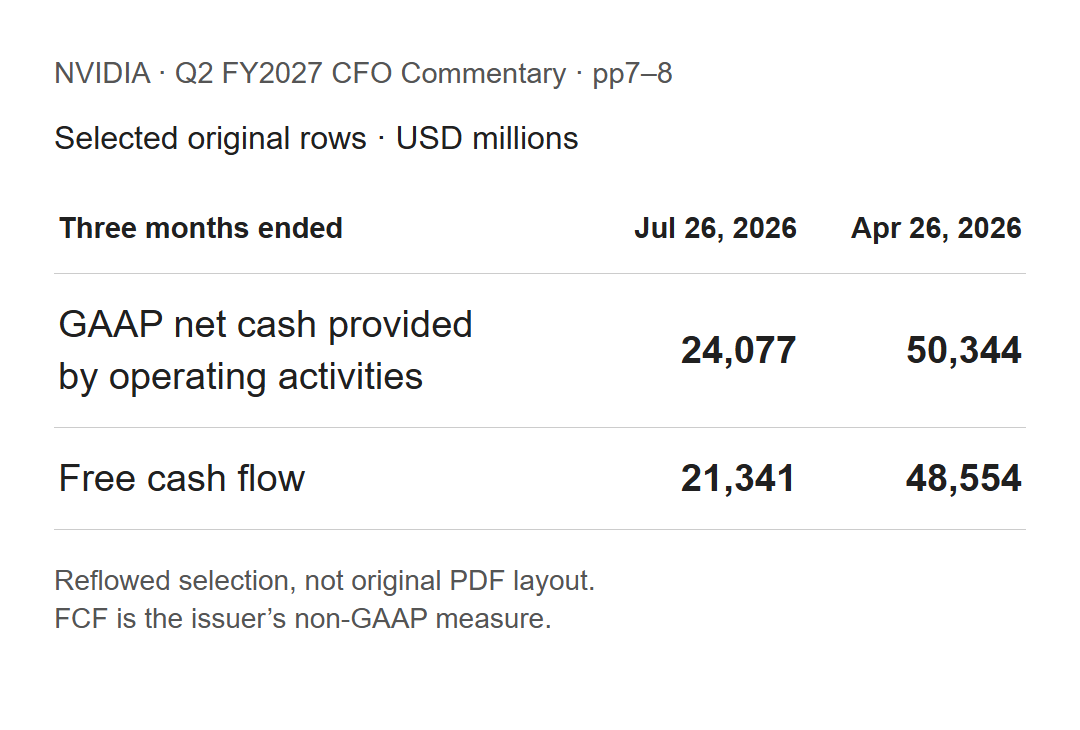
Nvidia reported $96.221B of Q2 revenue, up 17.9% sequentially, in its August 26 release. Yet operating cash fell from $50.344B to $24.077B. These figures answer different questions. Dividing operating cash by revenue would not tell us what fraction of customers paid their invoices.
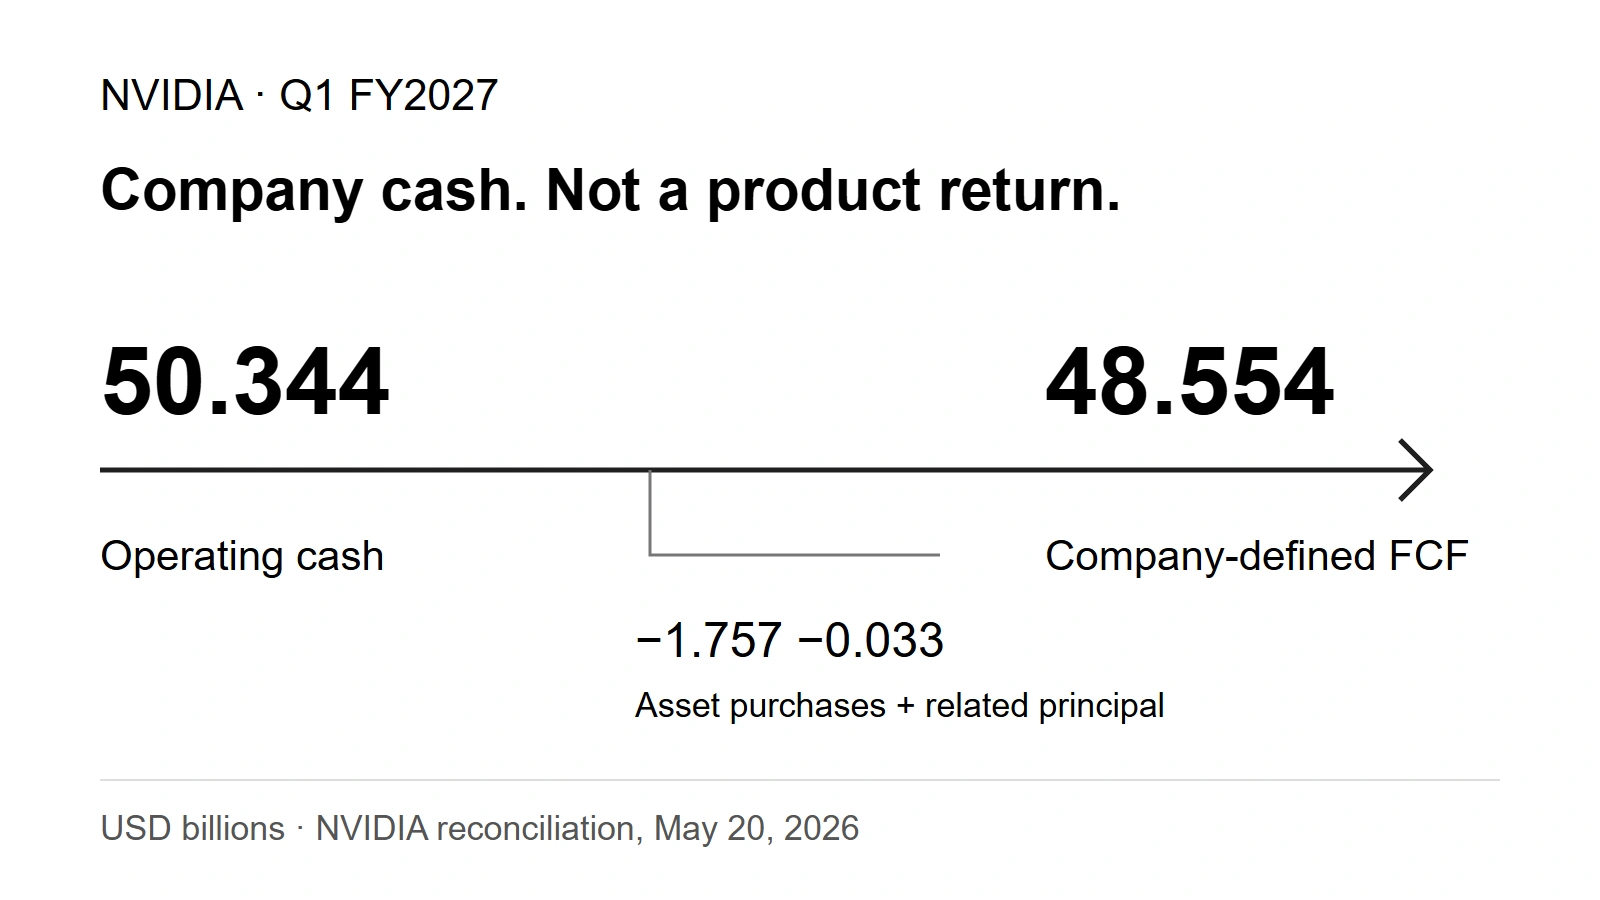
The source also distinguishes free cash flow, the company's non-GAAP measure after specified equipment and intangible-asset purchases and related principal payments. It fell to $21.341B. That adds a capital-spending lens, but the operating-cash statement is where the collection question begins.
The extra $20.1B tied up in receivables
The cash-flow statement records the cash absorbed by changes in accounts receivable: money owed by customers. We compared that row in the actual Q1 and Q2 quarterly statements, rather than comparing headline profits.
| Quarterly cash-flow item | Q1 FY2027 | Q2 FY2027 |
|---|---|---|
Receivables adjustment, USD B | −$2.243B | −$22.346B |
Operating cash flow, USD B | $50.344B | $24.077B |
Receivables used $20.103B more cash in Q2 than in Q1. Against a total operating-cash decline of $26.267B, that is the largest adverse line-item change. The remaining net reduction was $6.164B across all other reconciliation items.
The bridge is exact: $50.344B − $20.103B − $6.164B = $24.077B. It is an accounting comparison, not a claim that each dollar has one isolated economic cause. Other rows include profit, noncash adjustments, inventory, taxes and changes in liabilities; some offset others. Calling the entire residual a tax payment would be wrong.
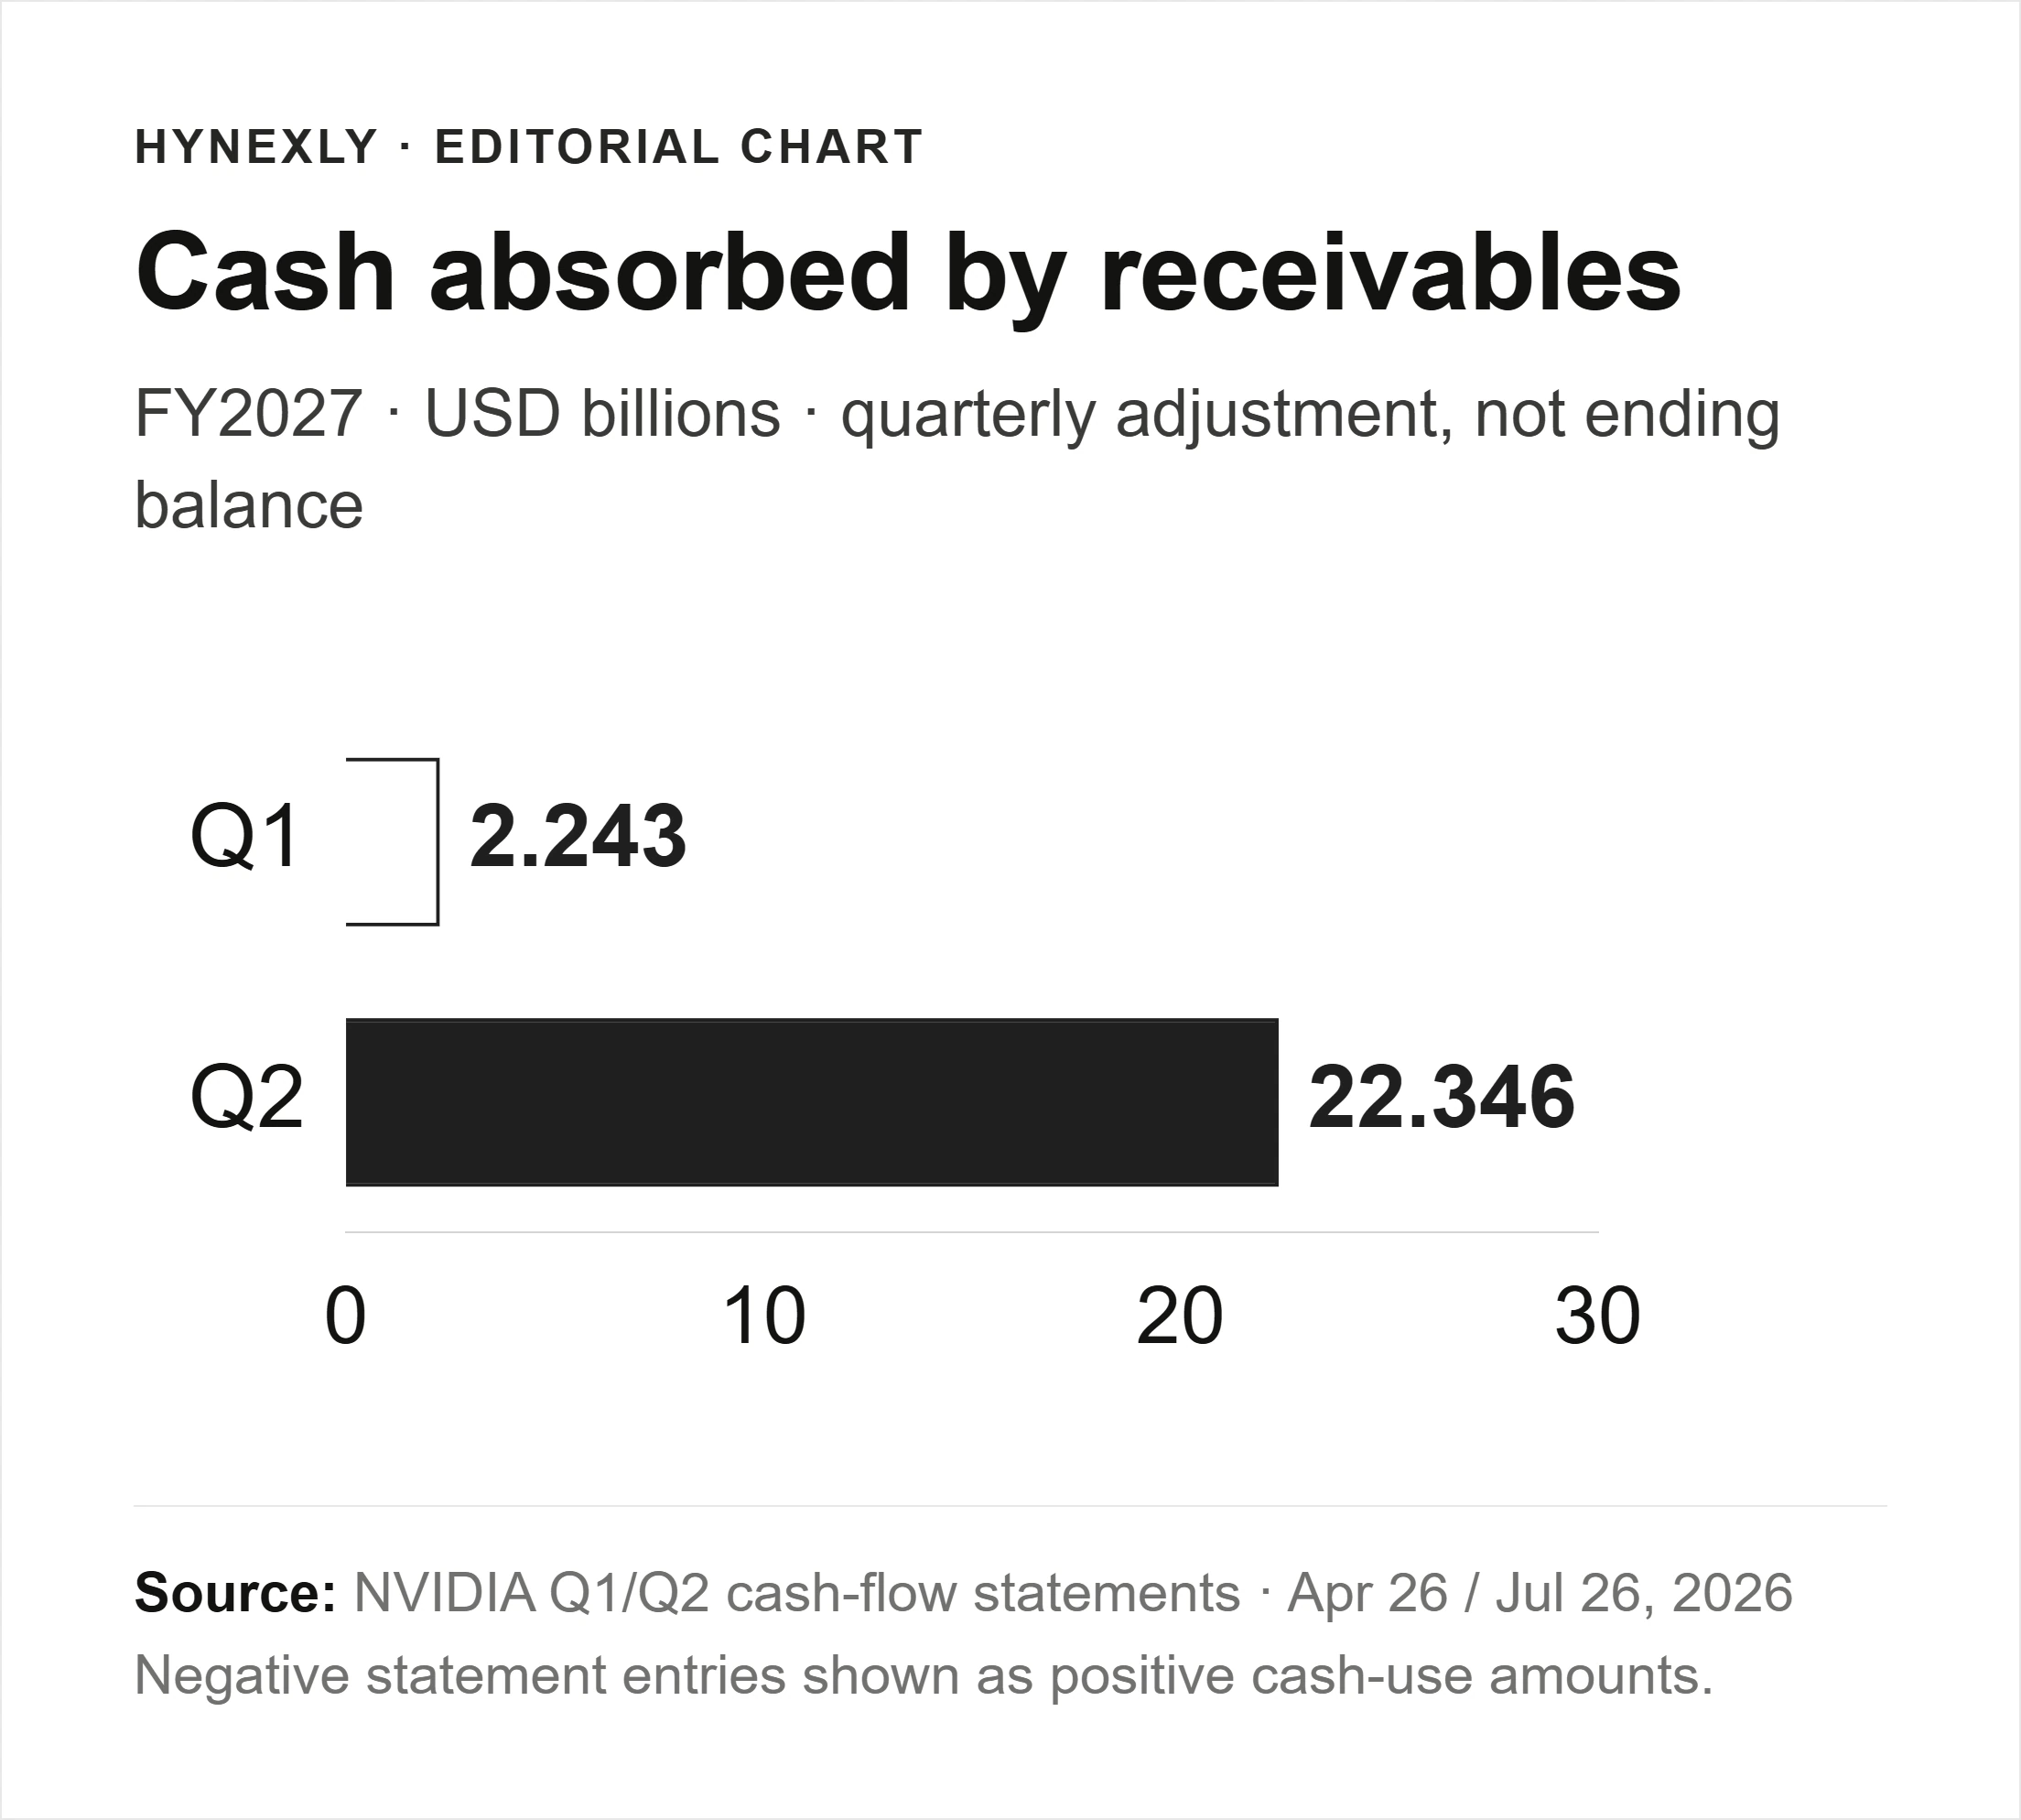
This is the comparison worth carrying into the next filing. More cash tied up in receivables can accompany fast growth or longer terms. A default conclusion needs evidence about failed payments, credit losses or impaired customers that this row does not supply.
Payment terms and tax dates matter
Nvidia says it extended payment terms on large, multi-quarter agreements with certain investment-grade customers. Its collection-time measure, days sales outstanding, rose from 45 to 60 days. That does not mean every invoice was overdue by 60 days. It means the company's reported relationship between sales and receivables changed.
Tax timing also interrupts a simple quarter-to-quarter comparison. The 10-Q, p 32, says Nvidia made two federal income-tax payments in Q2, compared with no estimated payments in Q1. It does not give us permission to attribute the entire cash decline to tax.
Inventory adds a different timing issue. The CFO commentary reports a rise from $25.8B to $31.6B as Nvidia prepared for Vera Rubin's Q3 introduction. Stock purchased ahead of deliveries uses cash now. Its quality becomes clearer when it sells—or when provisions reveal that expected demand did not arrive.
The higher sales outlook is still real
The strongest argument against an alarmist cash reading is the operating business itself. Q2 GAAP gross margin was 75.0%, and operating cash was still 56.7% higher than in the year-earlier quarter. A sequential drop from a strong comparison does not establish an annual deterioration.
| Measure | Q2 actual | Q3 company outlook, issued August 26 |
|---|---|---|
Revenue | $96.221B | $108.0B ±2%; $105.84B–$110.16B |
GAAP gross margin | 75.0% | 74.0% ±0.5 percentage points; 73.5%–74.5% |
China Data Center compute | Actual quarter, not an outlook assumption | No revenue assumed in the outlook |
The revenue midpoint implies another 12.2% sequential increase. The company outlook supplies a testable operating hurdle, not an analyst consensus. No current valuation or attributable consensus is established here, so this article cannot say how much optimism is already reflected in the share price.
What a constructive investment thesis still needs is more specific: rising demand that can be collected profitably while Nvidia helps fund a larger infrastructure ecosystem.
Future commitments are not today's debt
The cash question becomes more consequential when the business also promises resources years ahead. In its August explanation, Nvidia argues that securing land, power and buildings can support multiple generations of compute sales. That is management's rationale, not independent proof that every project will pay off.
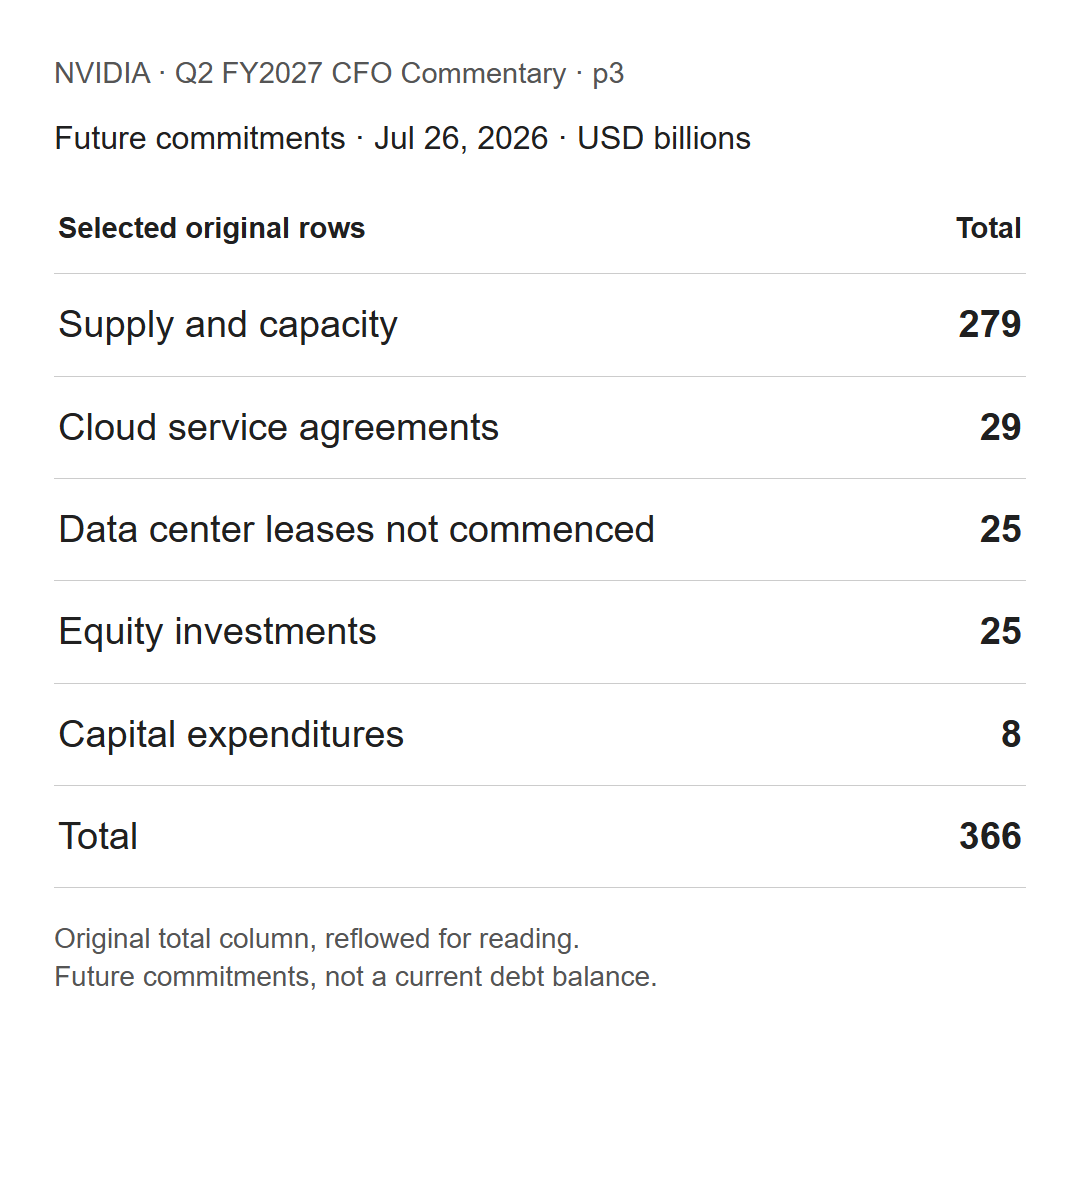
The supply-and-capacity line accounts for $279B of the $366B total. Separately, Nvidia discloses additional customer-related commitments and conditional guarantees. Their different timing and legal meaning matter more than a dramatic combined number.
| Disclosure | Amount | What the amount is not |
|---|---|---|
Future commitments | $366B | A current-quarter expense |
Additional commitments | $56B | The same table as the first group |
Maximum gross guarantee exposure, including August agreements | $108.5B | An expected loss or a balance fully payable today |
The guarantee total includes a $105B cap for SB Energy's PORTS-Pike project. The company says obligations become effective in phases as conditions are met, with the first facilities expected in FY2029; exposure declines as OpenAI pays leases. Conditional does not mean harmless. A tenant or project that fails could leave Nvidia with obligations even after the original sales opportunity weakened.
Two risks therefore need different evidence. Persistent collection delays or credit losses would challenge cash quality. Guarantee obligations becoming effective ahead of customer cash generation would increase financing exposure. Neither is resolved by a strong revenue headline, and neither should be declared a realized loss before the evidence appears.
The next filing has to close the gap
| Watch item | Current evidence | What changes the interpretation |
|---|---|---|
Customer collections | 60-day DSO; larger receivables cash use | Shorter collection time with cash recovery supports timing; persistent deterioration or credit losses weakens it |
Demand and margin | Q3 outlook above | Compare actual revenue and margin with the stated ranges, not an invented target |
Inventory | $31.6B ahead of the product introduction | Sales conversion without larger provisions supports the build; unsold stock and provisions challenge it |
Guarantees | Phased maximum exposure, not a current loss | Check effective obligations, counterparties and any loss disclosure |
The August call named November 17, 2026 for the next results call (transcript, p 15); confirm the date with investor relations. The useful test is whether collection catches up as sales expand, not whether every cash metric moves in the same direction in every quarter.
For the earlier comparison, use the Q1 Blackwell cash-conversion baseline. To compare customer groups rather than cash flows, the networking disclosure investigation explains why the old Q1 customer table is the wrong denominator.
How this comparison was built
Quarterly values come from the original releases; cash-flow definitions and commitments from the CFO commentary; tax timing from the 10-Q. The Q1 receivables adjustment is $2.243B, not a value reconstructed from rounded half-year totals. Percentage changes use unrounded reported inputs. FCF is $24.077B − $2.677B − $0.059B = $21.341B.
AI assisted with source organization, arithmetic, bilingual drafting and image production. Figures distinguish source selections from our calculations. Owner editorial and conflict review remains part of the release process; no independent human review is claimed. This is educational analysis, not a rating, price target or personal trade instruction. No Nvidia sponsorship or affiliate relationship is disclosed.
Reviewed September 23, 2026: rebuilt the cash comparison, removed the stale price reaction and separated future obligations from current cash. Original publication date and URL retained.
Primary references cited or linked in this analysis. Click through to read each source in full.
Choose the next evidence gap to investigate.
Nvidia's cash quarter was real. Repeating it was another question.
Nvidia's Q1 FY2027 cash flow covered substantial investment and repurchases. Tax timing, share issuance and the completed Q2 result show why it was not a permanent run rate.
Owner-operated US market research desk
Owner-operated US stock and market coverage built from public filings, SEC EDGAR, official reports, company releases, and market data.
- Source-grounded research with primary filings & official reports
- Bilingual EN / KO editorial workflow
- Manual editorial QA before publish