Hynexly

Market & Macro

Nvidia's $48.6B Cash Quarter: Is Blackwell Funding Its Own Ramp?

Nvidia's Q1 revenue and free cash flow both grew about 85%. The harder test is whether Blackwell can keep margins and cash intact as inventory rises.

Hynexly Research

Owner-operated US market research desk

13 min readMethodology
NvidiaNVDABlackwellfree cash flowinventoryAI infrastructuresemiconductors
Editorial photograph of a laptop on a dark wooden desk
Editorial context image

Nvidia turned every $100 of Q1 FY2027 revenue into roughly $59.50 of company-defined free cash flow. The prior-year figure was about $59.30; Blackwell did not merely make the income statement larger. So far, the cash conversion behind it has held.

That is the cleanest answer to the question in the headline. Blackwell is funding its own ramp today. Revenue and free cash flow both grew about 85% year over year, while GAAP gross margin returned to 74.9%. The open question is not whether the latest quarter was strong. It is whether Nvidia can keep those three clocks—revenue, margin, and cash—aligned while inventory and supply commitments rise.

Control sheetQ1 FY2027 evidenceWhat remains unproven
Growth$81.615B revenue; +85.2% YoYHow quickly the slope normalizes
Cash conversion$48.554B company-defined FCF; 59.5% marginWhether conversion holds through the next ramp
Inventory$25.797B; +20.5% QoQWhether stock and provisions outrun revenue
Editorial context photograph of a person writing beside a laptop

The quarter passed the cash test

Q1 FY2027 revenue reached $81.615B, up 20% sequentially and 85% year over year. Data Center contributed a rounded $75.2B, up 92% year over year. Those figures describe scale; cash flow tells us more about the quality of that scale.

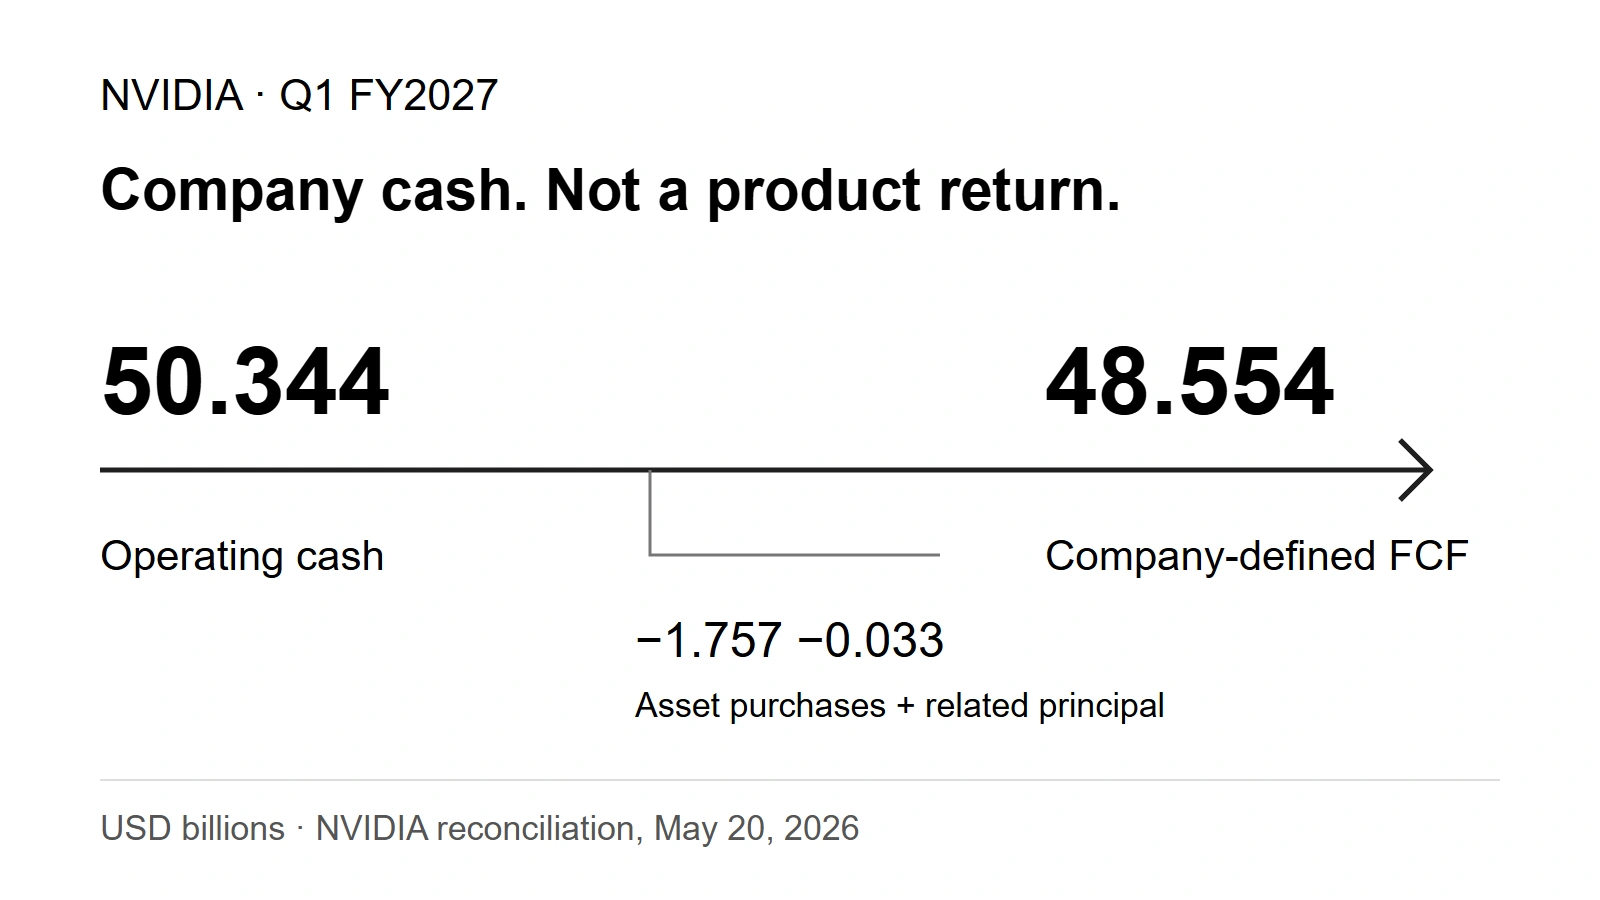
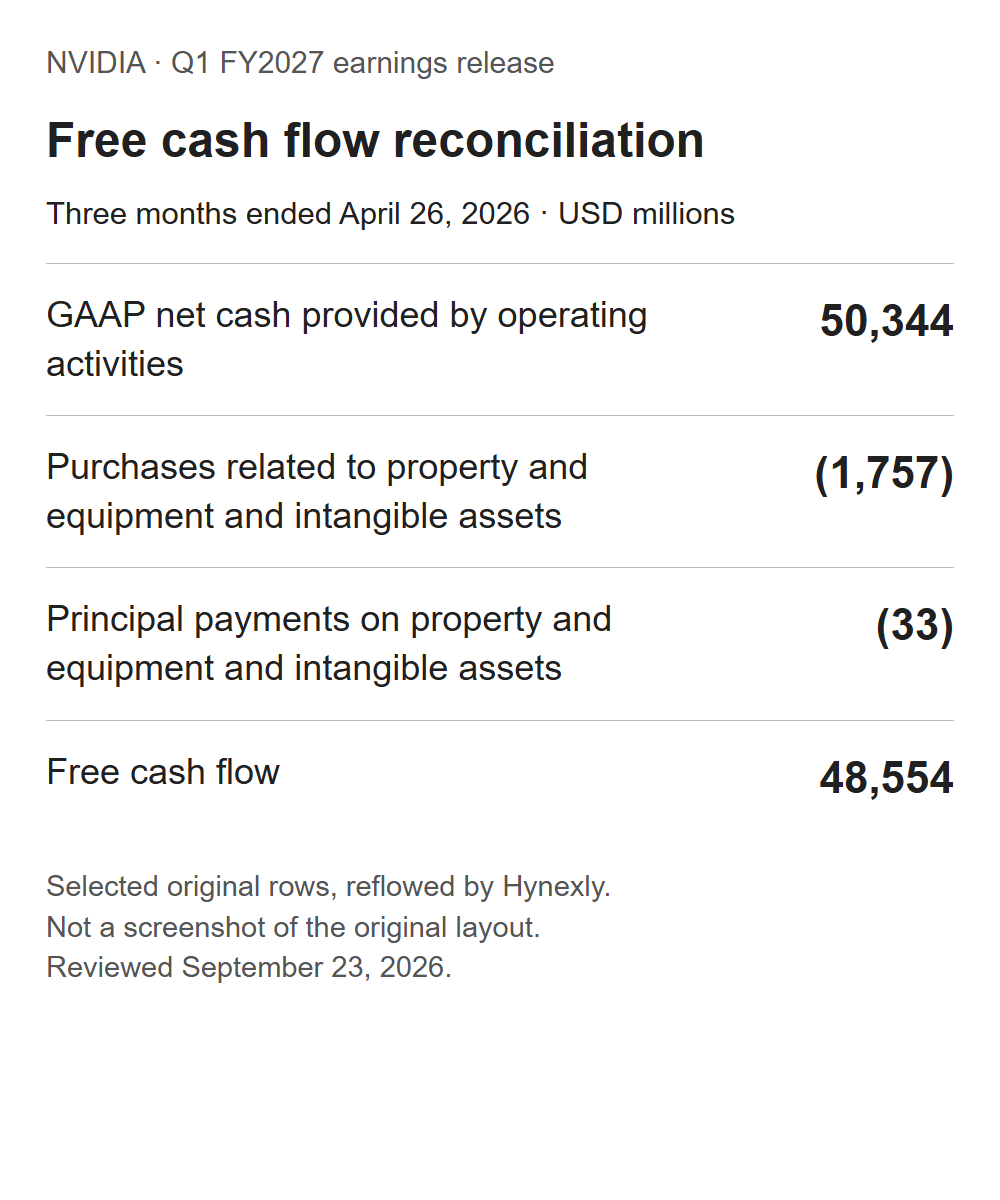
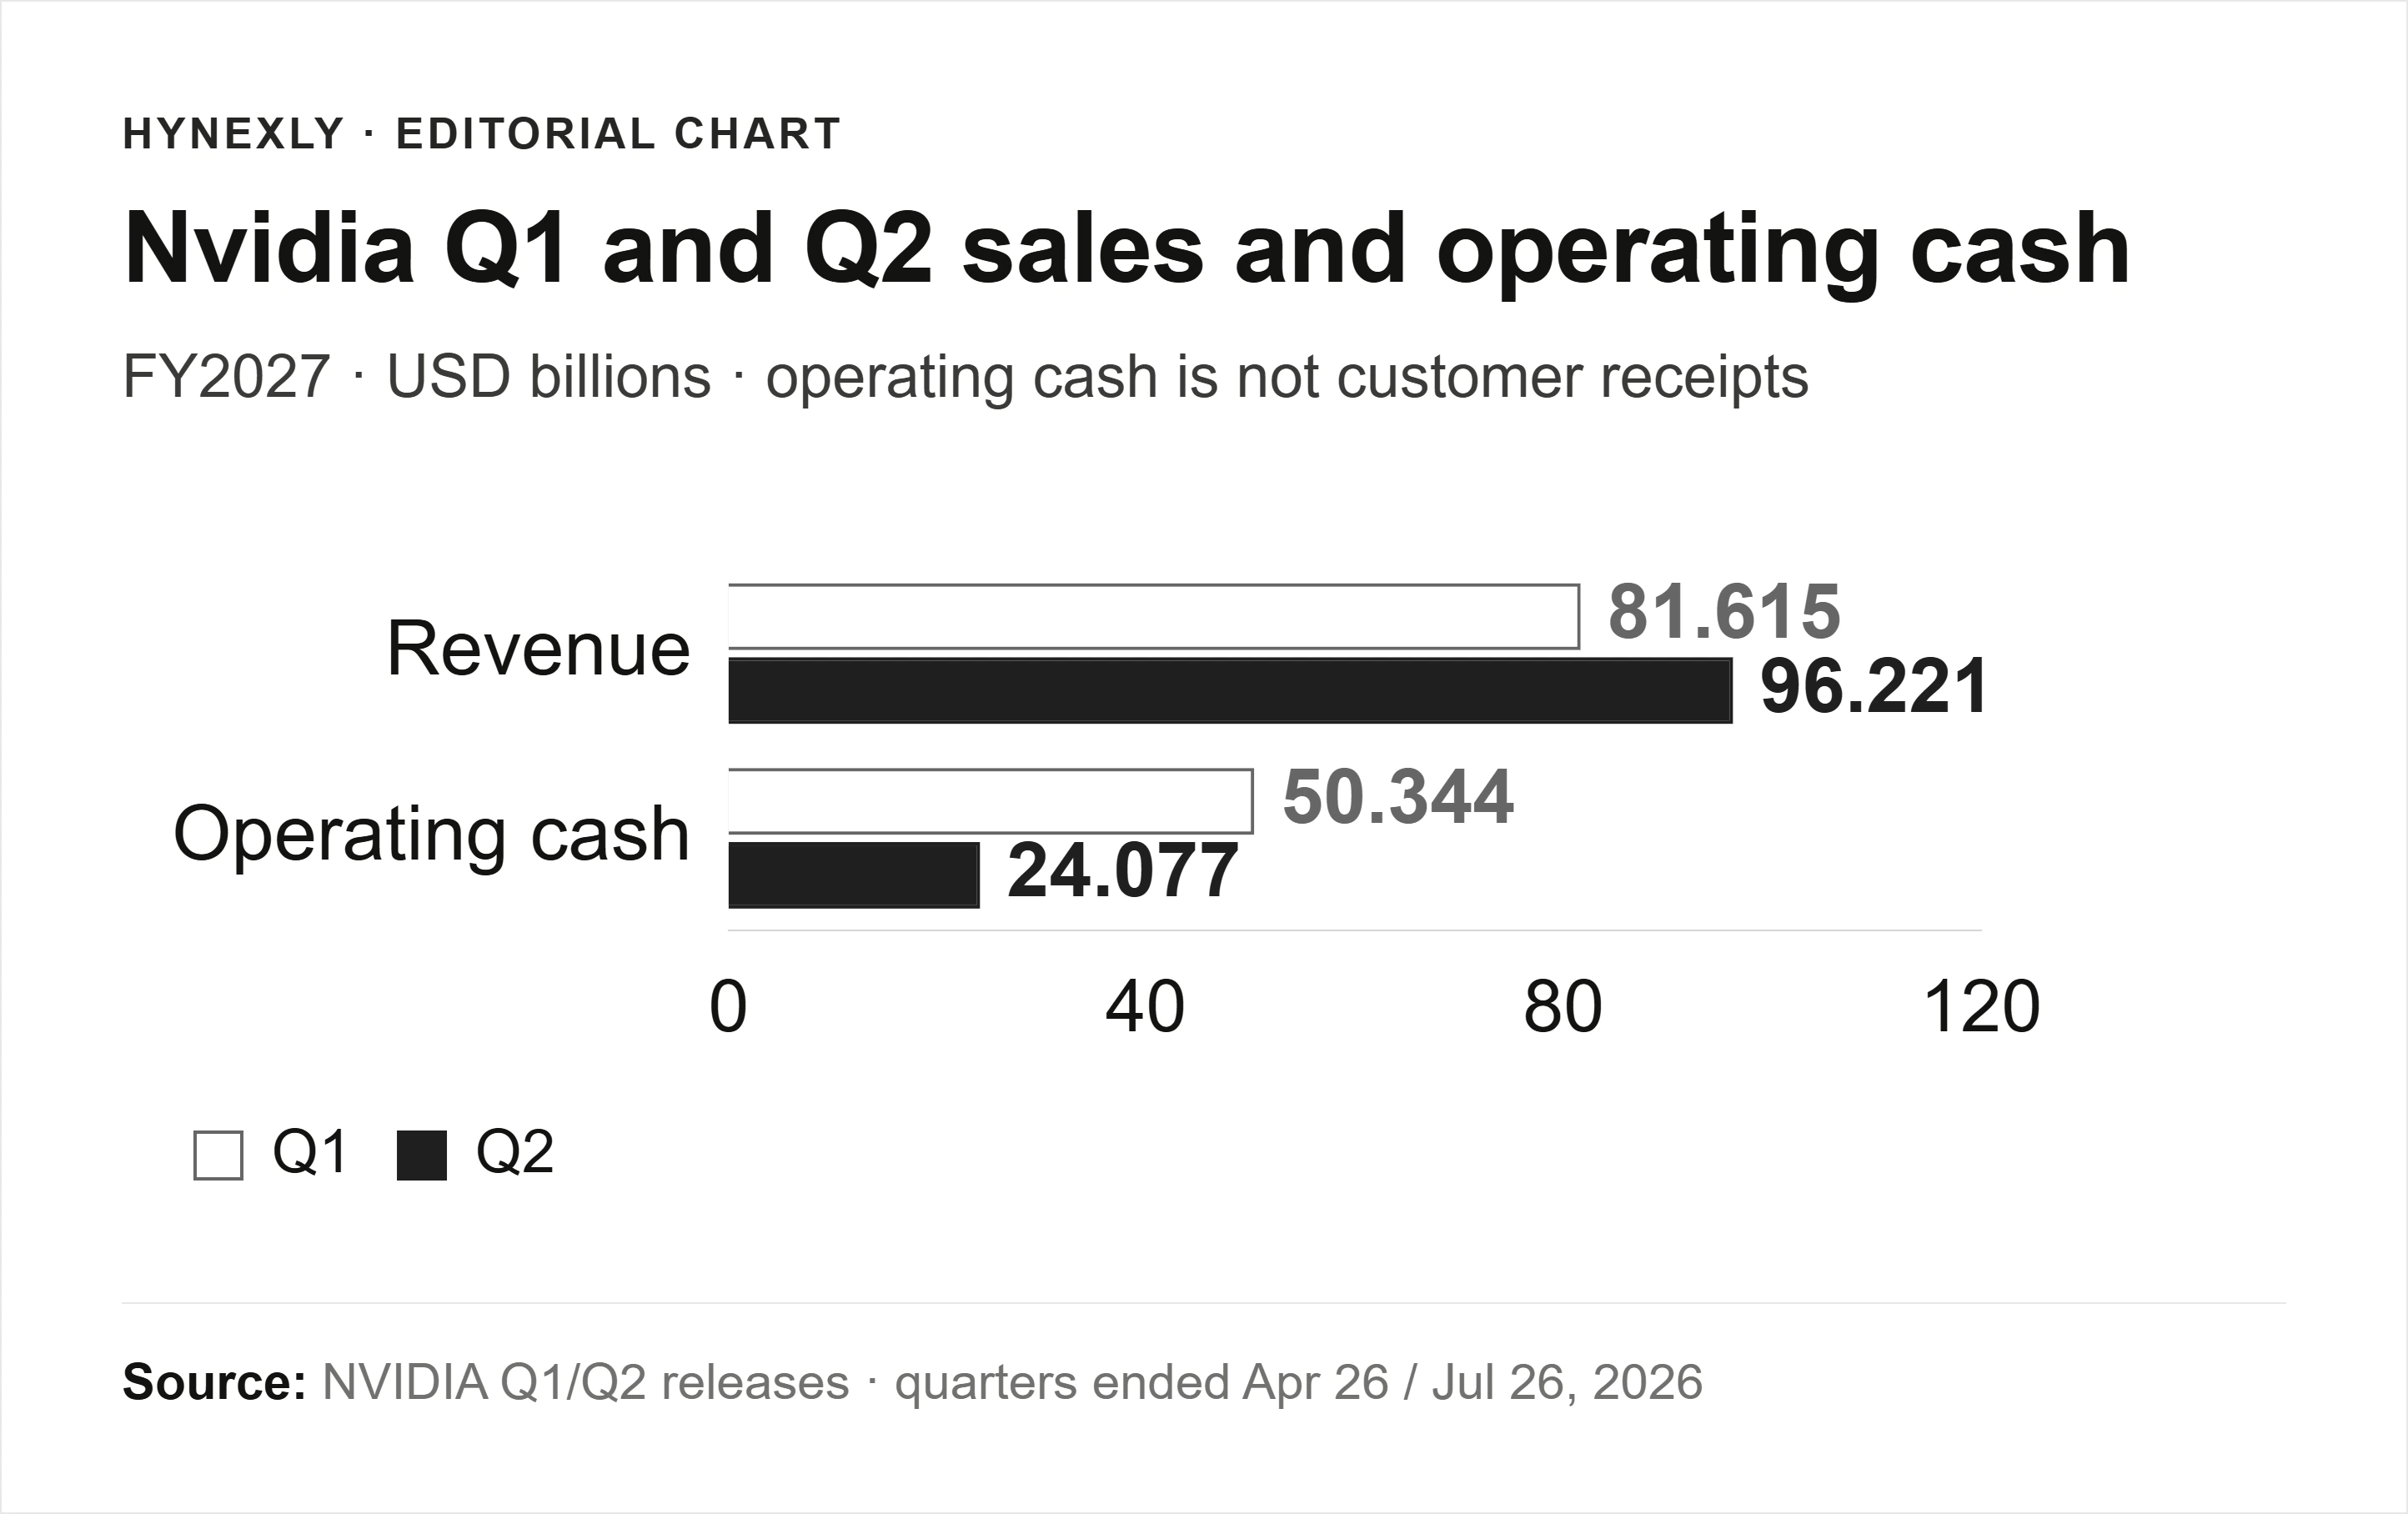
Nvidia reported $50.344B of GAAP operating cash flow. Under the company's free-cash-flow definition, it then subtracts $1.757B of purchases related to property, equipment, and intangible assets and $33M of principal payments. The result was $48.554B.

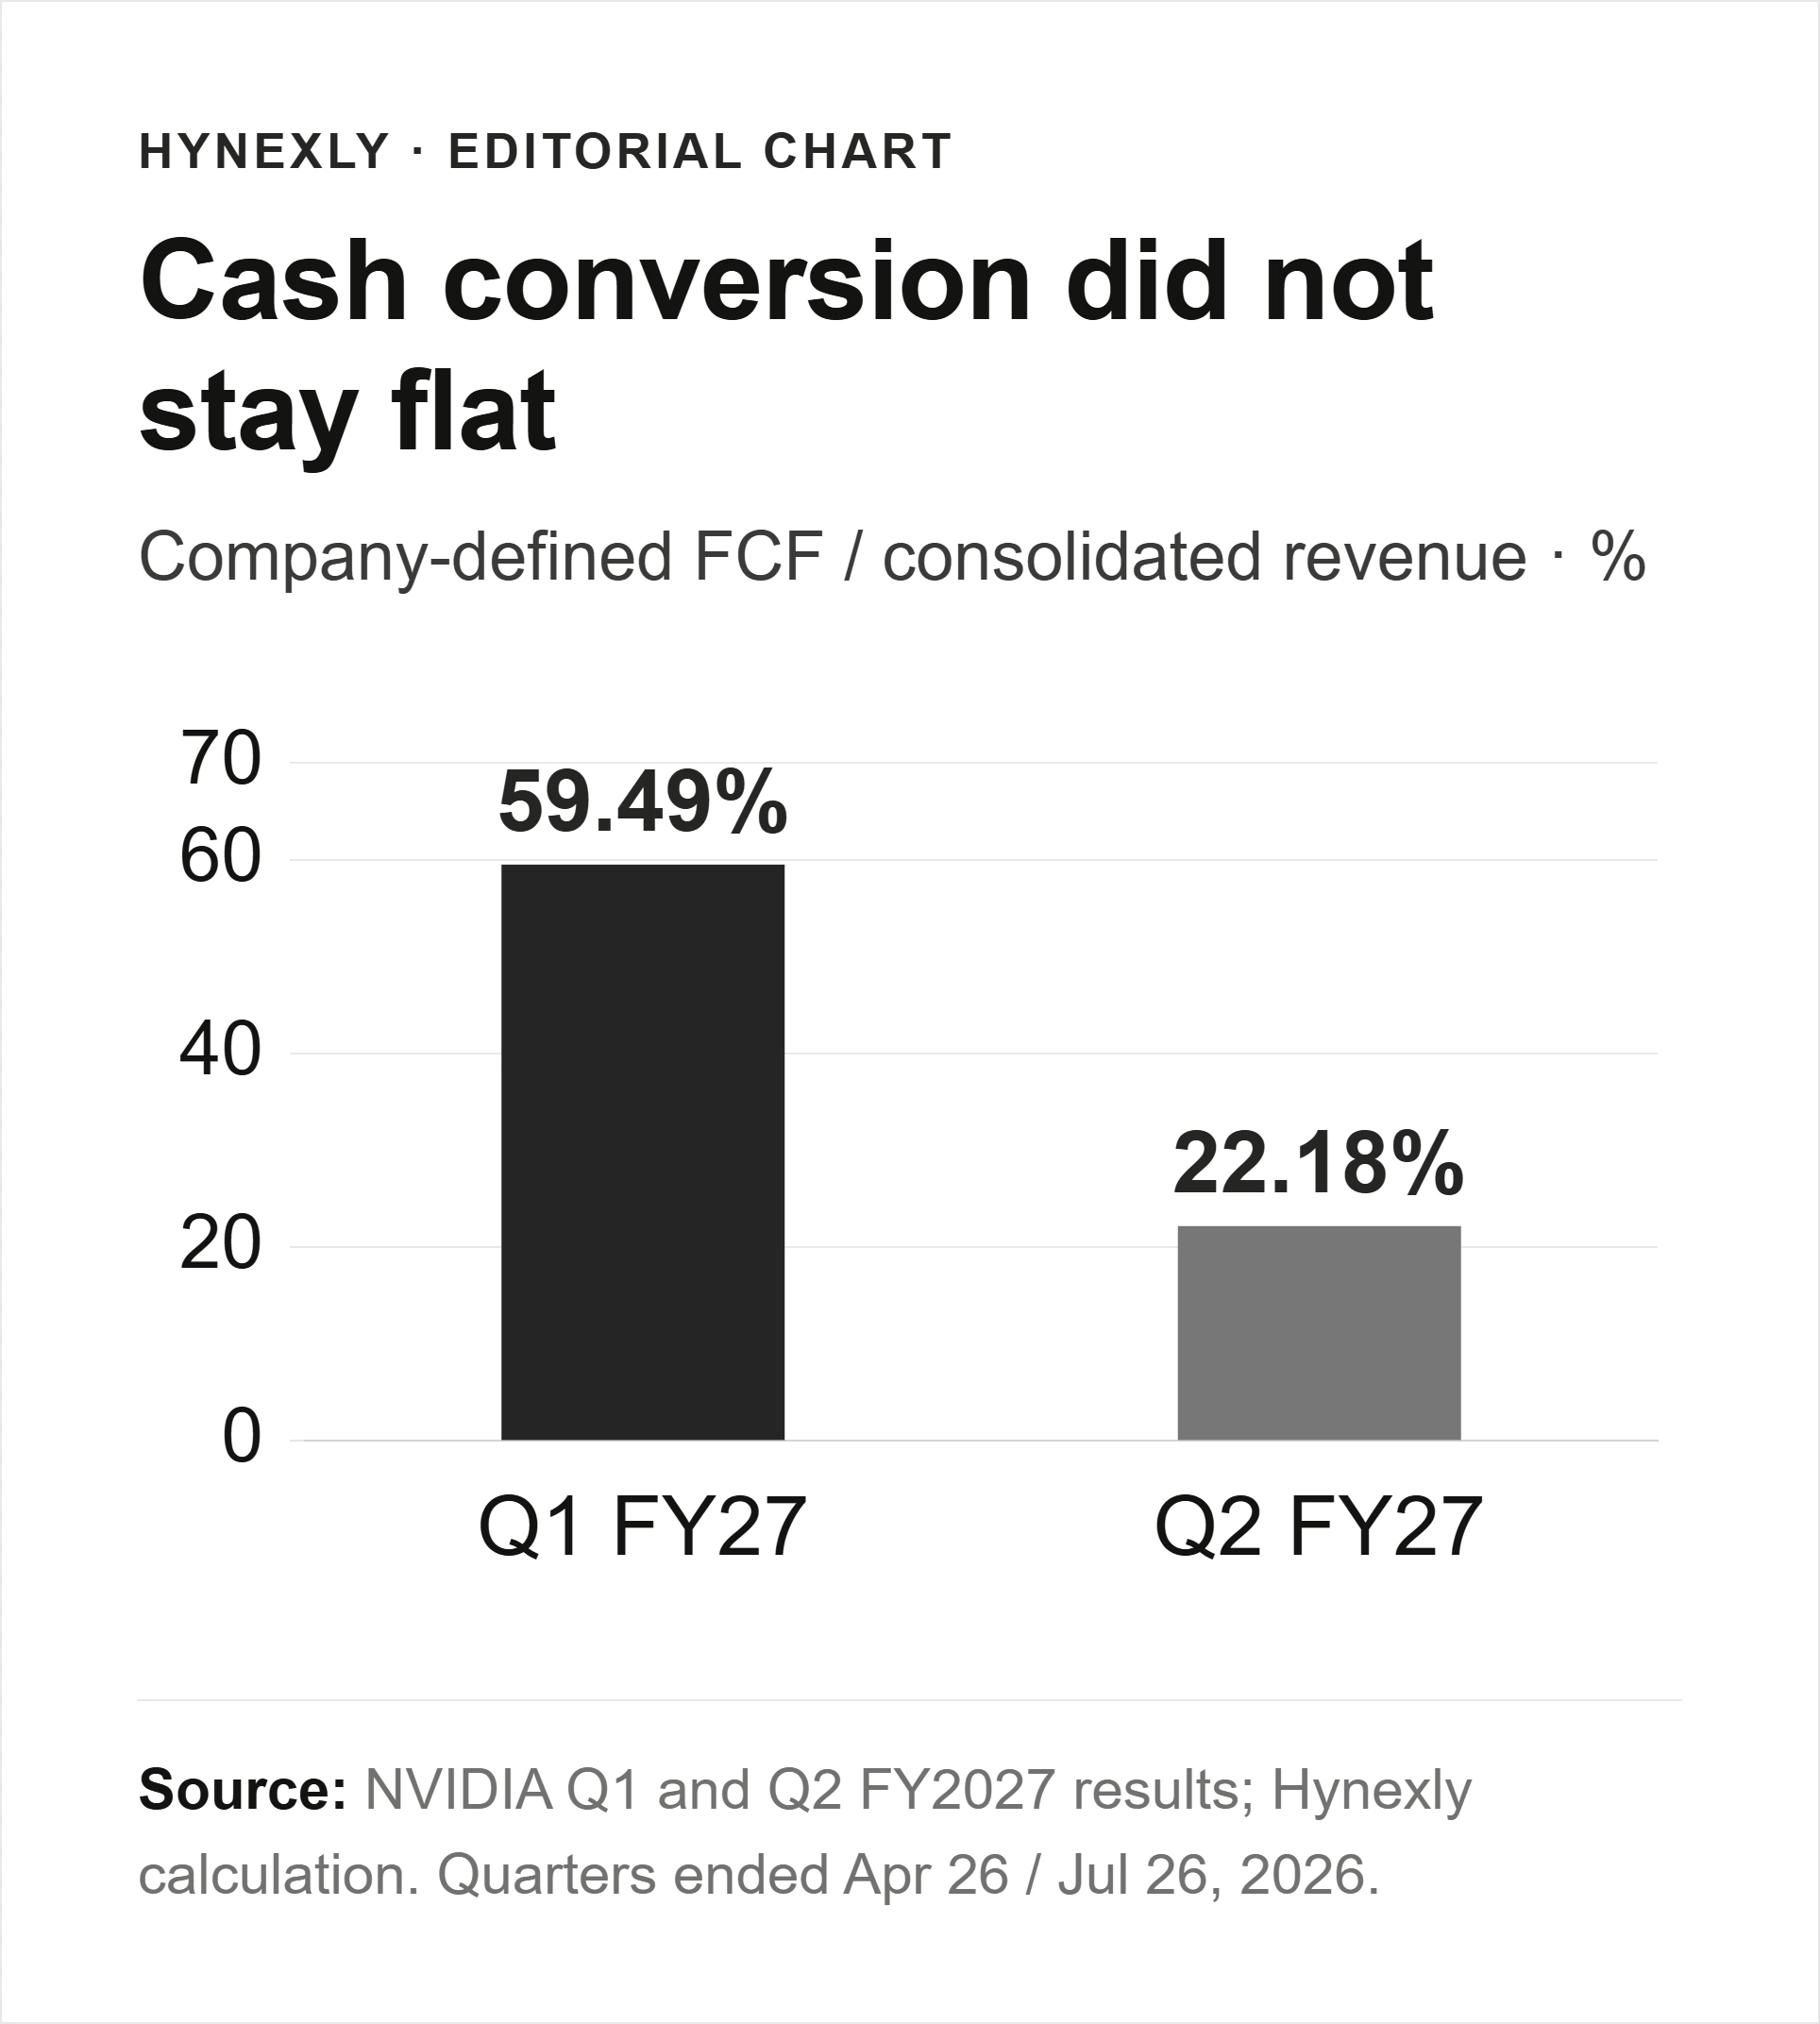
The comparison with Q1 FY2026 is unusually clean. Revenue grew 85.23% using the reported values. Free cash flow grew 85.78%. Free-cash-flow margin moved from 59.31% to 59.49%, effectively flat despite the size of the product transition.

Nvidia cash-conversion bridge from revenue through operating cash and company-defined deductions to free cash flow

Source-derived explanation from NVIDIA's Q1 FY2027 earnings release. Company-defined free cash flow equals $50.344B − $1.757B − $0.033B = $48.554B; FCF margin equals FCF divided by GAAP revenue.

This does not mean every dollar of Blackwell demand is permanent. It means the current ramp has not required a visible sacrifice in company-level cash conversion. That is a stronger claim than simply pointing to accelerating sales, and a narrower claim than saying the cycle can never weaken.

Source Evidence Snapshot

The official GAAP table keeps three measurement boundaries in view. Q1 revenue was $81.615B. GAAP gross margin was 74.9%, nearly flat with 75.0% in the prior quarter. The 60.5% comparison a year earlier was depressed by the H20-related charge, so it should not be treated as a normal base.

Official NVIDIA GAAP table showing Q1 FY2027 revenue, gross margin, operating income, net income, and comparisons
Source capture: NVIDIA Q1 FY2027 earnings release, released 2026-05-20, captured 2026-07-25. Values are USD millions except percentages and per-share data.

The free-cash-flow table matters because it prevents a definition shortcut. Nvidia's measure is not simply operating cash flow minus one capex line; it also subtracts principal payments on property, equipment, and intangible assets. The deduction was small this quarter, but the definition should remain consistent across periods.

Official NVIDIA reconciliation showing operating cash flow, asset purchases, principal payments, and free cash flow for three quarters

Primary-source reconciliation: NVIDIA Q1 FY2027 earnings release, captured 2026-07-25. Free cash flow is a company non-GAAP measure; values are USD millions.

The cash result also survived a large working-capital demand. Inventory used $4.420B of operating cash during the quarter. That is not capex and should not be subtracted from operating cash again; it is already reflected in the $50.344B figure.

Rising inventory is a question, not yet an answer

Inventory ended the quarter at $25.797B, up from $21.403B at the end of Q4. Raw materials rose most visibly, from $3.807B to $6.647B. Work in process reached $9.949B and finished goods $9.201B.

Official NVIDIA Form 10-Q inventory table showing raw materials, work in process, finished goods, and total inventories

Primary-source table: NVIDIA Form 10-Q for the quarter ended 2026-04-26, filed 2026-05-22, captured 2026-07-25. Values are USD millions.

A stock-flow comparison needs care: inventory is a balance at one date, while revenue accumulates across a quarter. Used as a directional control rather than an accounting identity, the matched Q1/Q4 boundaries are still useful. Inventory rose 20.53% sequentially; revenue rose 19.80%. Inventory had not yet moved meaningfully ahead of the sales ramp.

Nvidia inventory test comparing sequential inventory growth with revenue growth, cash use, and raw-material stock

Source-derived control sheet using the Q1 FY2027 Form 10-Q and the Q1 earnings release. Inventory growth compares quarter-end balances; revenue growth compares quarterly flows.

The provision evidence is also better than the raw inventory number might imply. Nvidia recorded $0.8B of inventory provisions in Q1 FY2027 and $1.1B when excess purchase obligations are included. In the H20-affected prior-year quarter, those figures were $2.3B and $5.3B. The present build is large, but it has not produced the same charge pattern.

What the Street is Pricing

At the 2026-07-24 US close, NVDA was $206.84; the indicated market value was around $5.05T. That snapshot is volatile and does not tell us fair value. It does make the absolute delivery burden visible: at this scale, a good quarter can still disappoint if the next revenue slope, margin, or cash conversion weakens.

The tape is consolidating near a second volume cluster

The close was 1.7% above its 20-day average, 1.1% below its 50-day average, 3.6% above its 100-day average, and 7.2% above its 200-day average. That is a consolidation pattern rather than a clean momentum break: the long trend remained positive, but the price had not reclaimed its intermediate average. The stock was up 9.5% from the 2026-01-02 close after trading between $164.27 and $236.54 during the year.

NVDA month-end closes, 50-day and 200-day averages, and a daily-volume concentration proxy through 2026-07-24

Source-derived explanation using Nasdaq daily OHLCV through 2026-07-24. The right side assigns each full session's volume to the $5 bin containing that day's typical price, (high + low + close) / 3. It is a daily-volume concentration proxy—not an intraday volume profile, investor cost basis, or proven support and resistance map.

On that limited measure, 65.5% of volume observed through 2026-07-24 fell in the $180–$210 range. The heaviest zone was $180–$190 at 31.2%; the current $205–$210 range carried another 10.1%. This suggests a broad lower trading base and a smaller current-price cluster. It does not establish how much stock remains for sale above the market, because daily bars cannot reveal the intraday sequence of buyers and sellers.

Macro and positioning raise the hurdle, not the cash result

Dated contextReading at reviewDecision boundary
Broad risk appetiteCNN Fear & Greed 39.4, “Fear,” on 2026-07-24; 26.5 one month earlierA broad-market sentiment gauge, not an NVDA reversal signal
Treasury discount rate10-year nominal 4.69%; 10-year real 2.43%Both rose over the month—28 bp and 20 bp, respectively—raising the hurdle for long-duration equities
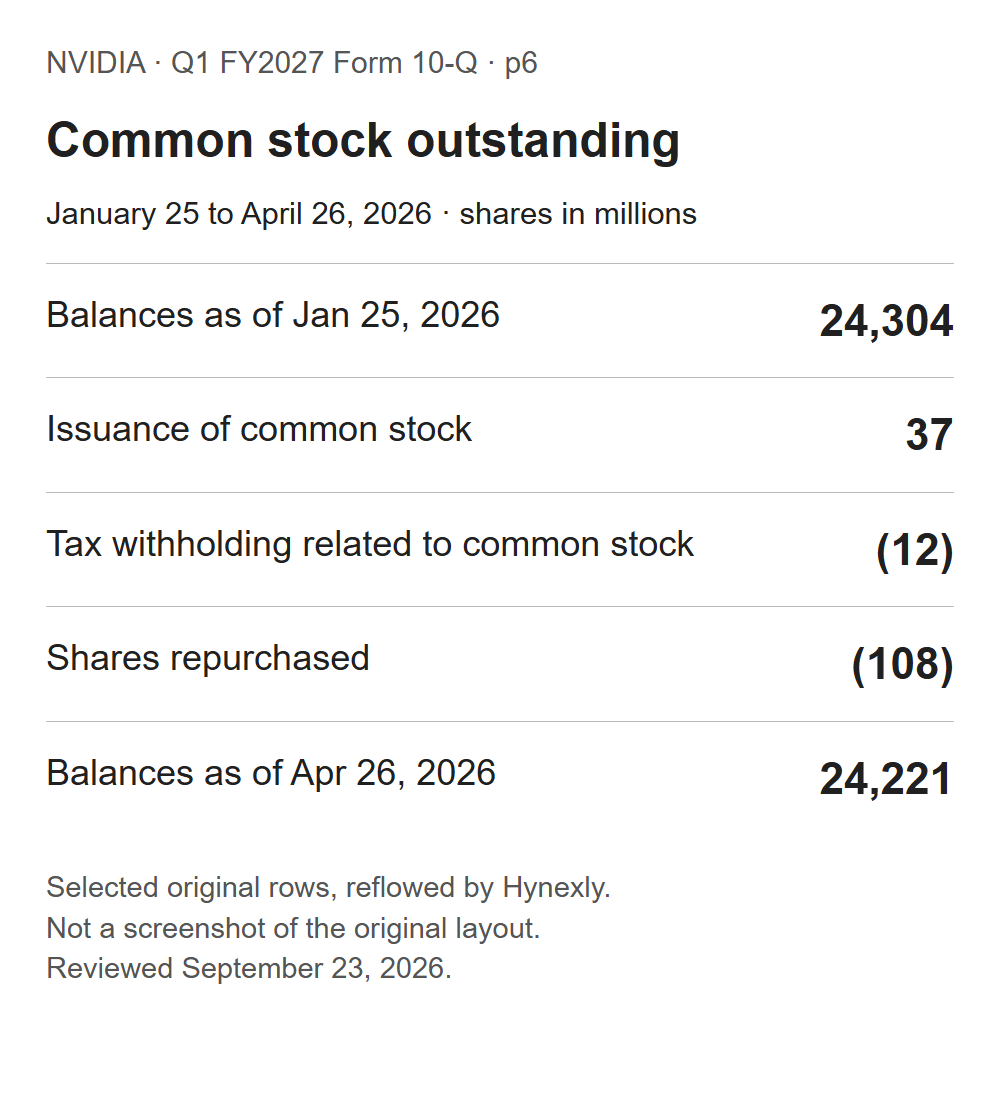
Reported short interest324.1M shares on 2026-07-15; 2.47 days to coverUp 4.5% from 2026-06-30, but only about 1.34% of the 24.2B shares outstanding on 2026-05-15

The CNN reading says the broad tape was cautious, not that Nvidia was individually oversold. The Treasury curves show a real discount rate high enough to make distant cash flows work harder. And the Nasdaq short-interest series shows rising bearish positioning, but not a crowded short: 2.47 days to cover and 1.34% of reported outstanding shares are modest beside the company's scale.

Hedge-fund evidence is mixed—and stale by design

The latest complete Form 13F quarter available at this article's review date was 2026-03-31, filed by 2026-05-15. Aggregating duplicate NVDA rows within each filing produces three different actions:

ManagerNVDA shares at 2026-03-31Change from 2025-12-31
Coatue Management6.33M−31.2%
Bridgewater Associates4.69M+21.4%
Appaloosa Management1.47M−13.4%

Source: SEC information tables for Coatue (2026-03-31, 2025-12-31), Bridgewater (2026-03-31, 2025-12-31), and Appaloosa (2026-03-31, 2025-12-31). Duplicate NVDA rows inside each filing were aggregated.

That is dispersion, not consensus. SEC Form 13F reports quarter-end long positions after a delay; it does not include short positions and cannot reveal what a manager owns today. It is useful for confirming that sophisticated holders made different sizing decisions, not for manufacturing a live hedge-fund forecast.

Public commentary points to the same distinction. Coatue's public-markets update remained constructive on AI agents as a major unlock even though its latest filing showed a smaller NVDA position.

Amundi's hedge-fund outlook estimated that directional long/short funds' AI exposure represented about 20% of beta and roughly 33% of year-to-date performance, then argued that the easy phase had passed and monetization and financing would receive more scrutiny. Neither item is an Nvidia rating. Together they say the AI theme remains important while selectivity, crowding, and financing costs matter more.

The company's own Q2 guide is a cleaner hurdle than an invented target price. Revenue is expected at $91B plus or minus 2%. The midpoint implies another 11.5% sequential increase. GAAP gross margin is expected at 74.9% plus or minus 0.5 percentage points.

Q2 checkpointCompany boundaryInvestor question
Revenue$91B ±2%Does demand clear the range without China Data Center compute?
GAAP gross margin74.9% ±0.5 ptsDoes the ramp preserve roughly 75% economics?
Free-cash-flow marginNo company guideDoes cash conversion remain close to the revenue engine?
Inventory and provisionsNo company guideDoes supply commitment stay proportionate to sales?

The China boundary is easy to miss. Nvidia's Q2 outlook assumes no China Data Center compute revenue. A result near the midpoint would therefore demonstrate continued growth without that market, but it would not prove China risk has disappeared. It would show that other demand absorbed the near-term gap.

This is where the valuation discussion becomes concrete. The market does not merely need a large revenue number. It needs revenue near the guide, gross margin near 75%, and cash conversion that does not break as the inventory base expands.

The operating hurdle and the market overlay answer different questions. Q2 results will test whether Blackwell is still funding its own ramp; rates, sentiment, short interest, and delayed manager positioning indicate how forgiving the market may be while waiting for that proof. Higher real yields or another increase in short interest would not invalidate the cash result by themselves, but they could make a revenue, margin, or inventory miss more expensive in the share price.

Risks to the Thesis

The strongest countercase begins with supply commitments. Raw materials increased 74.6% from the January quarter-end, much faster than total inventory. That can be rational during a constrained platform ramp. It can also become expensive if customer timing changes or a product transition leaves components with less economic value.

The second risk is that today's cash conversion benefits from unusually favorable economics. Q1 GAAP gross margin was 74.9%. If competitive accelerators, customer-designed silicon, networking costs, or a faster product cadence push that margin down, free cash flow can grow more slowly than revenue even when headline demand remains strong.

The third is concentration. Nvidia disclosed that three direct customers represented 21%, 17%, and 16% of quarterly revenue. These are direct billing relationships, not necessarily three end-demand pools, but they still make customer timing material.

The fourth is export control. China Data Center compute is effectively absent from the Q2 guide. New restrictions can affect the addressable market, product design, inventory recoverability, and the speed at which supply can be redirected.

RiskEvidence nowWhat would worsen it
Supply commitmentRaw materials at $6.647BRevenue slows while raw materials and purchase obligations keep rising
Margin compression74.9% GAAP gross marginActual margin falls below the 74.4% guide floor
Customer timingThree direct customers each above 10%A large customer's deployment moves out while inventory remains committed
Export controlsZero China Data Center compute in Q2 guideRestrictions create new charges or limit redirection of supply

None of these risks cancels the $48.554B cash result. They explain why one exceptional quarter is evidence, not immunity.

What Flips the Call

Nvidia is scheduled to report Q2 FY2027 results on 2026-08-26 at 2:00 p.m. PT. Three gates will decide whether the cash-conversion thesis strengthens.

Nvidia next-quarter control sheet for revenue, gross margin, cash conversion, inventory, and the China guidance boundary

Source-derived monitoring sheet using NVIDIA's Q2 guidance and official results calendar. The revenue and margin fields are company guidance; the cash-and-inventory field is an editorial review framework.

The conclusion strengthens if revenue lands inside the guided range, GAAP gross margin remains inside 74.4%–75.4%, and company-defined FCF continues to grow without a sharp fall in FCF margin. Inventory can rise, but its growth, cash use, and provisions should remain intelligible beside the revenue ramp.

It weakens if revenue misses the range, margin falls below the guide, or operating cash fails to follow earnings. It flips more decisively if inventory and purchase-obligation provisions rise while revenue growth slows: that would turn the current supply build from evidence of demand preparation into evidence of forecast error.

The sentence to update after the report is simple: Blackwell growth is still funding itself. Q1 supports it. Q2 must keep all three clocks moving together.

Method and Disclosure

This analysis uses Nvidia's earnings release and Form 10-Q. Company-defined FCF equals $50.344B − $1.757B − $0.033B = $48.554B. Q1 FY2027 FCF margin equals $48.554B / $81.615B = 59.49%; the prior-year figure equals $26.135B / $44.062B = 59.31%. Inventory growth equals $25.797B / $21.403B − 1 = 20.53%; sequential revenue growth equals $81.615B / $68.127B − 1 = 19.80%.

Price and volume use Nasdaq daily bars through the 2026-07-24 close. The 20-, 50-, 100-, and 200-day figures are simple closing-price averages. The volume-concentration proxy assigns a full session's volume to the $5 bin containing its typical price; it cannot reproduce an intraday volume profile. CNN sentiment and Treasury yields are dated broad-market context. Short interest uses the 2026-07-15 settlement record, and its 1.34% scale divides reported short shares by Nvidia's 2026-05-15 shares outstanding—not free float.

The 13F comparison aggregates rows for the same issuer within Coatue, Bridgewater, and Appaloosa filings for 2026-03-31 and 2025-12-31. It is delayed long-position disclosure, excludes shorts, and is not a current portfolio or forecast. All market, macro, sentiment, short-interest, and manager-positioning fields are excluded from the operating calculations. Inventory-versus-revenue is a directional matched-boundary comparison, not an accounting identity.

For an adjacent product-mix view, read why Nvidia's networking growth became harder to track. For a cross-company evidence framework, use the Nvidia, Broadcom, and Qualcomm reporting-clock comparison.

Facts, links, calculations, captures, and bilingual parity were reviewed on 2026-07-25. AI assisted with structure and consistency checks; final claims were tied to the cited sources. No sponsorship or affiliate relationship with Nvidia is disclosed. This is general information, not individualized investment advice, and it does not issue a rating or price objective.

Frequently Asked Questions

Nvidia reported $48.554 billion of free cash flow under its company definition: $50.344 billion of operating cash flow less $1.757 billion of purchases related to property, equipment, and intangible assets and $33 million of principal payments.

It is a monitoring signal, not a conclusion by itself. Inventory rose 20.5% from the prior quarter while revenue rose 19.8%, so the two moved at roughly the same pace. The risk increases if revenue slows while provisions and working-capital use keep rising.

Compare actual revenue with the $91 billion plus-or-minus 2% guide, GAAP gross margin with the 74.9% plus-or-minus 0.5-point guide, and then inspect free-cash-flow margin, inventory, provisions, and any change to the zero-China Data Center compute assumption.

The data did not show a crowded short. Reported short interest was 324.1 million shares on July 15, 2026, equal to 2.47 days to cover and about 1.34% of Nvidia's May 15 shares outstanding. It had risen 4.5% from June 30, so the direction was worth monitoring even though the scale remained modest.

The March 31, 2026 Form 13F filings were mixed: Coatue reduced its reported NVDA shares by 31.2% from quarter-end, Bridgewater increased them by 21.4%, and Appaloosa reduced them by 13.4%. Form 13F is delayed long-position disclosure, excludes shorts, and does not reveal a manager's current view.

Sources & evidence

Primary references cited or linked in this analysis. Click through to read each source in full.

  1. 01NVIDIA Q1 FY2027 earnings release
  2. 02NVIDIA Form 10-Q for the quarter ended April 26, 2026
  3. 03NVIDIA Q2 FY2027 financial-results event
  4. 04Nasdaq NVDA historical data
  5. 05Nasdaq NVDA short-interest history
  6. 06CNN Fear & Greed Index
  7. 07U.S. Treasury daily nominal and real yield curves
  8. 08SEC Form 13F data sets and filing guidance
  9. 09Coatue Public Markets Update, May 6, 2026
  10. 10Amundi Hedge Fund Outlook H2 2026
  11. 11sec.gov/Archives/edgar/data/1135730/000091957426003501/infotable.xml
  12. 12sec.gov/Archives/edgar/data/1135730/000091957426001239/infotable.xml

Continue the research

Choose the next evidence gap to investigate.
Editorial context photo looking through suspension-bridge cables

Market & Macro5 min read

Nvidia Networking Revenue Hit $14.8B—Then the Reporting Map Changed

Nvidia networking was 19.7% of Q1 FY2027 Data Center revenue and 27.3% of its year-over-year growth. The new Hyperscale/ACIE reporting lens changes what investors can verify next.

Read the next analysis
Share:
H
Hynexly Research

Owner-operated US market research desk

Owner-operated US stock and market coverage built from public filings, SEC EDGAR, official reports, company releases, and market data.

  • Source-grounded research with primary filings & official reports
  • Bilingual EN / KO editorial workflow
  • Manual editorial QA before publish

Your privacy choices

Choose whether Hynexly may use Google Analytics and personalized AdSense cookies. Necessary cookies always stay on. Change your choice anytime in our Privacy Policy.