Nvidia Still Reports Networking Growth. The Comparison Got Harder.
Nvidia disclosed 18% networking growth in Q2. A $5.181B revision to Q1 customer categories explains why the old and new revenue tables cannot be mixed.
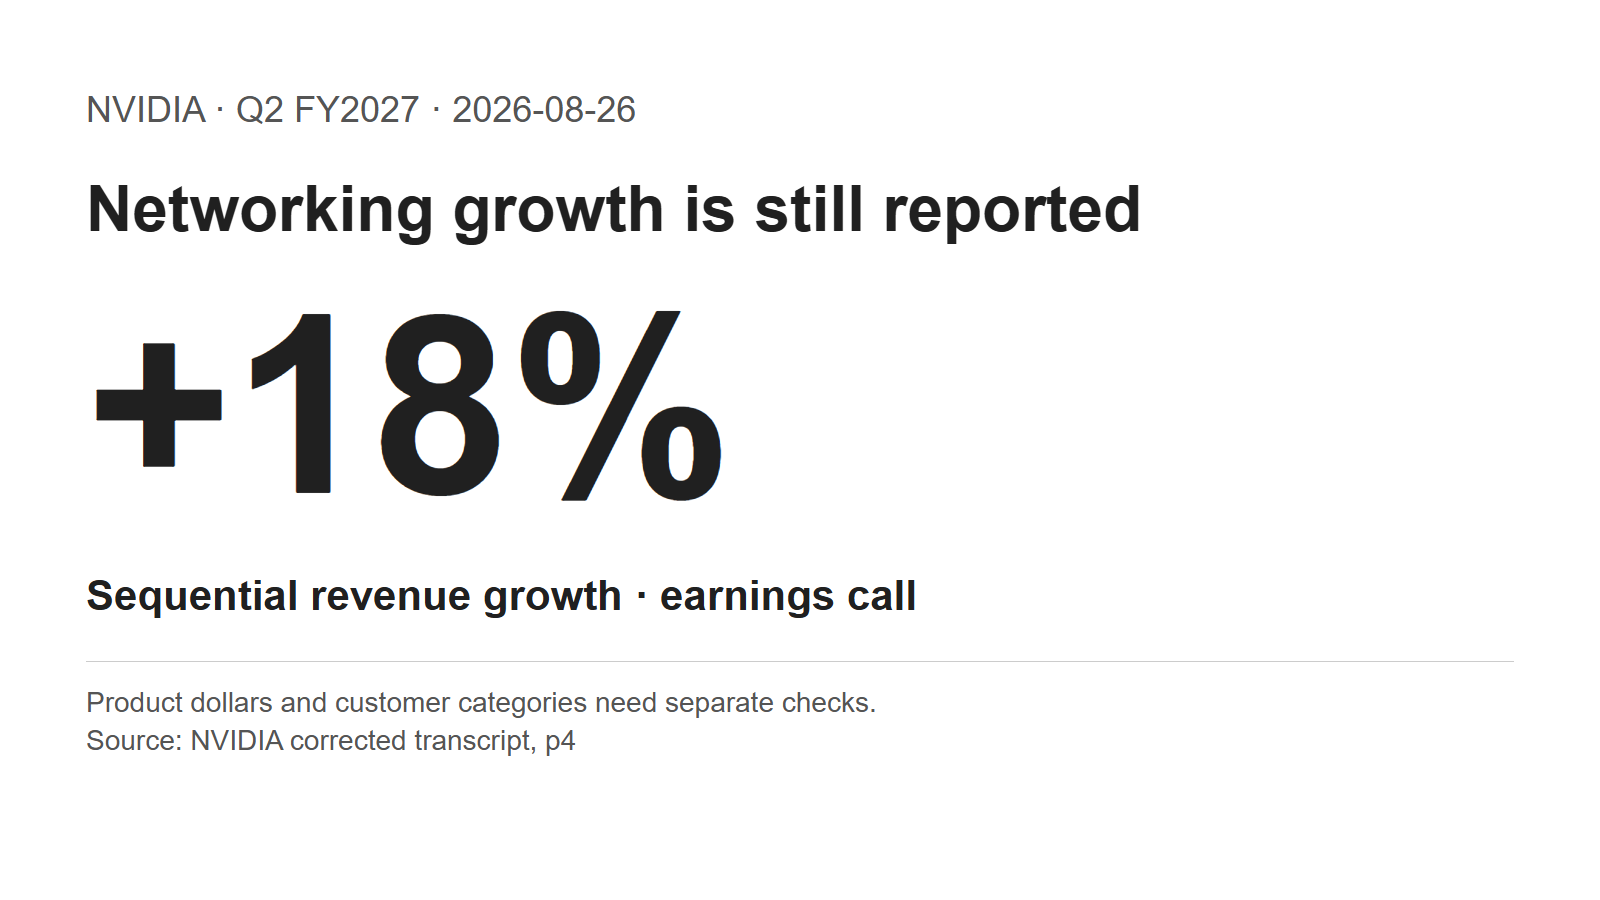
Nvidia's networking business did not disappear from its disclosures. On the Q2 earnings call, the company said revenue grew 18% from the previous quarter. The absence of a separate dollar line in the latest earnings tables is not evidence that networking stopped growing.
The harder problem is comparison. Nvidia also changed which customers belong in each reporting category, including the figures for the previous quarter. Reusing the old table gives a different growth story.
Check the baseline before the growth story
Networking demand still has a positive company-reported signal. But investors need two separate checks: what Nvidia sells, and who buys it. The latest customer split cannot reconstruct the missing product-dollar detail, and it needs its own restated history to be useful.
The growth figure is still in the call
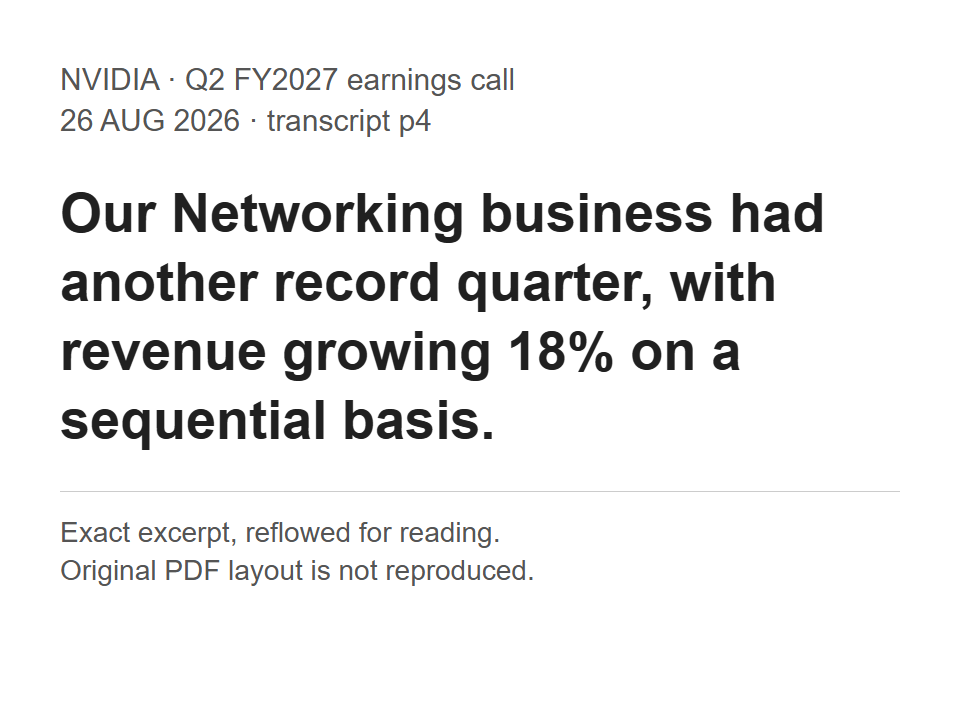
Source capture, reflowed excerpt: NVIDIA corrected Q2 call transcript, August 26, 2026, p4; captured September 23. Exact wording, reflowed rather than original PDF layout. The 18% is sequential networking revenue growth.
This corrects the earlier version of this article, which overstated the loss of product visibility. A company statement of growth survives even though the reviewed Q2 release and financial tables do not supply the old standalone networking revenue amount.
The last dollar anchor in that product split is $14.8B for Q1 FY2027, from the May release. Multiplying a rounded historical amount by a later growth rate would produce an estimate, not a newly reported Q2 figure. It would still tell us nothing about networking's own profit margin. The next product disclosure needs both an amount and a definition.
The same quarter now has a different customer split
Nvidia reports large cloud customers as Hyperscale. Its other Data Center category is AI Clouds, Industrial & Enterprise, or ACIE. These are customer groupings, not separate networking and computing businesses.
The Q2 filing says one unnamed company moved from ACIE to Hyperscale after its business model changed. Nvidia also recast the earlier periods. Here are the two versions of Q1 beside the new quarter.
| Data Center customer group | Q1 originally reported | Q1 recast in Q2 filing | Q2 reported |
|---|---|---|---|
Hyperscale | $37.869B | $43.050B | $48.710B |
ACIE | $37.377B | $32.196B | $40.313B |
Total | $75.246B | $75.246B | $89.023B |
Exact-value comparison: Q1 ended April 26, 2026; Q2 ended July 26, 2026. Source: Q1 Form 10-Q and Q2 Form 10-Q, MD&A p27. USD billions converted from the original USD-million tables.
The change between the two Q1 columns is $5.181B in each direction. Hyperscale gains that amount; ACIE loses it. The total stays put. This is revenue reassigned within a historical table, not an extra sale or a cash transfer in Q2.
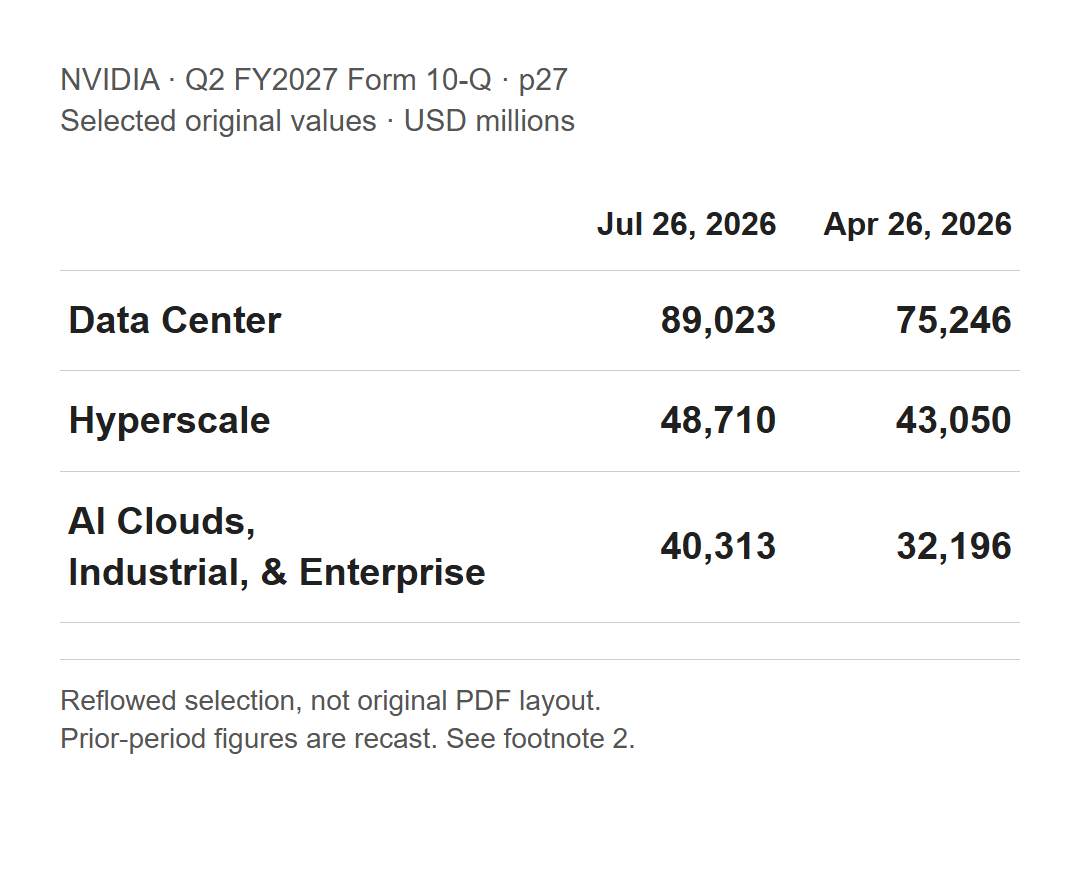
Source capture, selected values: NVIDIA Q2 Form 10-Q, MD&A p27, quarter ended July 26, 2026; captured September 23. Original values in USD millions, selected and reflowed, not original PDF layout. Footnote 2 explains the customer reclassification and recast history.
The filing gives a usable comparison; an old spreadsheet is where the problem can enter. Its footnote does not identify the customer. Guessing a name adds no evidence. At the next filing, check the comparison column and footnotes again before calculating growth.
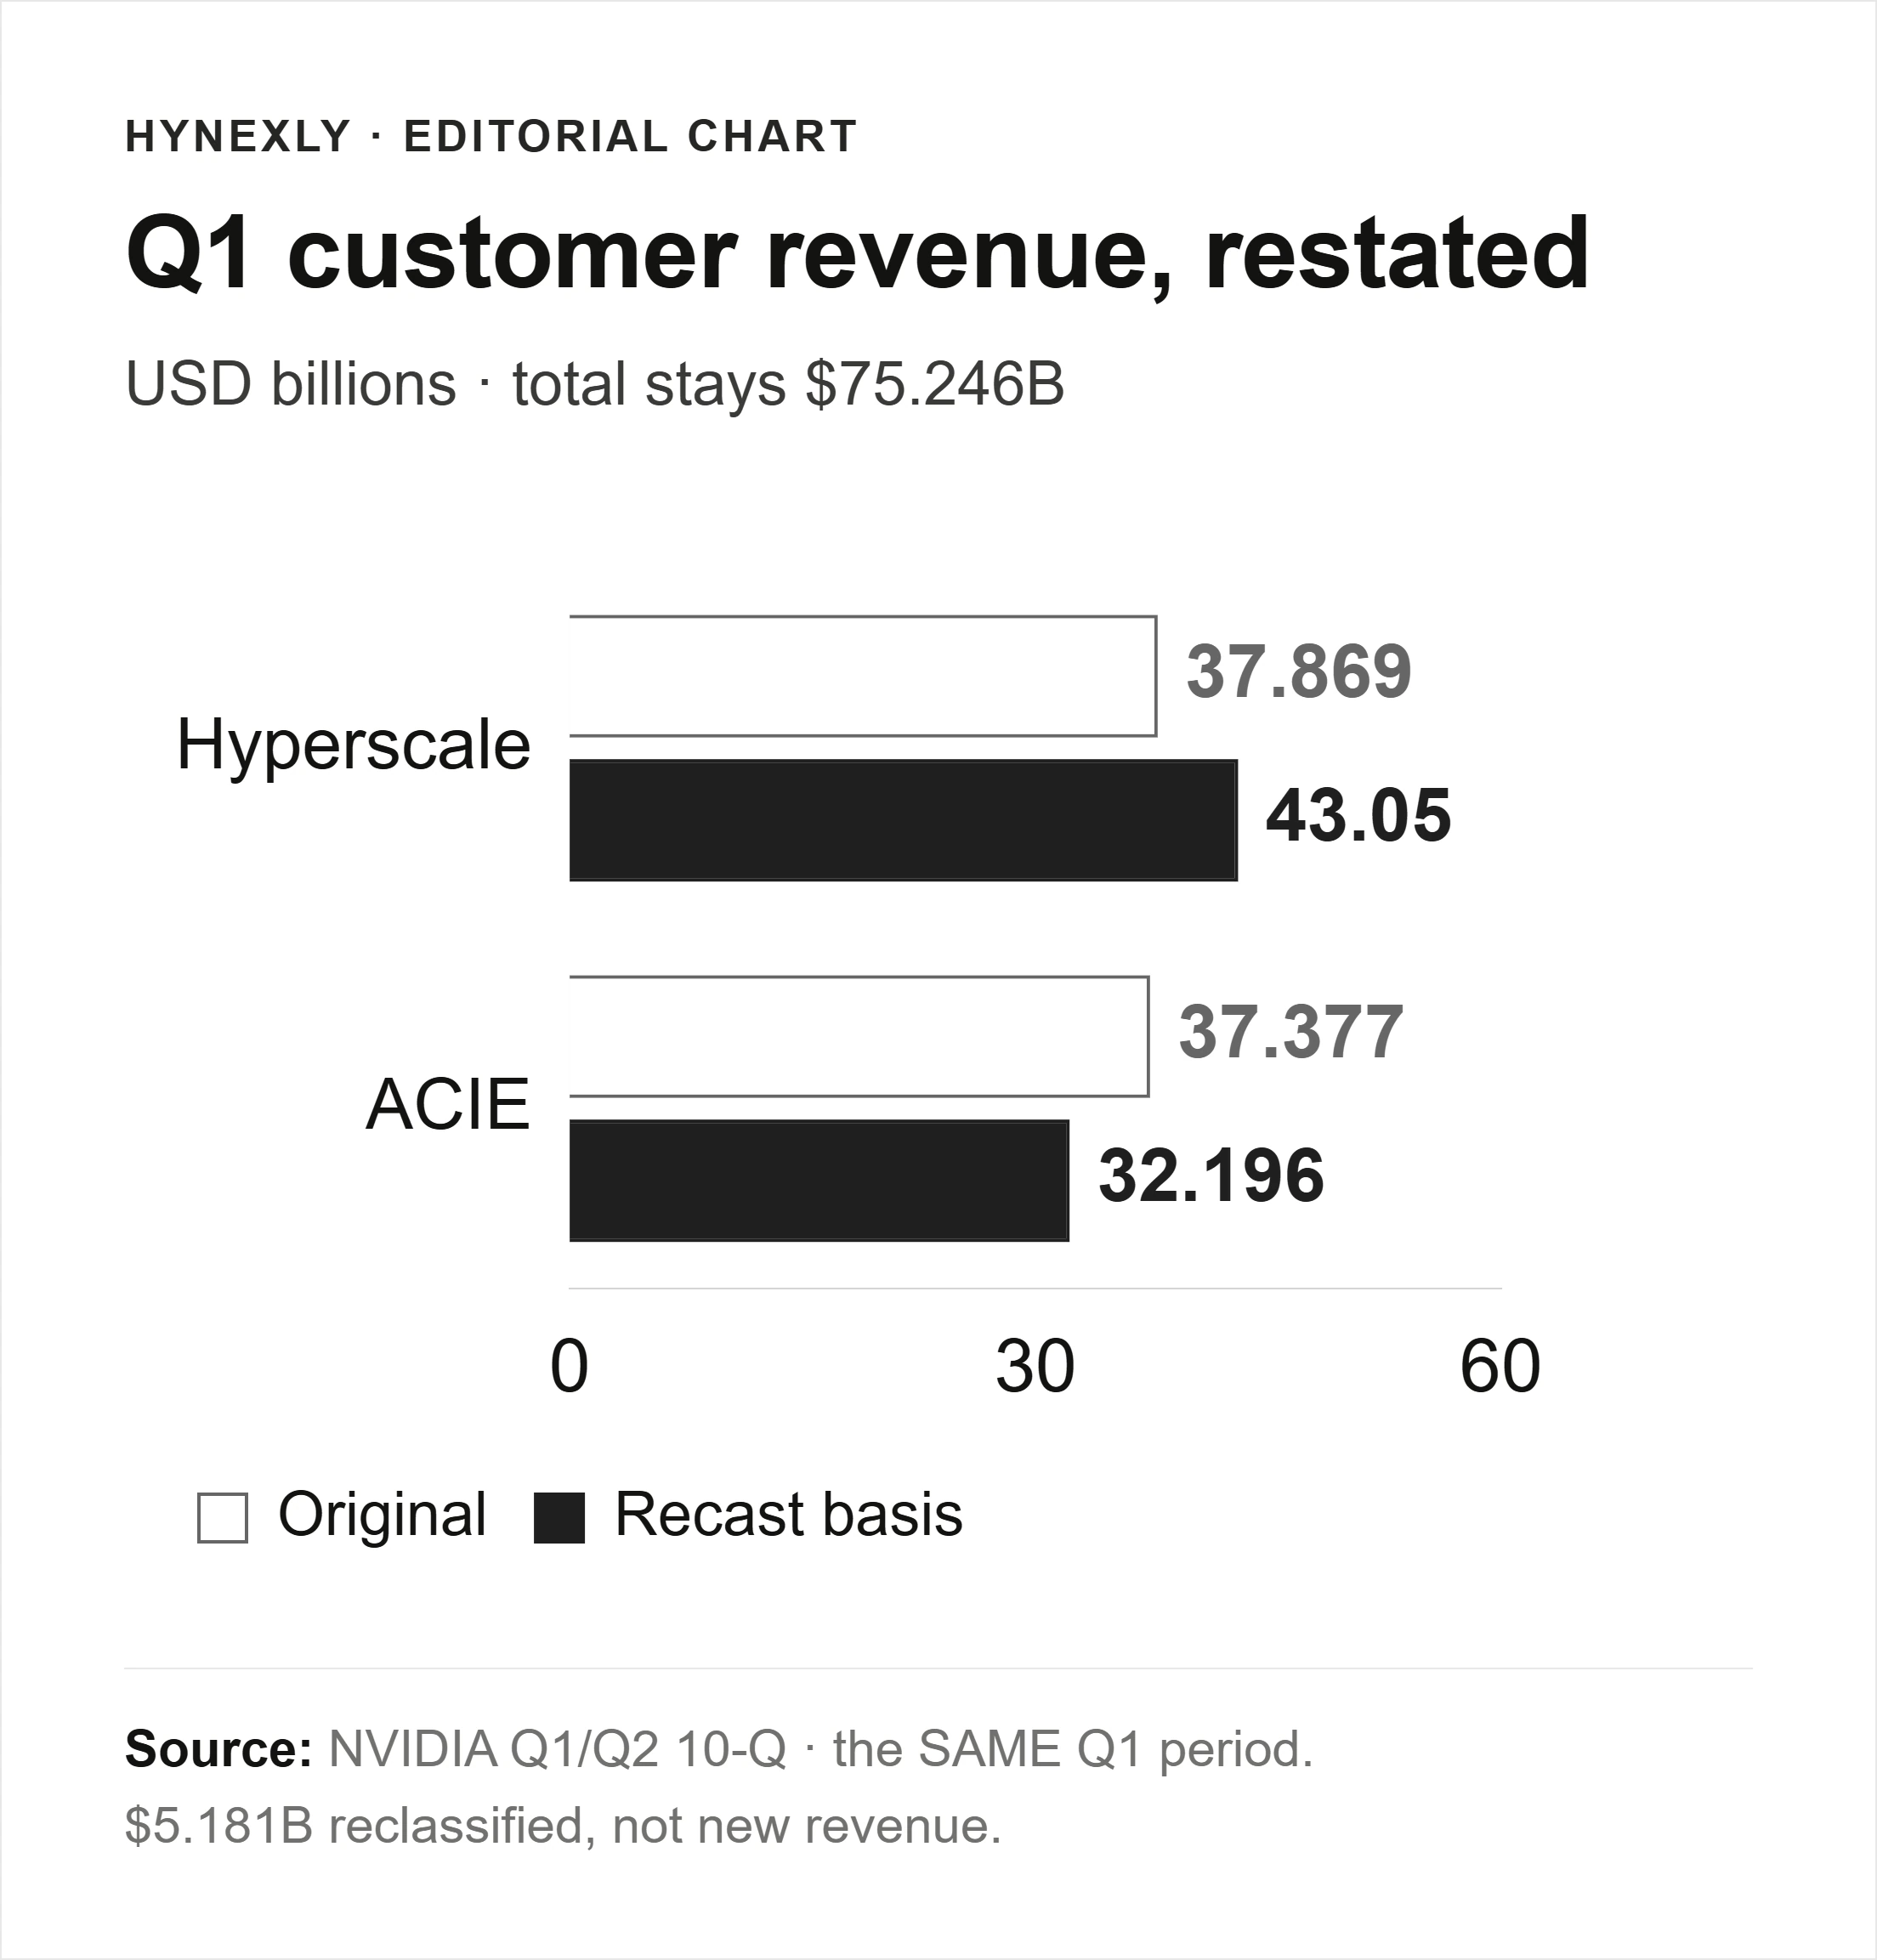
Editorial calculation from the Q1 filing and Q2 filing: $43.050B − $37.869B = $37.377B − $32.196B = $5.181B. Both versions describe the same Q1 and total $75.246B. ACIE means AI Clouds, Industrial & Enterprise.
A mixed baseline reverses the apparent winner
Compare Q2 with the original Q1 table and Hyperscale looks like the faster-growing group. Use the recast Q1 figures and ACIE grows faster. No change in Q2 revenue is needed to reverse that ranking; only the denominator changes.
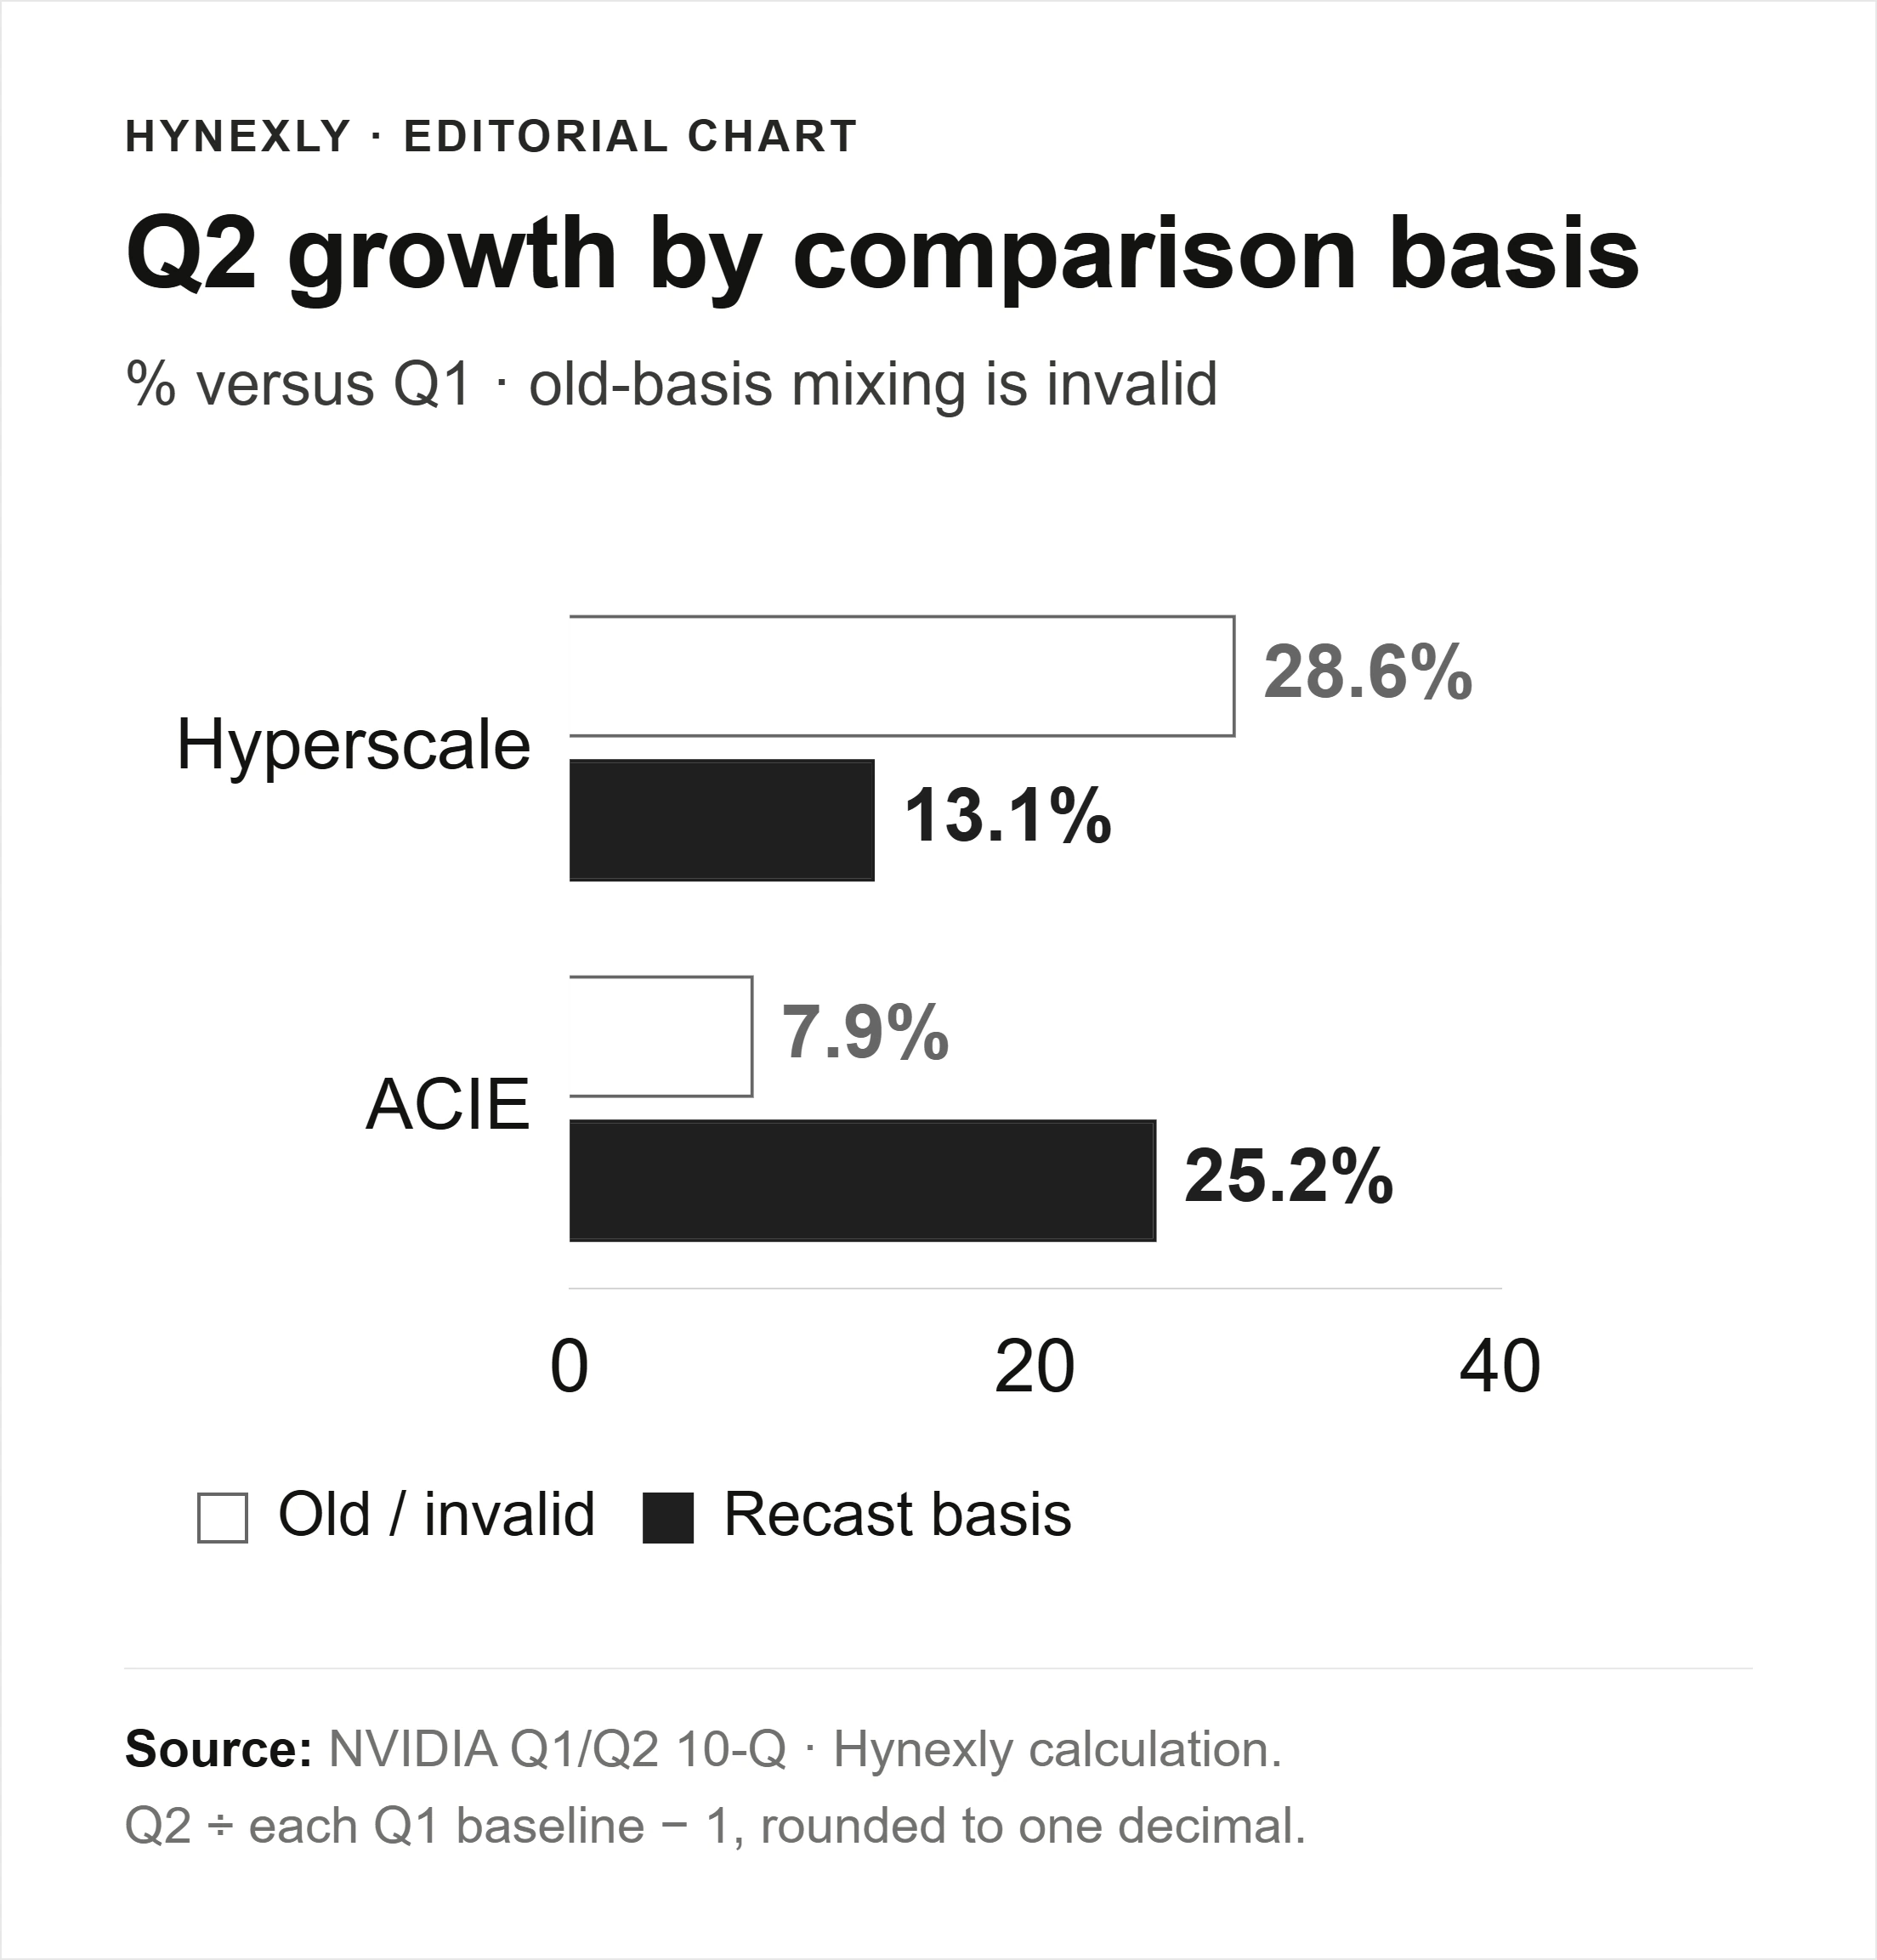
Editorial calculations: Q2 ÷ Q1 − 1. Mixed classifications give Hyperscale 28.6% and ACIE 7.9%; the comparable recast basis gives 13.1% and 25.2%. Rates are rounded to one decimal. Source: Q1/Q2 Forms 10-Q; the Q2 CFO commentary confirms the recast baseline.
Both groups grew on the comparable basis. That supports a broader demand story than a single growing customer category, but cannot tell us which products each group bought. The AI revenue reading guide explains why matching definitions comes before ranking growth rates.
What the full-stack investment case still needs
A case for durable earnings from selling computing and networking together needs repeat demand and retained profit. The reported networking growth supports the demand side. It does not measure how much customers would buy without the wider system, or the profit earned on those network products.
| Disclosure lens | What it can answer | What it cannot answer |
|---|---|---|
Networking product disclosure | Product revenue growth | A separately disclosed networking margin |
Hyperscale / ACIE | Customer-category revenue on matched definitions | Product sales within each category |
Compute & Networking segment | Results for a combined reportable segment | Standalone networking revenue |
Nvidia's $88.299B Q2 Compute & Networking segment revenue is especially easy to misread. “Networking” in that combined label does not make it networking product sales. Its reporting boundary also differs from the Data Center market-platform total.
This article does not use a live share price, analyst consensus or valuation multiple, so it makes no claim that the market has priced the change correctly. The Q2 results analysis addresses the separate company-wide earnings and cash question.
Where this reading could fail
The strongest challenge to the visibility concern is already present: Nvidia still reports networking growth, and both customer groups expanded on a comparable basis. Further product detail would narrow the concern again. Less tabular detail should not be treated as evidence of a hidden contraction.
The operating risk runs in the other direction. Nvidia's Q2 filing describes customer deployments depending on power, land, equipment and financing. A disclosed delay or weaker subsequent product growth would matter more than a renamed category. Check the next earnings materials for that evidence rather than assuming it has already happened.
What would change the assessment
The most useful new disclosure would be a comparable networking dollar series with a clear product definition. The August call scheduled the next earnings call for November 17, 2026; confirm that date on investor relations before relying on it.
| Next disclosure | Current reference | What changes the reading |
|---|---|---|
Networking product update | Q1 $14.8B; Q2 sequential growth 18% | Comparable dollar detail reduces the visibility gap; a reported contraction weakens the demand case |
Customer table and footnotes | Recast Q1 history in the Q2 filing | Growth holds across both groups without relying on classification changes |
Q3 company revenue | Company outlook $108B ±2% | Actual results and deployment commentary test momentum, not a networking margin |
The Q3 outlook assumes no China Data Center compute revenue. It is company guidance, not consensus or an achieved result. The practical habit is simpler than any forecast: use the comparison period supplied with the latest table, then check what its labels include.
Method and limits
Reviewed September 23, 2026. Original publication date retained. This revision corrects the earlier claim about lost networking visibility, replaces expired Q2 guidance and removes an unsupported networking-share threshold. Calculations use explicit Q1 comparison columns in the Q2 MD&A, corroborated by the CFO commentary, rather than subtracting rounded half-year totals. Growth rates use unrounded filing inputs before display rounding.
Sources are listed above; excerpts retain original wording or values and disclose layout changes. This AI-assisted article was source-checked and edited. It provides general research, not an investment rating, price target or individualized advice.
Primary references cited or linked in this analysis. Click through to read each source in full.
- NVIDIA Q1 FY2027 earnings release, May 20 2026
- NVIDIA Q1 FY2027 Form 10-Q
- NVIDIA Q2 FY2027 Form 10-Q
- NVIDIA Q2 FY2027 CFO commentary
- NVIDIA Q2 FY2027 earnings release, August 26 2026
- NVIDIA Q2 FY2027 corrected earnings-call transcript, August 26 2026
- investor.nvidia.com/files/doc_financials/2027/NVDA-2027-Q2-10Q-Final-including-exhibits.pdf
Choose the next evidence gap to investigate.
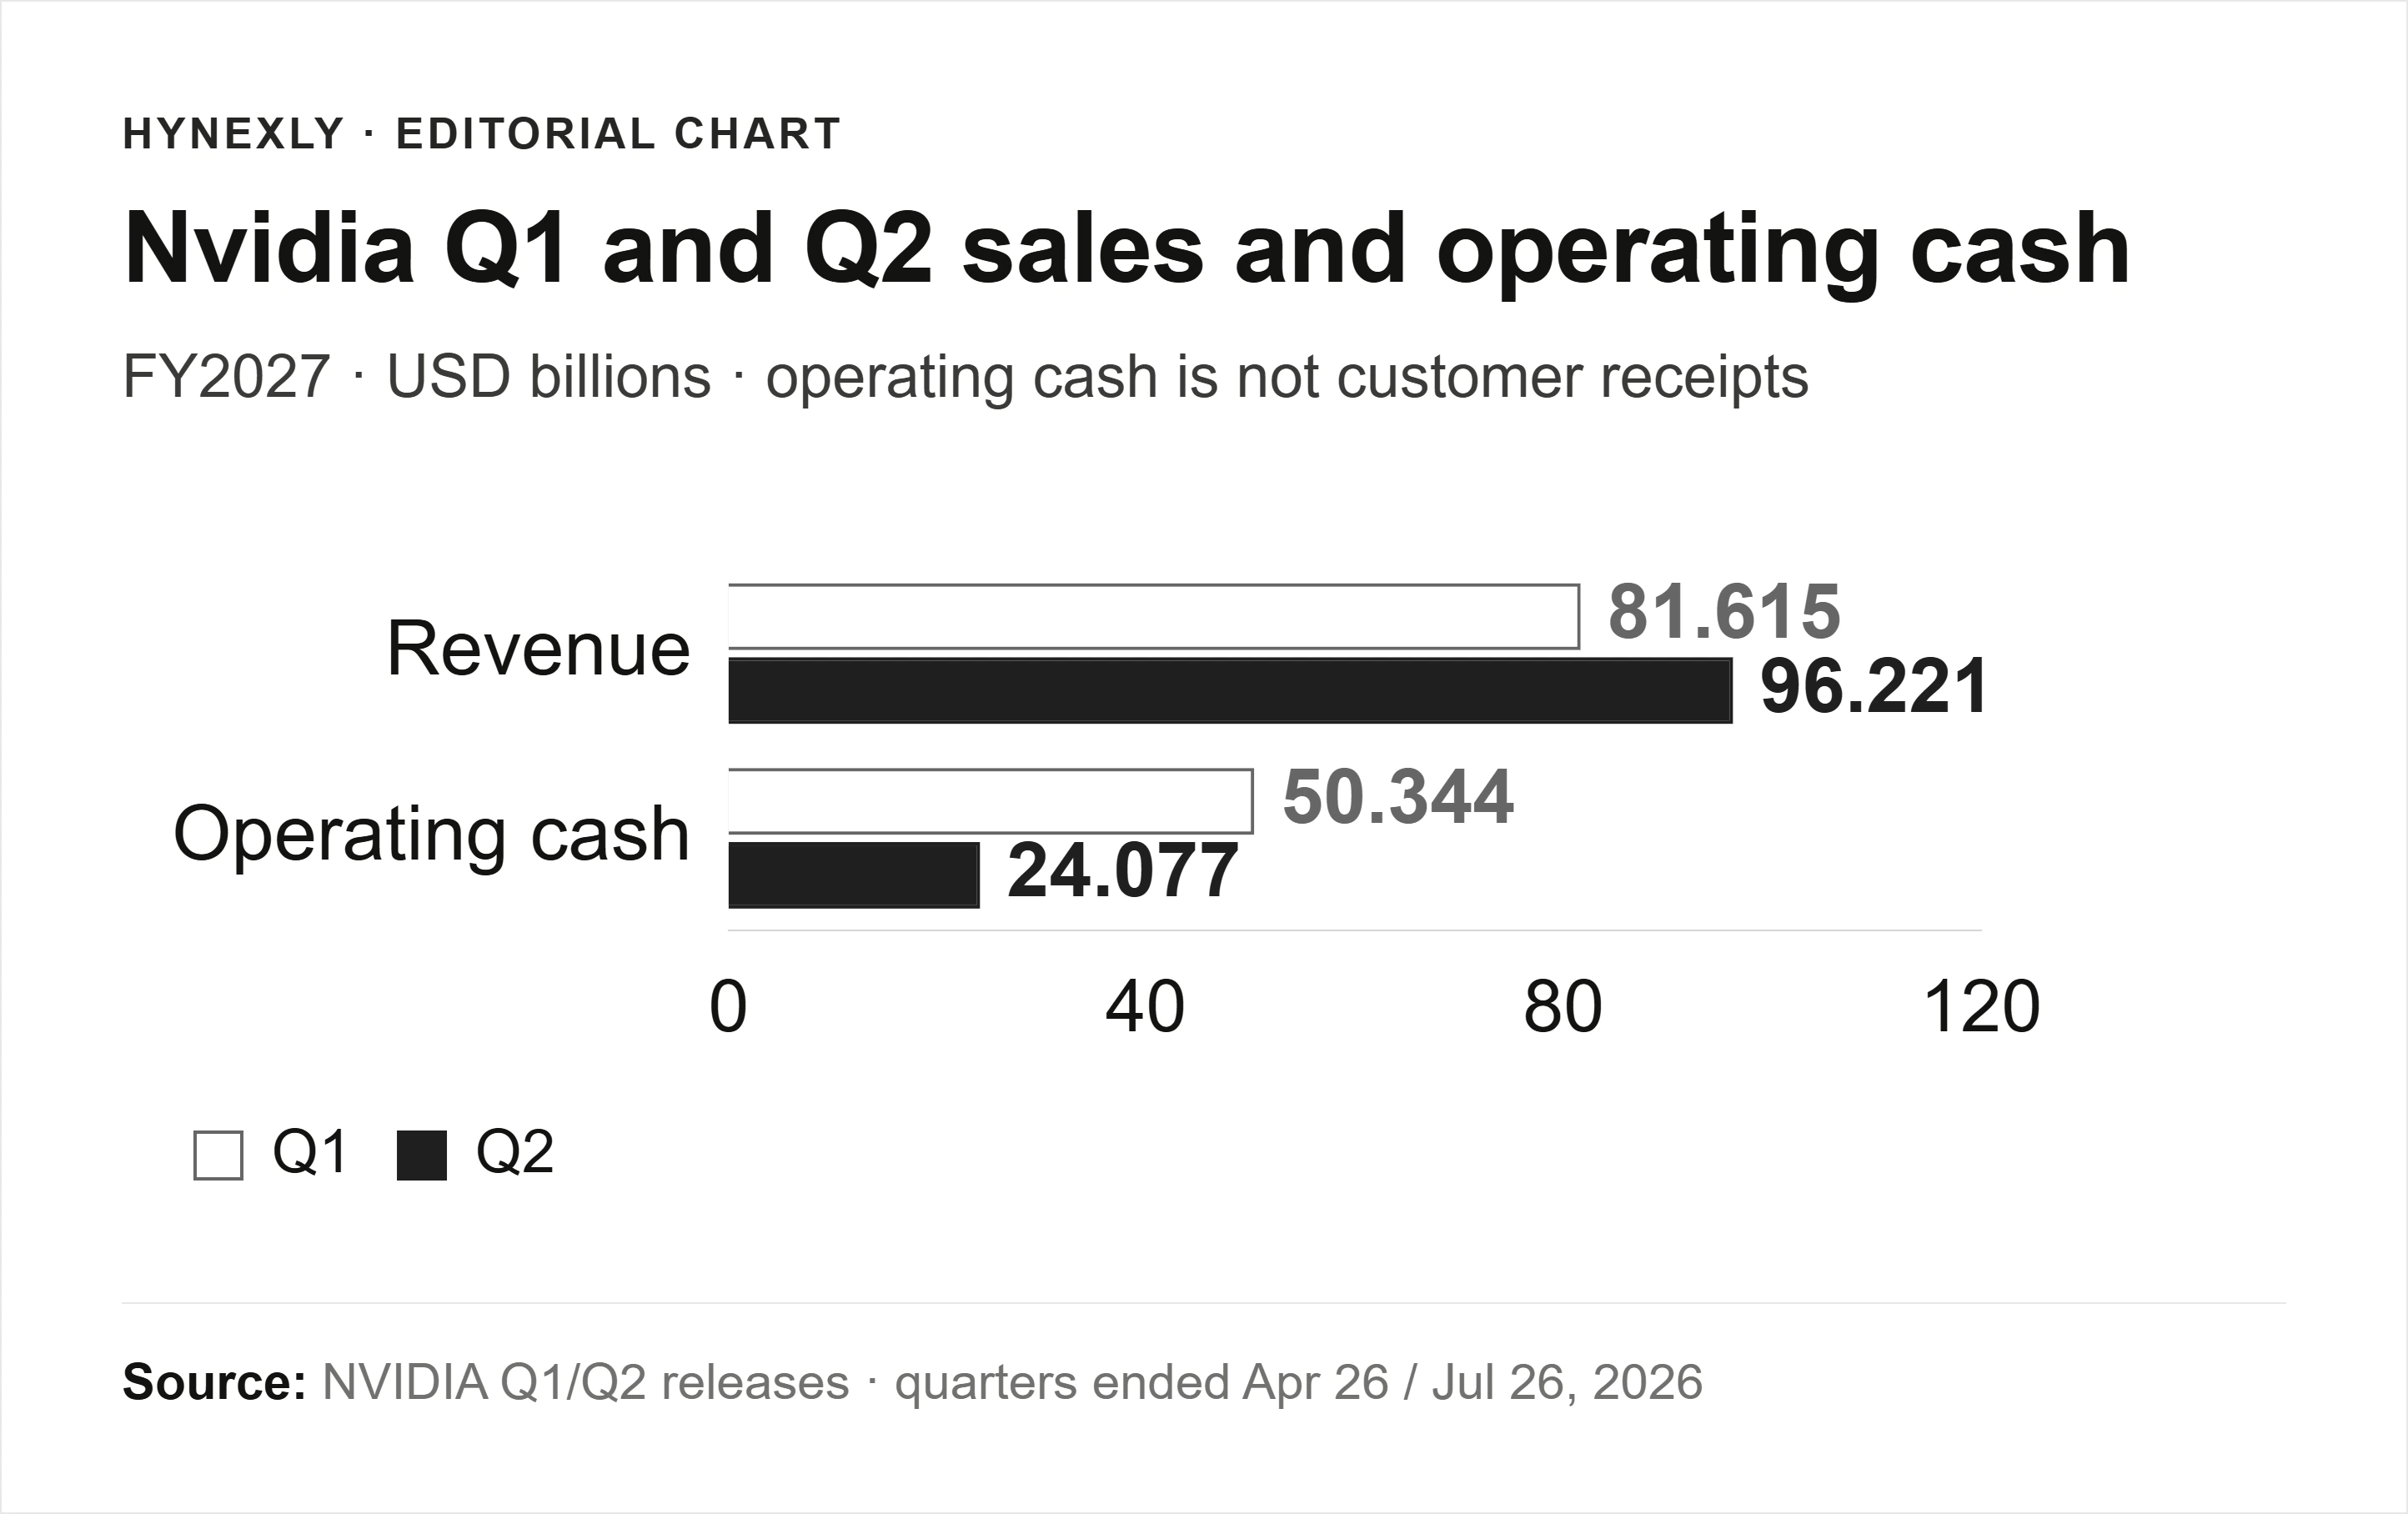
Nvidia's Sales Grew. Why Did Operating Cash Flow Halve?
Nvidia's Q2 sales rose while operating cash fell. A $20.1B increase in receivables-related cash use explains much of the gap, without proving customer default.
Owner-operated US market research desk
Owner-operated US stock and market coverage built from public filings, SEC EDGAR, official reports, company releases, and market data.
- Source-grounded research with primary filings & official reports
- Bilingual EN / KO editorial workflow
- Manual editorial QA before publish