Coinbase's USDC Revenue Chart Leaves Out a Key Cost
Coinbase's stablecoin business cushions trading, but customer rewards and new shares complicate the benefit to shareholders. A Q2 filing check explains both.
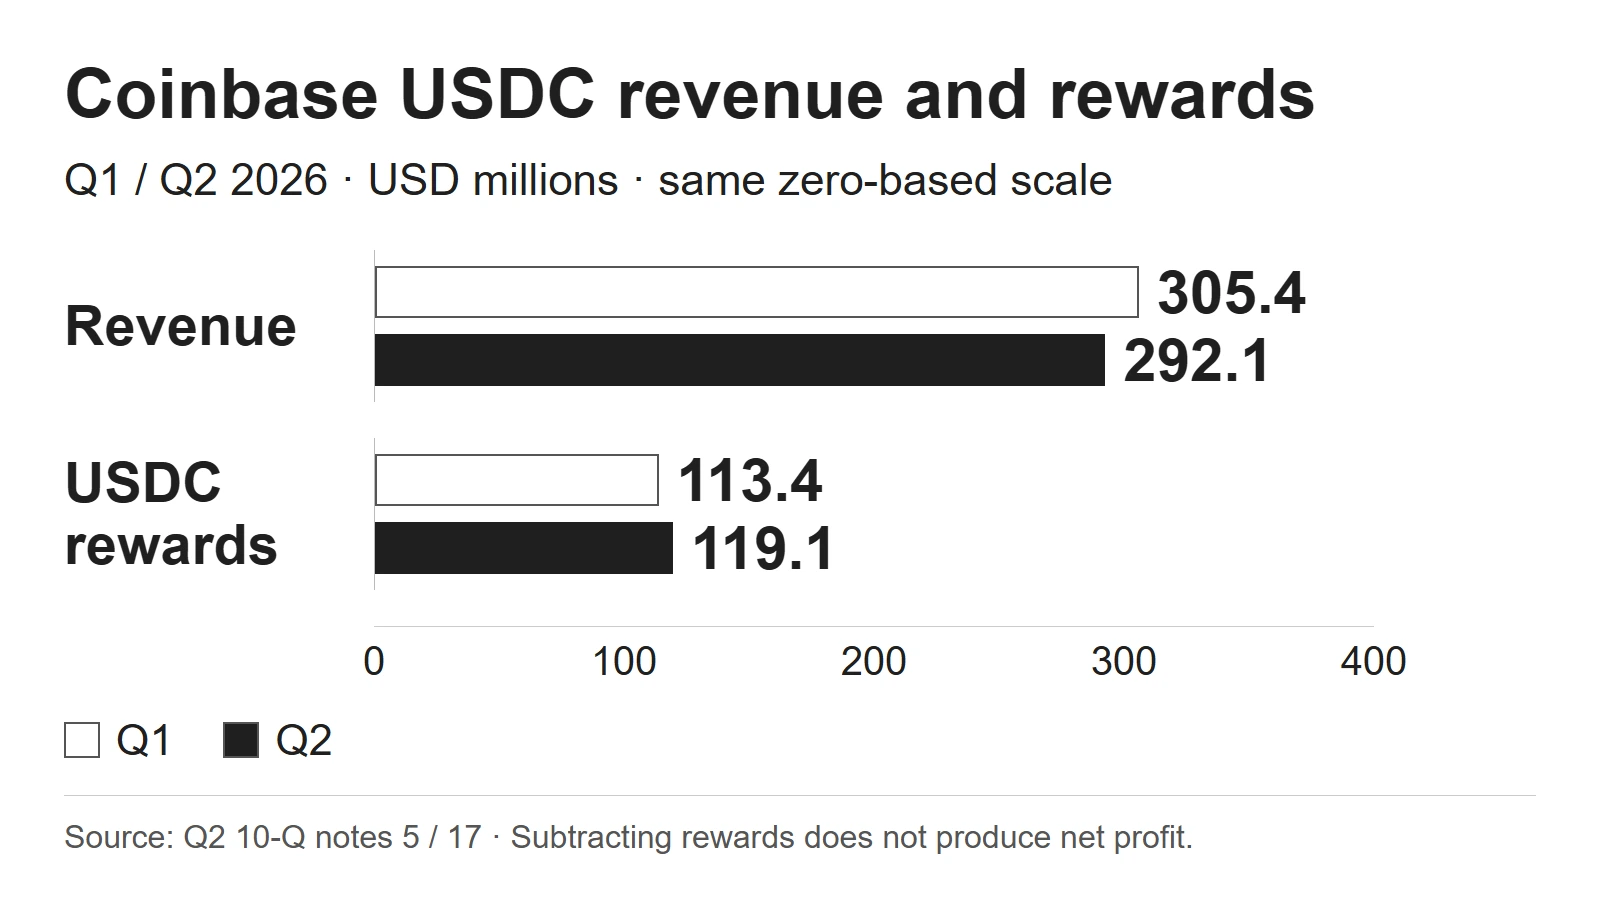
Coinbase recorded $292.1M of stablecoin revenue in the second quarter. That is not the amount shareholders get to keep.
USDC, a token designed to track the dollar, brings Coinbase revenue through its arrangement with Circle. Coinbase also pays rewards to eligible customers holding it. Those payments appear elsewhere in the filing, under sales and marketing.
Read the revenue and the cost together
Stablecoins help cushion Coinbase's trading business, but Q2 did not establish stronger per-share economics. Revenue after customer rewards weakened, and the quarter-end share count rose despite repurchases. Better results on both measures in the next filing would strengthen the case.
Start with the apparently encouraging mix shift. Subscription and services, which includes stablecoin revenue, took a larger share of net revenue. Yet the business brought in fewer dollars. Its share rose because transaction revenue fell faster.
| USD millions, except share of net revenue | Q1 2026 | Q2 2026 |
|---|---|---|
Transaction revenue | 755.825 | 599.156 |
Subscription and services | 583.523 | 555.145 |
Subscription share of net revenue | 43.6% | 48.1% |
Calculated from 10-Q note 5: Q1 equals the six-month amount less Q2. Net revenue is transaction plus subscription and services; it excludes corporate interest and other income.
A bigger percentage can coexist with a smaller business. This mix change shows relative resilience, not growth through a trading downturn. It is a reason to inspect the stablecoin engine more closely, not to dismiss diversification.
The USDC cost sits in another table
The filing reports USDC rewards as an expense. That is different from the blockchain rewards revenue Coinbase earns from staking, where customers commit crypto assets to help operate a network. Subtracting the wrong “rewards” line would mix two businesses.
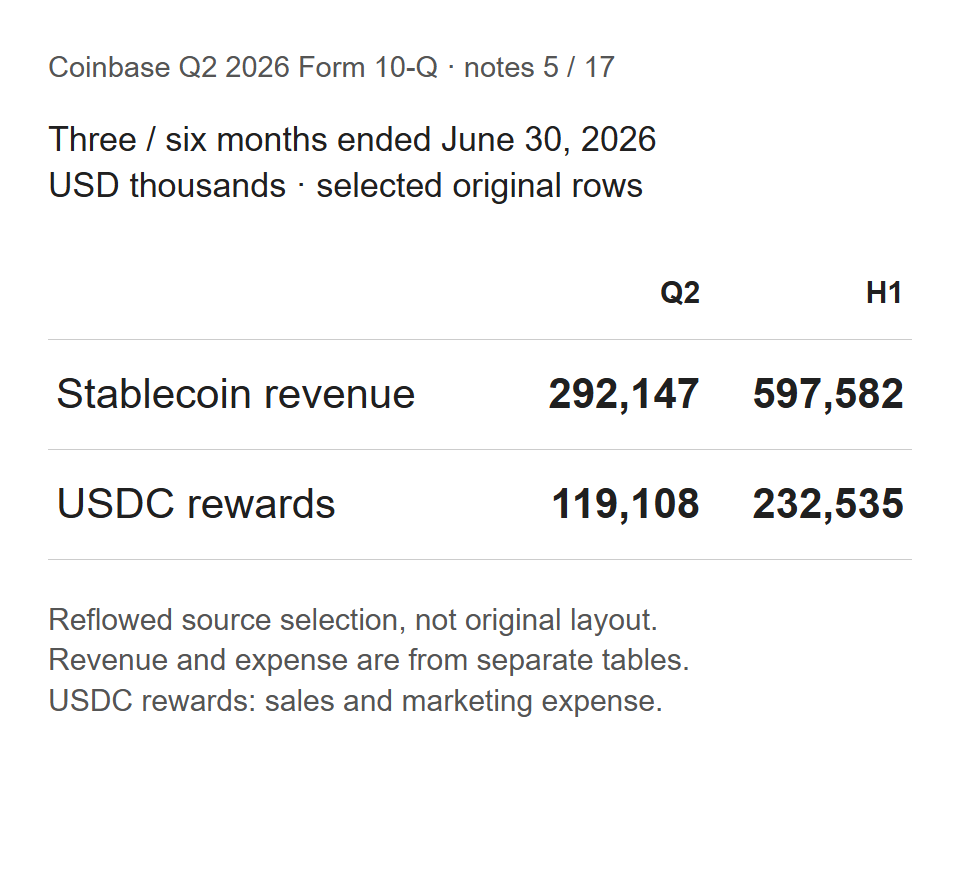
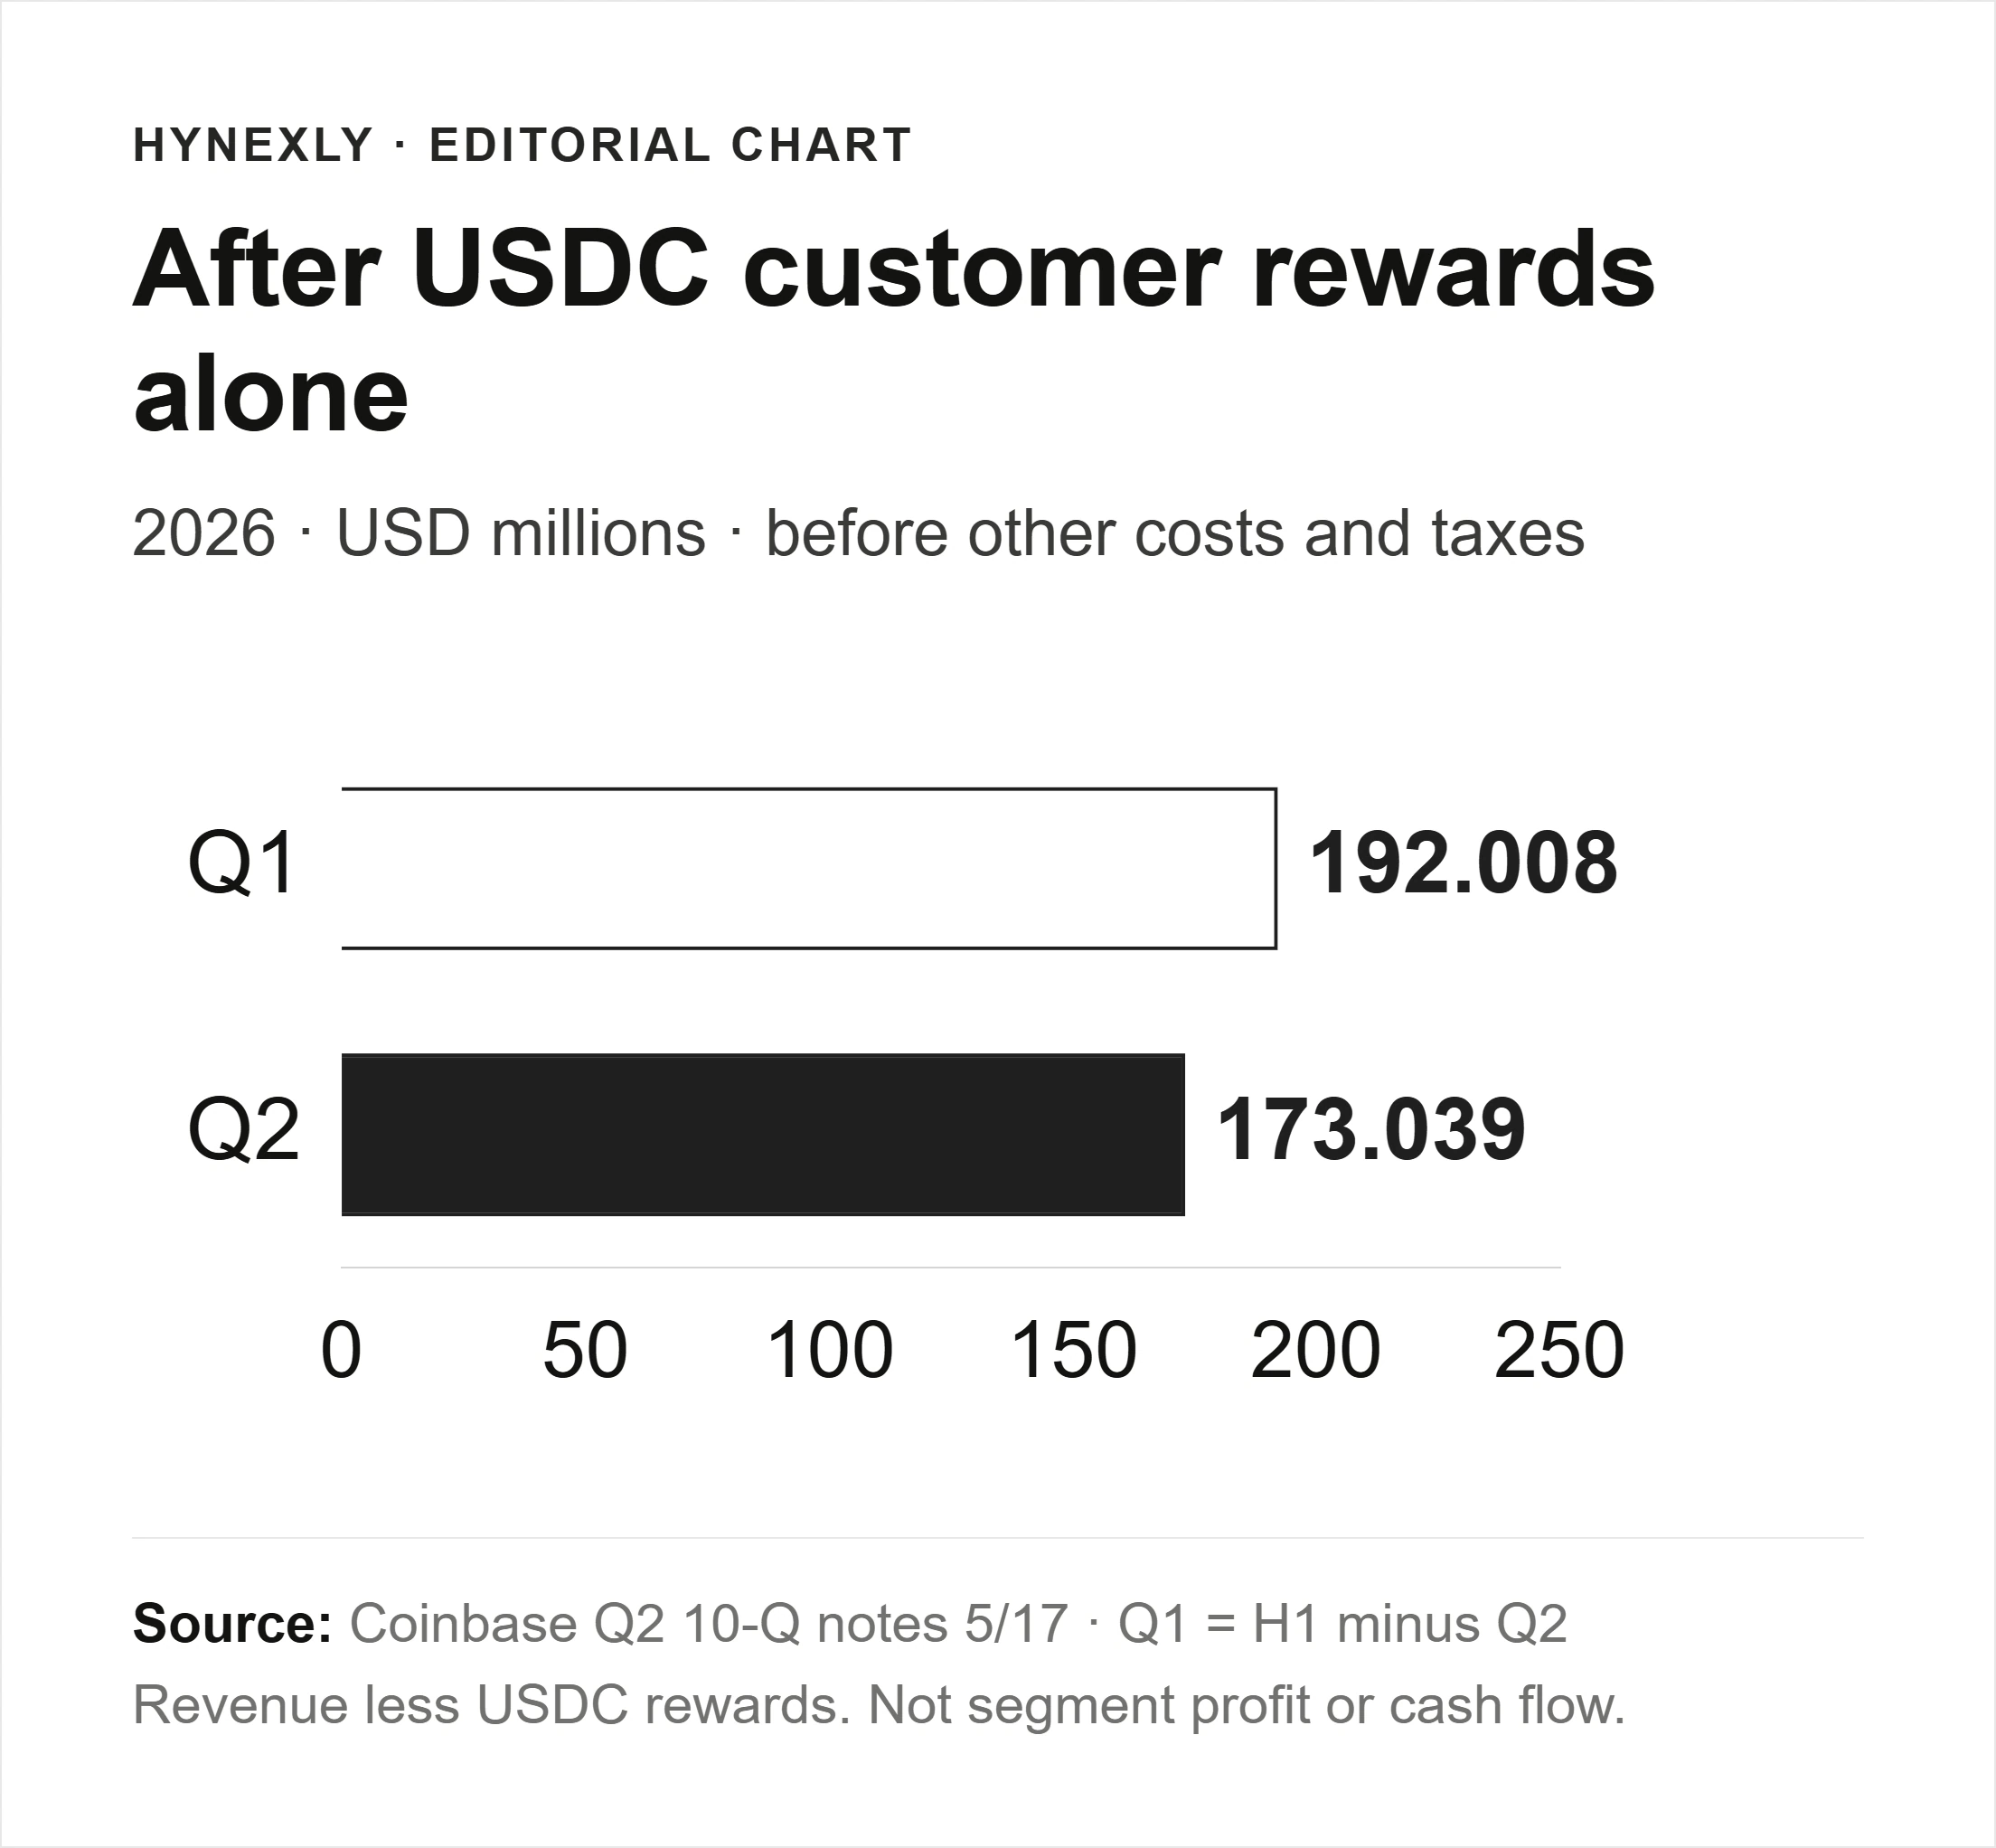
Subtract only customer USDC rewards and Q2 stablecoin revenue becomes $173.0M before other costs. The corresponding Q1 figure was higher. This calculation does not reveal the division's bottom line: it leaves out technology, administration, other operating costs and taxes.
The comparison is deliberately modest. It asks whether this revenue line is improving after one identifiable expense, using the same period and reporting basis. It does not assume that every dollar of revenue and rewards relates to an identical pool of USDC balances.
Coinbase reported a record $20B average USDC balance in its products. The earnings deck, slide 26, says lower interest rates and lower off-platform balances offset that growth. Adoption can improve while the revenue associated with it weakens.
The Circle contract analysis explains the issuer's side of this arrangement. For Coinbase, the useful follow-up is the combination of balances, revenue and customer rewards—not a revenue-to-platform-balance ratio pretending to be a clean fee rate.
A buyback can coexist with more shares
The second check belongs in the equity statement. Q2 common shares increased by 371,000. Coinbase bought shares, but equity-award issuance exceeded the combined reduction from repurchases and shares withheld to settle award taxes.
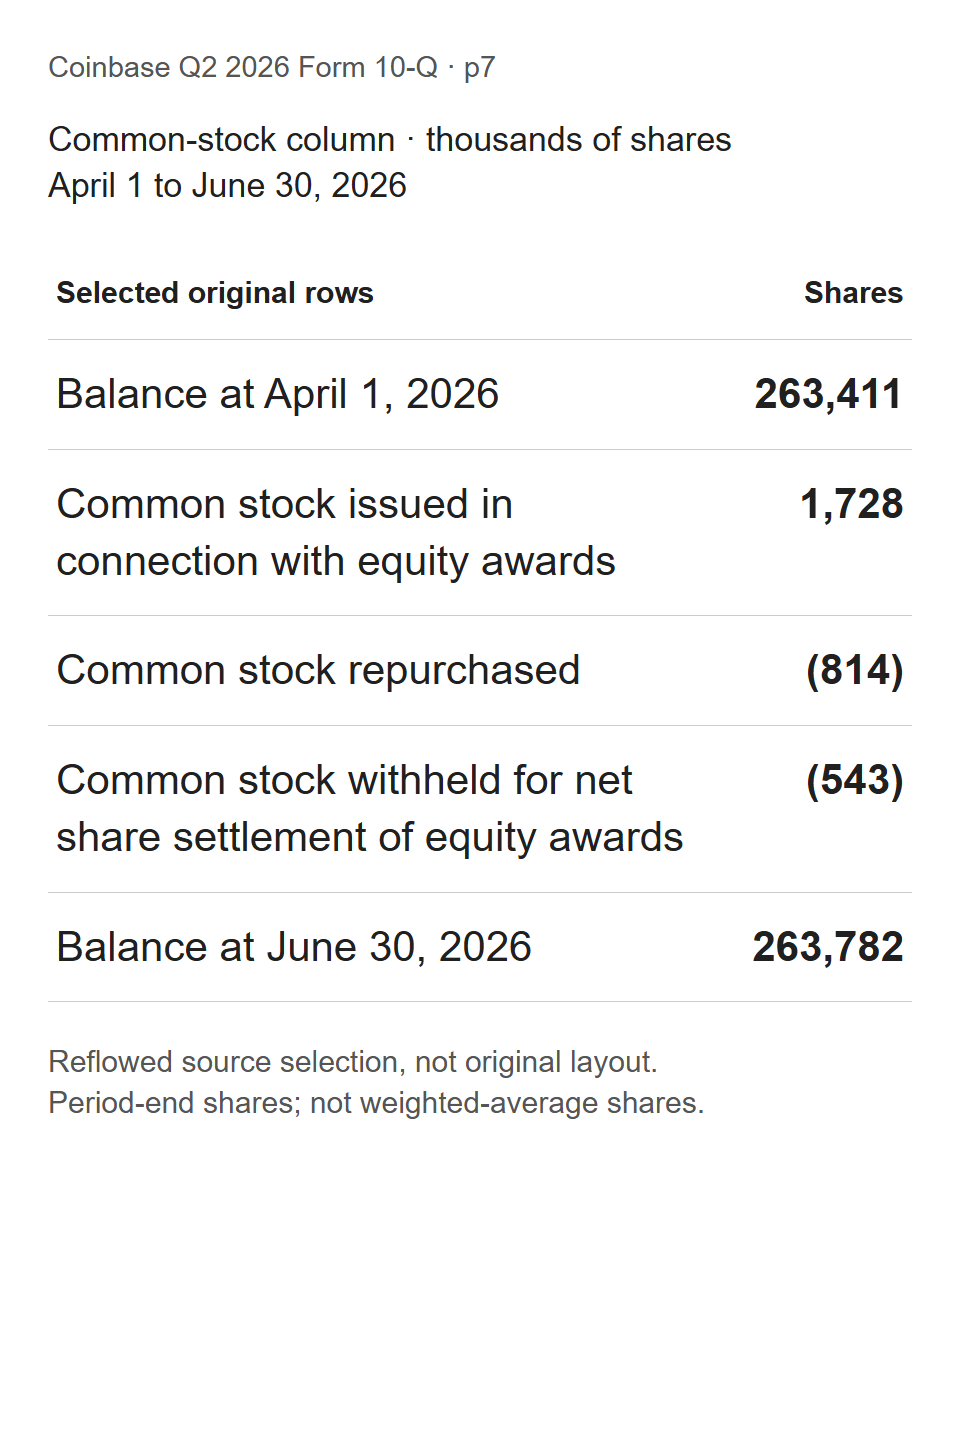
That does not make the buyback useless. All else equal, repurchases leave fewer shares than there would have been without them. It means their effect must be measured after issuance, and over a named period.
The first half supplies the strongest counterpoint. Across that longer window, repurchases exceeded net issuance and the ending count declined.
| Common shares, millions | Q2 2026 | H1 2026 |
|---|---|---|
Starting count | 263.411 | 267.836 |
Equity awards and acquisition issuance | +1.728 | +4.213 |
Repurchases | −0.814 | −7.092 |
Tax-related share withholding | −0.543 | −1.175 |
Ending count | 263.782 | 263.782 |
Net change | +0.371 | −4.054 |
Calculated from 10-Q equity statements pages 7–8. H1 issuance combines 4.040M award shares and 0.173M acquisition shares. The H1 decline is 1.51%; no repurchase-price or cash-spending estimate is inferred from this share bridge.
The remaining $2.0B authorization was capacity as of June 30, not a promise to buy. The program also permits specified debt repurchases. A larger authorization alone therefore cannot settle the next quarter's share-count result.
Guidance sets a test, not a valuation
A more durable Coinbase business would need improving economics across a trading cycle. But operating evidence cannot, by itself, tell us whether COIN is cheap or expensive.
This review does not establish a September 23 market price or attributable analyst consensus. The previous August price, moving averages and short-interest snapshot are excluded rather than presented as current. The comparison below is company guidance, not what investors collectively expect.
| Subscription and services, USD millions | Amount |
|---|---|
Q2 actual | 555.145 |
Q3 guidance, issued July 30 | 500–580 |
Guidance midpoint | 540 |
Source: earnings deck, slide 31. The midpoint is 2.7% below Q2. This range concerns the whole subscription-and-services category, not stablecoin revenue alone.
An outcome near the top would be better evidence than one near the bottom. Even then, the customer-reward expense matters. If rewards rise faster than revenue, growth would answer the adoption question more convincingly than the profitability question.
What could make this reading too cautious?
The record average product balance is real counterevidence to a failing-adoption story. Lower rates can hurt revenue while Coinbase attracts more USDC. If balances grow enough, or reward costs adjust, the revenue-less-rewards comparison could improve. The next filing must establish that change.
The first-half share reduction also matters. A quarter's award issuance can obscure a longer reduction in shares. Repeated net declines would make Q2's increase less significant; repeated increases would weaken the repurchase argument.
There is still a wider profitability constraint. Q2's GAAP net loss was $359.5M, while adjusted EBITDA—a profit measure that removes financing costs, taxes and selected expenses—was positive $207.8M. The latter excludes stock compensation and other items; it is not cash flow or net income. Stock-compensation expense alone was $238.3M.
Nor should the subtraction above be mistaken for a stablecoin profit forecast. Rates, where balances are held, reward terms and the rest of the cost base can all move. The bank-earnings field guide teaches the same balance–rate–cost discipline, although Coinbase's arrangement is not bank lending income.
Keep the next check small
The next filing should resolve two linked questions before the conclusion becomes stronger.
| Next Q3 filing check | Q2 baseline | Evidence that would change the reading |
|---|---|---|
Stablecoin revenue less USDC rewards | $173.039M before other costs | Improvement alongside balance growth; weakness despite growth would narrow the case |
Period-end common shares | 263.782M | A sustained decline after issuance and repurchases; another increase would weaken the per-share argument |
A source review is due by October 31, 2026 and at the Q3 filing. That is an editorial checkpoint, not an asserted earnings date or an active scheduled update.
Read the revenue with its costs, then read the buyback with its share count. Those two comparisons cannot price COIN, but they can stop an attractive headline from doing the work of a financial statement.
Sources and calculation boundaries
The Q2 10-Q, SEC-filed deck and July 30 company release supply the selected operating facts. They were reopened on September 23. Q1 amounts are H1 less Q2 under the same revised presentation, which excludes corporate payment-stablecoin income from stablecoin revenue. Calculations use unrounded inputs; displayed summaries are rounded.
This revision adds the rewards-expense reconciliation, rebuilds the share-count comparison and removes the stale market dashboard. AI assisted research, arithmetic checks, EN/KO drafting and visual production. These checks do not constitute a claim of human editorial review. Owner holdings, sponsorship and affiliate relationships have not been independently verified for this analysis. Educational analysis only; no personalized advice, rating or price target.
Primary references cited or linked in this analysis. Click through to read each source in full.
Choose the next evidence gap to investigate.
Circle Gets Binance's Investment—and Pays for Distribution
Binance's $100M investment and Arc's launch are real milestones. Circle's filings show why funding, paid distribution and repeatable earnings need separate tests.
Owner-operated US market research desk
Owner-operated US stock and market coverage built from public filings, SEC EDGAR, official reports, company releases, and market data.
- Source-grounded research with primary filings & official reports
- Bilingual EN / KO editorial workflow
- Manual editorial QA before publish