Netflix's ads are growing. The profit is harder to see.
Netflix's ad outlook shows scale, not a separate profit margin. Here is how to read the company-wide earnings target and the one-off fee inside cash flow.
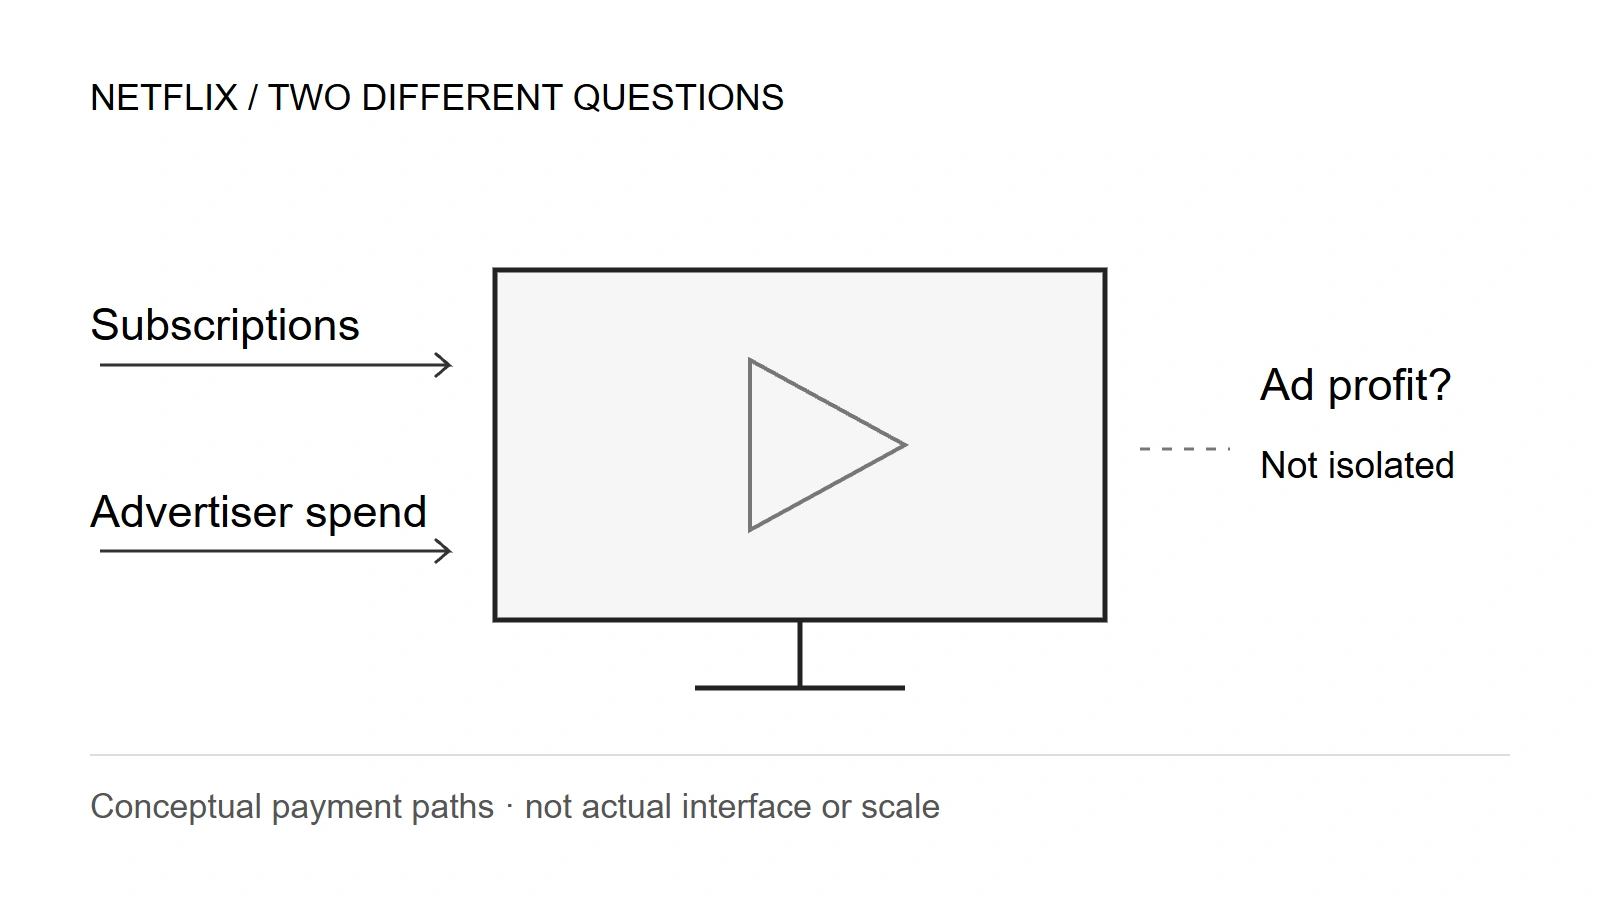
Start with the profit Netflix actually reports
To judge Netflix's advertising business, first look for its profit line. There isn't a separate one in the financial statements reviewed here. The company publishes an advertising revenue outlook, but the profit it reports belongs to the whole business.
That distinction matters when a cheaper subscription also brings in money from advertisers. Additional ad sales can help, yet their value depends on the costs of attracting advertisers, serving ads and retaining viewers. A bigger revenue figure alone cannot settle that question.
Netflix's business is already profitable, and its annual outlook points to improvement. The useful test is whether growth becomes company-wide profit and dependable cash—not whether the ad headline gets larger. An annual margin cut despite revenue meeting plan would weaken that case.
The quarter grew, but kept less of each sales dollar
The July 16 shareholder letter reports higher revenue and operating income in Q2. Operating income is what remains after operating expenses, before interest and income taxes. It rose more slowly than sales.
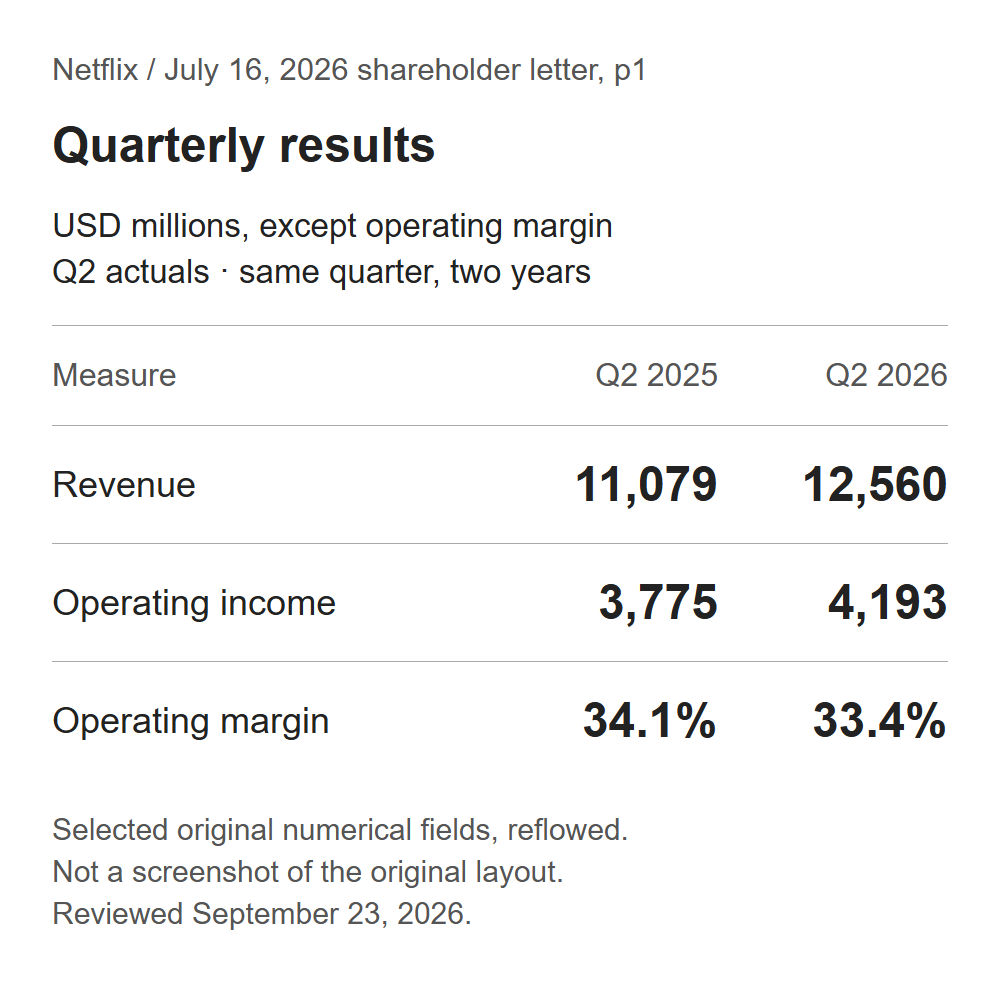
Revenue increased 13.4%, while operating income increased 11.1%. The margin decline of 0.7 percentage points does not tell us which part of Netflix became less profitable. It does establish that this quarter's growth did not lift the overall margin.
The explanations also operate at different levels. The letter emphasizes heavier first-half content amortization: the expense recognized as content is used. The 10-Q's operating review points to technology and development plus sales and marketing costs growing faster than revenue. Neither provides a separate advertising cost account.
Advertising scale is visible; advertising returns are not
Management expects approximately $3B of advertising revenue in 2026, roughly double the previous year. Relative to the annual revenue outlook midpoint, that would be about 5.9%. Both inputs are forecasts, so this is a scale comparison—not a reported quarterly revenue mix.
| What the reviewed disclosures provide | What they do not establish |
|---|---|
Approximately $3B annual ad-revenue outlook | Ad operating profit or margin |
Company-wide operating margin | The incremental return from advertising alone |
Membership, pricing and ads as growth drivers | Each driver's separate dollar contribution |
The filing describes one operating segment. It also says sources other than monthly membership fees, including ads and other activities, were not a material revenue component in Q2 or H1. That statement and the annual ad forecast cover different periods and scopes; they are not contradictory.
A subscription on an ad-supported plan still brings in membership fees. The ad-revenue outlook therefore cannot be read as all the revenue associated with viewers on that plan. Nor can it be treated as entirely new company revenue without knowing what those viewers otherwise would have paid.
This is the same distinction explored in Coinbase's stablecoin revenue and rewards expense: a promising revenue label is the beginning of an economics question.
A yearly margin is not a quarterly minimum
The company's 31.5% annual operating-margin target is below its Q3 forecast. That is possible because the annual result combines quarters with different sales and expenses; it is not the simple promise that every quarter will achieve the same percentage.
Here is a reproducible check using the letter's rounded figures. Combine the midpoint of the $51.0B–$51.4B annual revenue range with the annual margin, then subtract H1 actuals and the Q3 forecast.
| Step | Revenue | Operating income |
|---|---|---|
FY midpoint arithmetic | $51.200B | $16.128B |
H1 actuals, rounded | $24.810B | $8.150B |
Q3 company forecast | $12.860B | $4.268B |
Q4 residual, calculated | $13.530B | $3.710B |
The remaining ratio is $3.710B / $13.530B, or approximately 27.4%. This is Hynexly arithmetic from rounded inputs, not a newly disclosed Q4 forecast. The annual target could be reached with different quarterly outcomes.
It also exposes the limit of the exercise. A mathematically consistent annual margin says nothing by itself about advertising profitability. Even a successful company-wide result would leave that attribution question open.
The operating hurdle is clearer than the valuation
No current stock quote, earnings multiple or analyst consensus is asserted here. These filings let us test the operating argument, not declare what today's share price already assumes or whether it is attractive.
The constructive reading has real support: revenue grew across all regions, and management retained an annual margin target above the prior year's 29.5%. A falling quarterly margin need not overturn that annual case. But the target is a management forecast, not a market consensus and not a completed result.
Cash needs a different set of questions
Netflix defines free cash flow as operating cash flow minus purchases of property and equipment. It is a company-defined non-GAAP measure. Content cash spending already affects operating cash flow; subtracting it again would double-count the outflow.
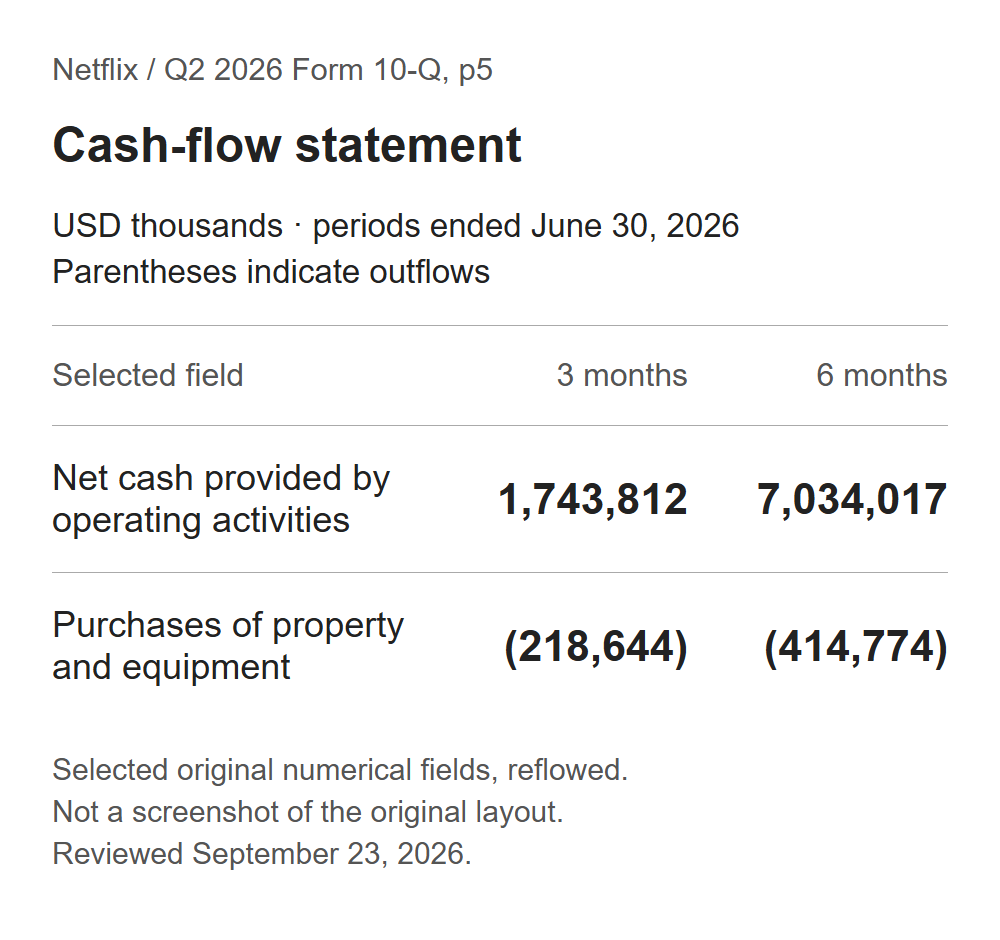
Those lines reconcile to reported free cash flow of $1.525B for Q2 and $6.619B for H1, rounded. Yet H1 includes a $2.8B receipt arising from the terminated Warner Bros. Discovery transaction. The filing says Paramount Skydance paid it on WBD's behalf.
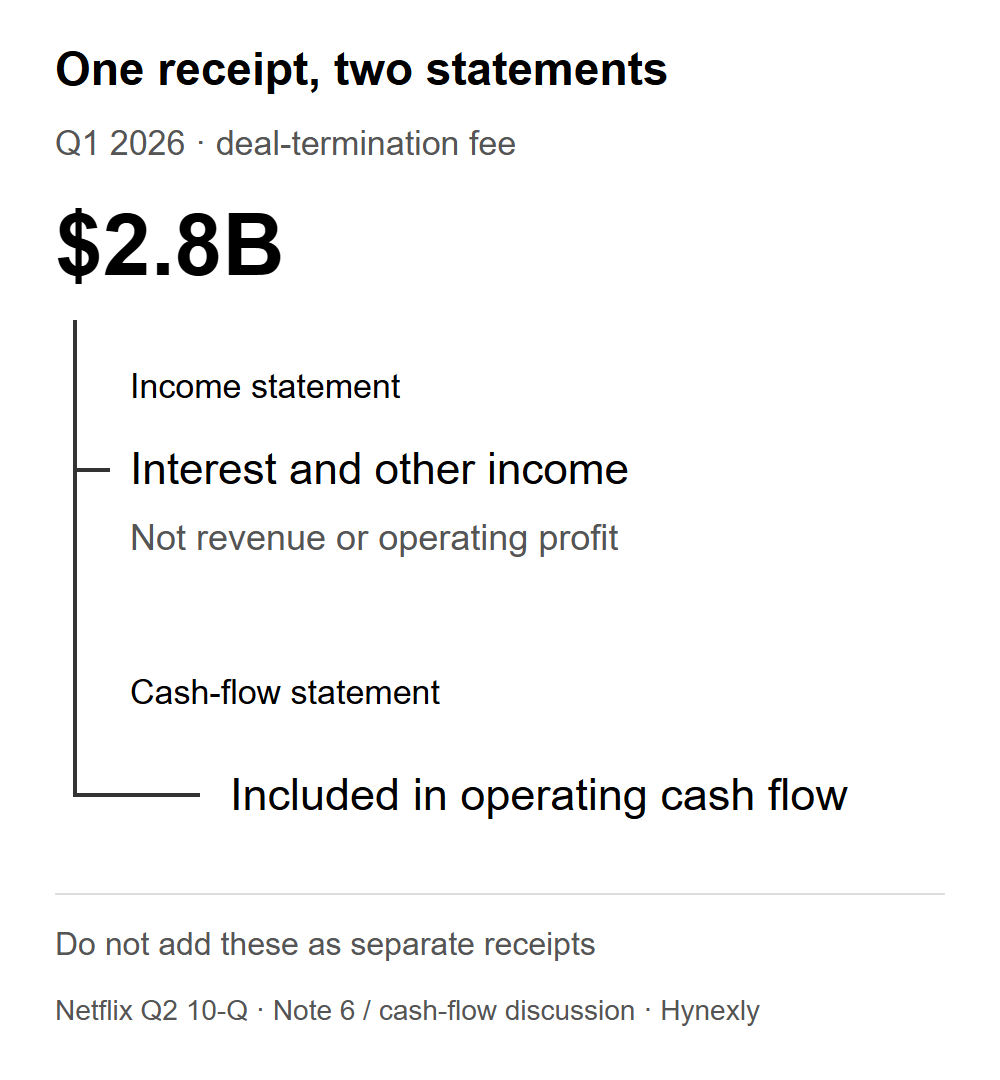
Notice the accounting boundary: the fee lifted income below operating profit, while entering operating cash flow. It is not streaming revenue, and it did not lift the operating-margin numerator. Calling all operating cash recurring would miss that distinction.
The letter says Q2 cash taxes were higher partly because of the fee. The filing also identifies increased content payments and working-capital movements, including $729M of H1 non-routine payments for prior-period Brazilian non-income-tax assessments. Removing one receipt without reconciling these different items would not yield a defensible after-tax recurring measure.
| Reported cash bridge | Amount |
|---|---|
H1 non-GAAP free cash flow, rounded | $6.619B |
H2 residual required by the annual outlook | Approximately $5.881B |
FY non-GAAP free-cash-flow outlook | Approximately $12.5B |
This subtraction is useful for checking the annual reported total. It is not company H2 guidance or normalized cash generation. Nvidia's company-cash versus product-return analysis explores a related mistake: asking a company total to prove a narrower business claim.
The strongest objection is that the base business can carry the result
Netflix does not need to publish an ad margin for the whole company to prosper. Membership growth, pricing and content demand can support earnings while advertising develops. That is the strongest reason not to turn a disclosure gap into a negative verdict.
The risk runs the other way too. Company totals could improve while advertising remains costly. And cash can look unusually strong or weak when receipts, content payments and taxes land in different quarters. Neither a missing metric nor a single cash movement settles the long-term economics.
Engagement will be harder to check at the same frequency: the letter says What We Watched will become annual in the first quarter beginning in 2027, while weekly Top 10 lists remain. A financial improvement accompanied by less granular evidence calls for narrower conclusions.
October 20 supplies the next financial check
The September 14 announcement schedules Q3 results for October 20, 2026. At this review date the result has not occurred.
| Watch at the next report | Current reference | What changes the interpretation |
|---|---|---|
Company profit conversion | Q3 margin forecast 33.2%; FY 31.5% | Revenue near plan but margin missing and annual guidance cut weakens the case |
Advertising disclosure | Annual revenue outlook, no separate profit line | A consistent profit or cost series would make attribution more testable |
Reported cash | FY outlook approximately $12.5B | A cut or unexplained weakness requires revisiting the cash case |
A clean reading can hold two conclusions at once: Netflix has a growing, profitable business, and the reviewed disclosures still do not isolate the return on its advertising expansion.
Sources and calculation boundaries
Reviewed 2026-09-23 using the letter, 10-Q and dated event announcement. Growth rates use comparable Q2 figures; the ad ratio is $3B / $51.2B. The margin worksheet uses rounded letter values; the cash reconciliation uses the filing's underlying thousands before rounding. Dollar amounts marked B are billions and M are millions.
Hynexly prepared this source-linked analysis with AI assistance for research organization, drafting, bilingual editing and deterministic graphics. No independent human review or verified author holdings are claimed here. This is general information, not personalized investment advice.
Primary references cited or linked in this analysis. Click through to read each source in full.
Choose the next evidence gap to investigate.
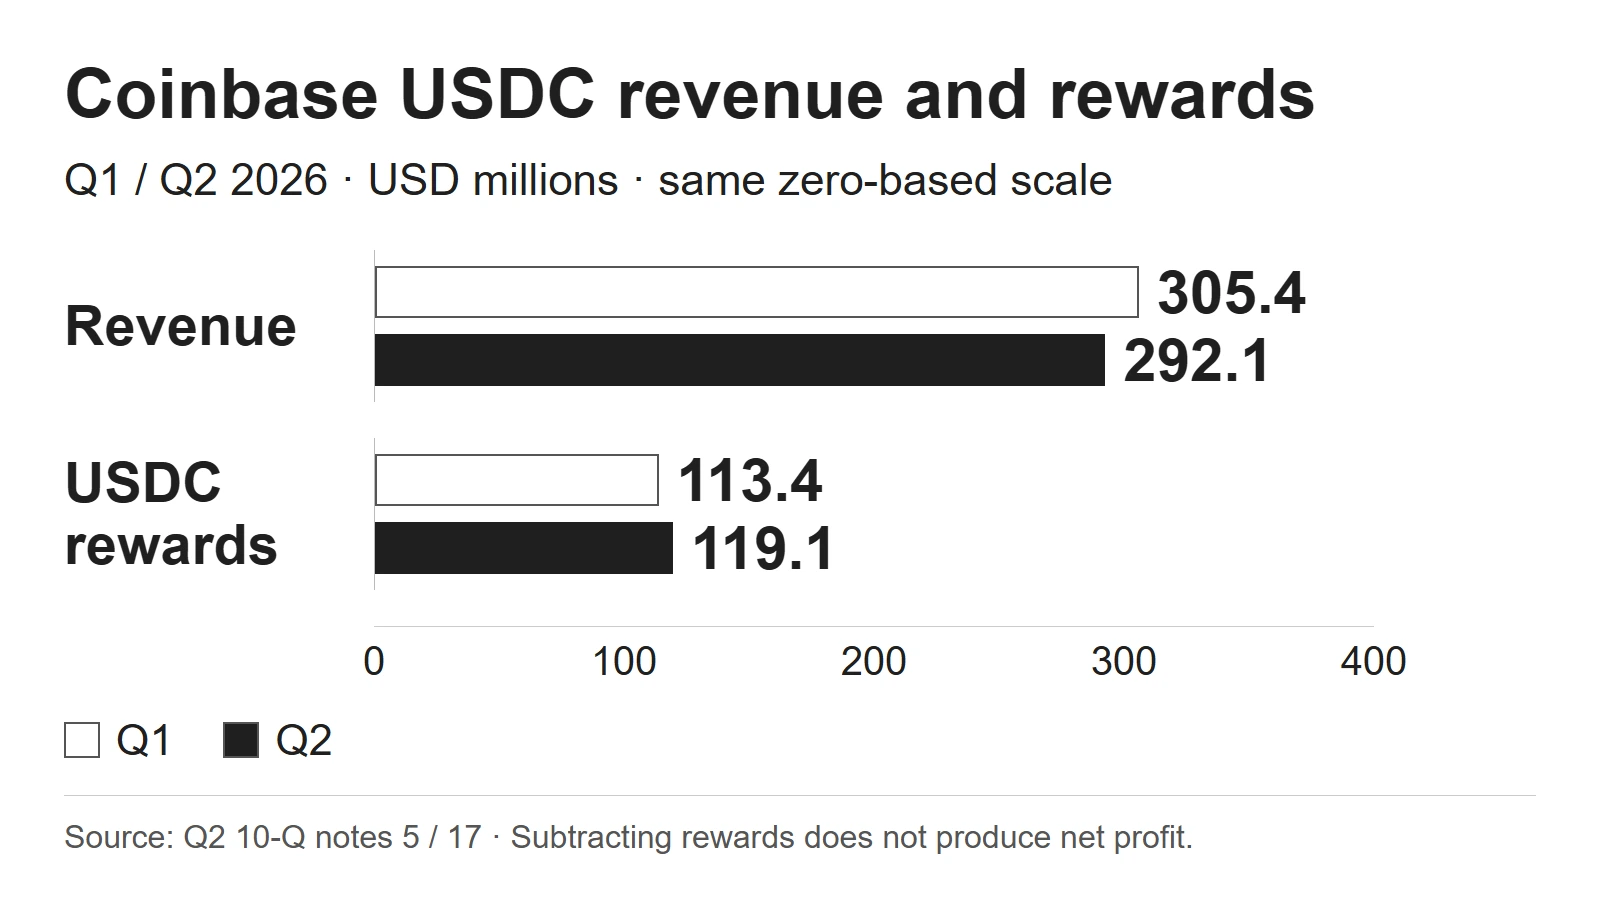
Coinbase's USDC Revenue Chart Leaves Out a Key Cost
Coinbase's stablecoin business cushions trading, but customer rewards and new shares complicate the benefit to shareholders. A Q2 filing check explains both.
Owner-operated US market research desk
Owner-operated US stock and market coverage built from public filings, SEC EDGAR, official reports, company releases, and market data.
- Source-grounded research with primary filings & official reports
- Bilingual EN / KO editorial workflow
- Manual editorial QA before publish