One ETF Page, Four Percentages: What SEC Yield, Trailing Yield, YTM and Total Return Each Answer
On September 24, TLT showed a 5.41% SEC yield, a 4.90% trailing yield and a −6.15% year-to-date total return. What each number measures, why they differ, and the calculation that ties yield to rate risk.
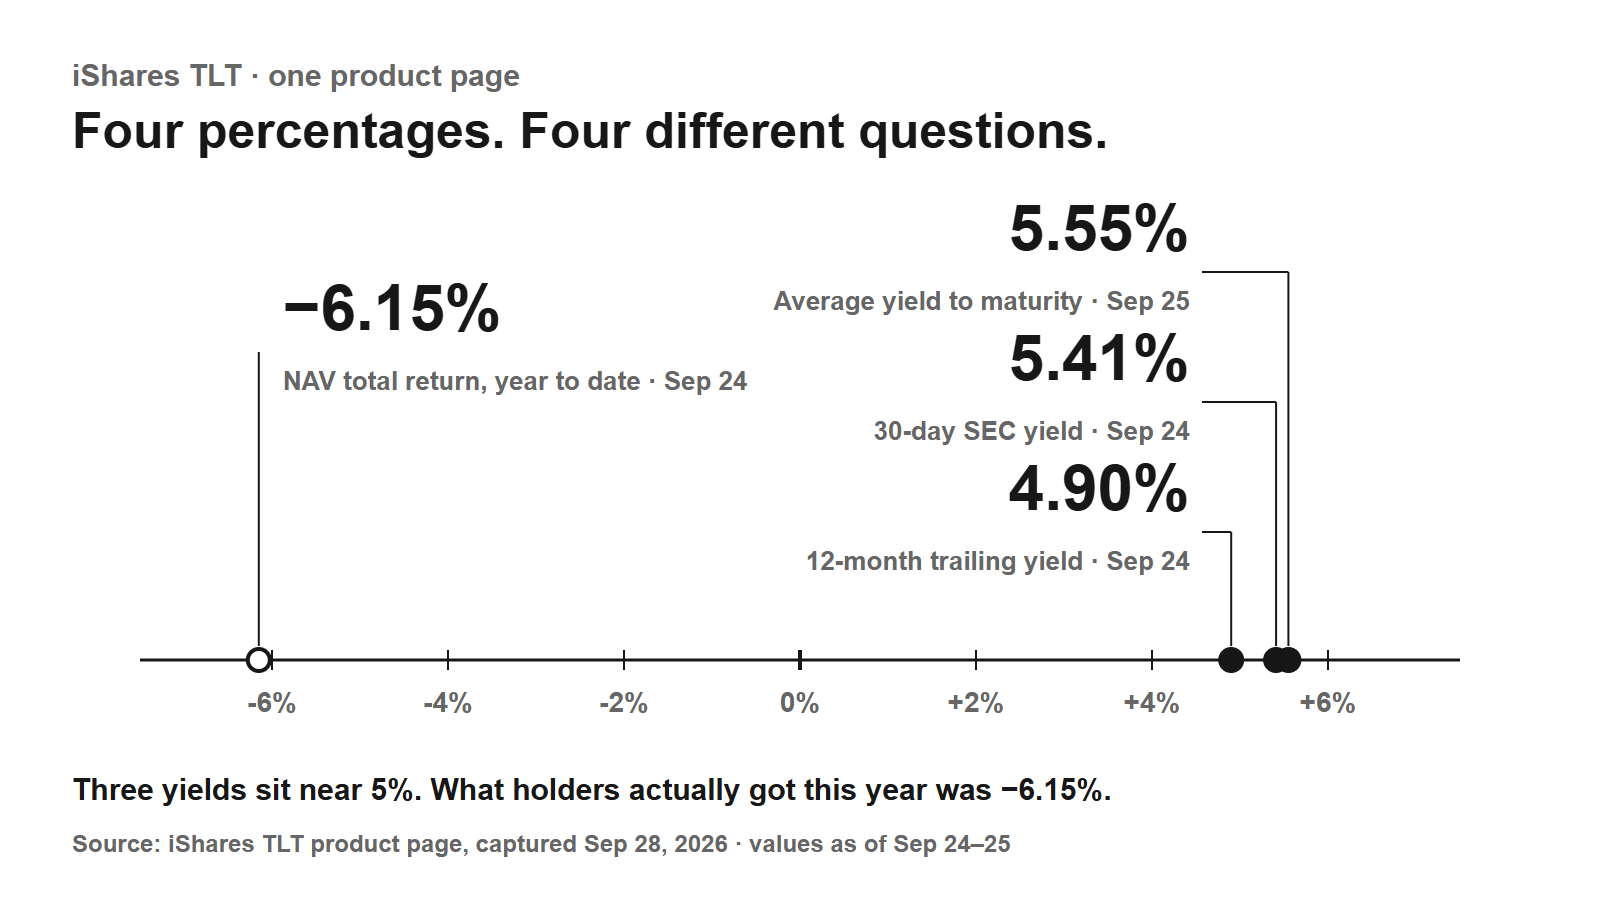
On September 24, the iShares page for TLT—a fund of U.S. Treasury bonds maturing in 20 years or more—showed a 30-day SEC yield of 5.41%. The same page showed a year-to-date total return of −6.15%.
Neither number is wrong; they answer different questions. An ETF yield is a portfolio's income under a stated rule, not a forecast of what you will earn. Before comparing two funds, check five labels—metric, window, denominator, cost treatment and date—then look at duration, because in a long-bond fund a small move in rates can outweigh months of income.
A yield is a rule, not a promise
TLT's three yields sit near one another because they describe income from the same bonds, each sliced differently: income accrued over 30 days, cash paid over 12 months, and the yield implied by today's bond prices. The return measures what holders actually experienced since January 1.
The 0.51-point gap between TLT's SEC and trailing yields comes mostly from how each rule counts income, not from anything that happened to the fund that day. If so, the gap should persist while TLT holds bonds priced well below face value.
Source Evidence Snapshot — what the SEC standardized
The SEC created a standardized yield so investors could compare similar funds more easily.
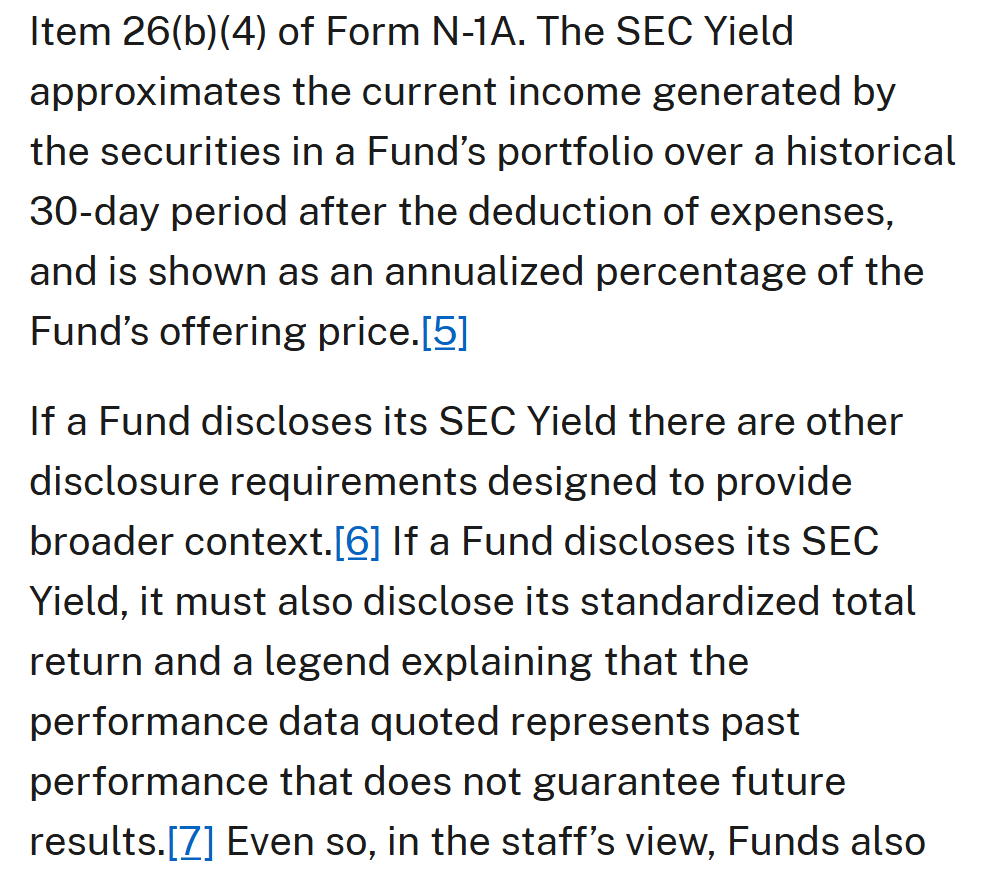
Two sentences matter. The SEC yield approximates portfolio income over a historical 30-day period after expenses, annualized against the offering price. And a fund that advertises it must also show standardized total return with a past-performance legend, so the regulator itself treats yield and return as separate facts.
The formula's fine print explains why SEC yield often differs from cash paid out.
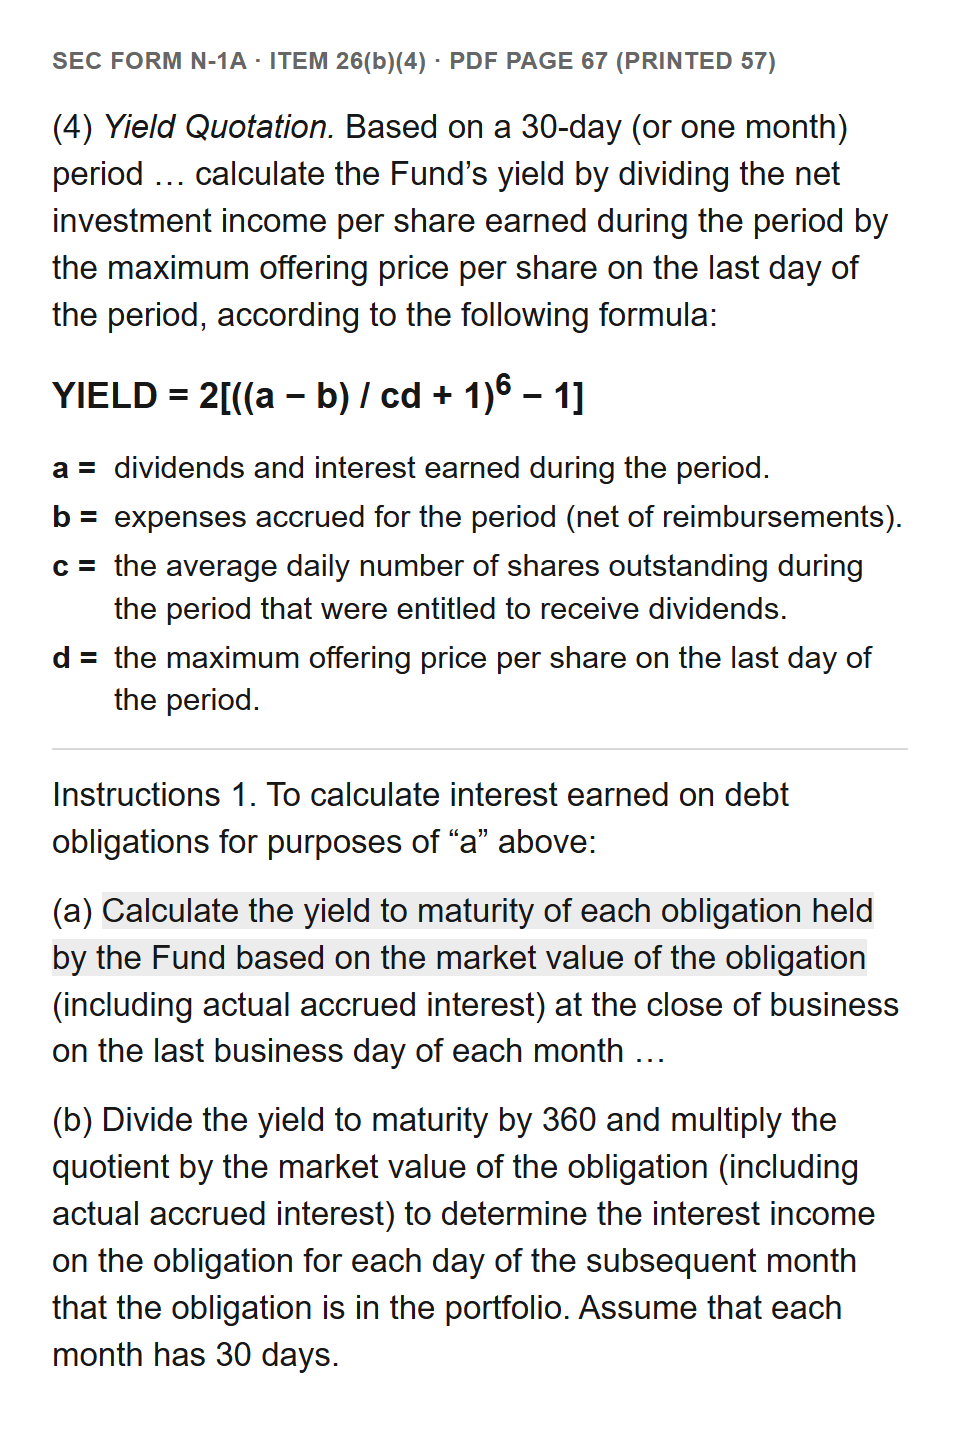
For bonds, the formula does not use the coupon. It accrues interest at each bond's yield to maturity on market value. A fund holding low-coupon bonds bought below face value can therefore show an SEC yield well above the cash it distributes.
Why TLT shows 5.41% and 4.90% on the same day
| Metric (as of) | What it counts | Divided by | TLT | SGOV |
|---|---|---|---|---|
30-day SEC yield (Sep. 24) | Interest accrued at each bond's yield to maturity, minus expenses, annualized | Maximum offering price per share | 5.41% | 3.67% |
12-month trailing yield (Sep. 24) | Income distributions paid over the past year | Latest NAV plus the year's capital-gain distributions | 4.90% | 3.69% |
Average yield to maturity (Sep. 25) | Yield implied by holdings' prices and cash flows; excludes fees | Holdings' market prices, including accrued interest | 5.55% | 3.99% |
NAV total return, year to date (Sep. 24) | NAV change plus distributions since January 1 | NAV at the start of the year | −6.15% | +2.64% |
Definitions: SEC Form N-1A for the SEC yield; iShares field definitions for the other three. Values from the iShares TLT and SGOV pages.
Start with the two highest yields. Average yield to maturity, 5.55%, excludes fees; the SEC yield, 5.41%, deducts them. The 0.14-point gap is close to TLT's 0.15% expense ratio. Dates and methods differ slightly, so costs explain most of the gap, not all of it.
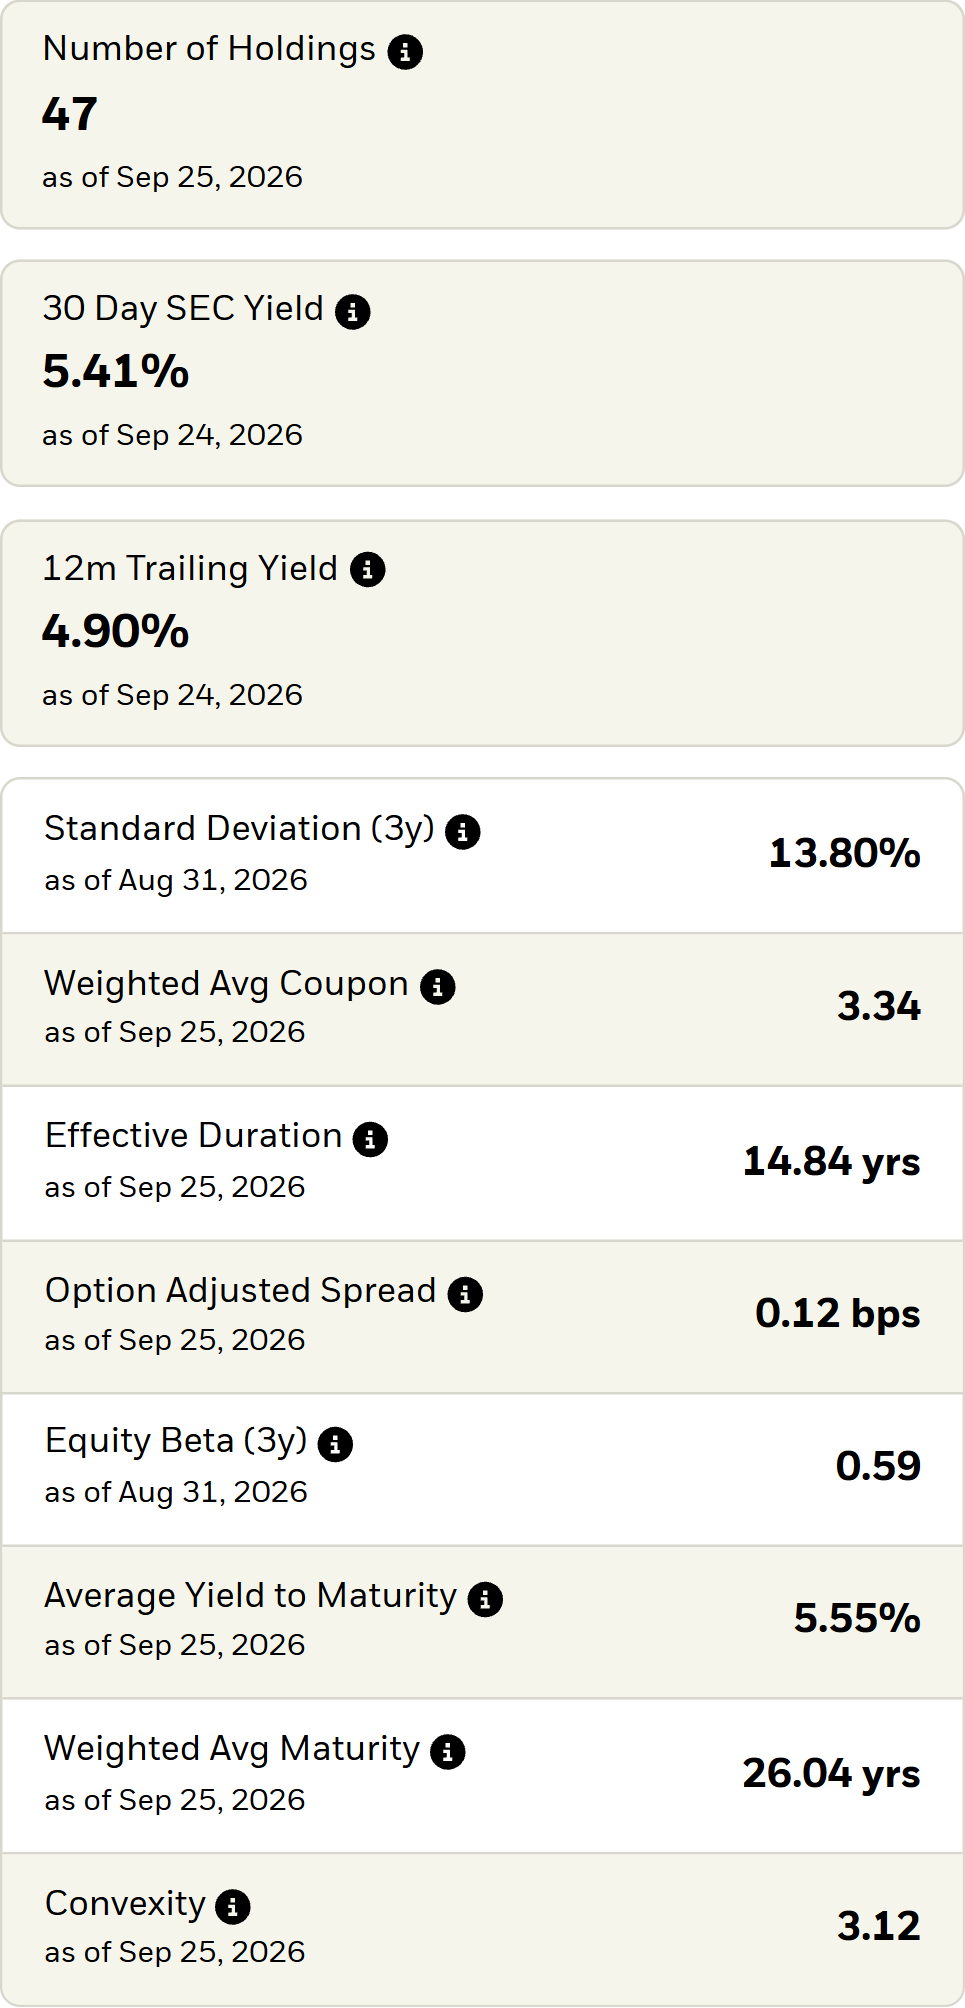
The wider gap is between SEC and trailing yield: 0.51 point. TLT's weighted average coupon was 3.34 while its bonds yielded 5.55% to maturity. A bond whose coupon is below its yield trades below face value, and part of its return comes from the price climbing toward face value by maturity. The SEC formula counts that climb as income.
The trailing measure records only what was distributed, over a look-back year when rates were different. iShares does not publish a split of the gap, so this is our reading of the mechanics, not a reported decomposition.
SGOV, which holds Treasury bills maturing within 3 months, shows a different effect: timing. Its SEC yield was 3.67% on September 24 and its average yield to maturity 3.99% a day later, a 0.32-point gap against a 0.09% expense ratio. Bill yields rose through the window: the Treasury's 1-month par yield went from 3.80% on August 26 to 4.01% on September 24, and the Fed raised its target range on September 16. A look-back measure trails a snapshot taken after the move.
The number every yield leaves out
Yield measures income; your result also depends on price. Duration estimates how far a bond fund's price moves when yields change. On September 25, TLT's effective duration was 14.84 years and SGOV's 0.10 year.
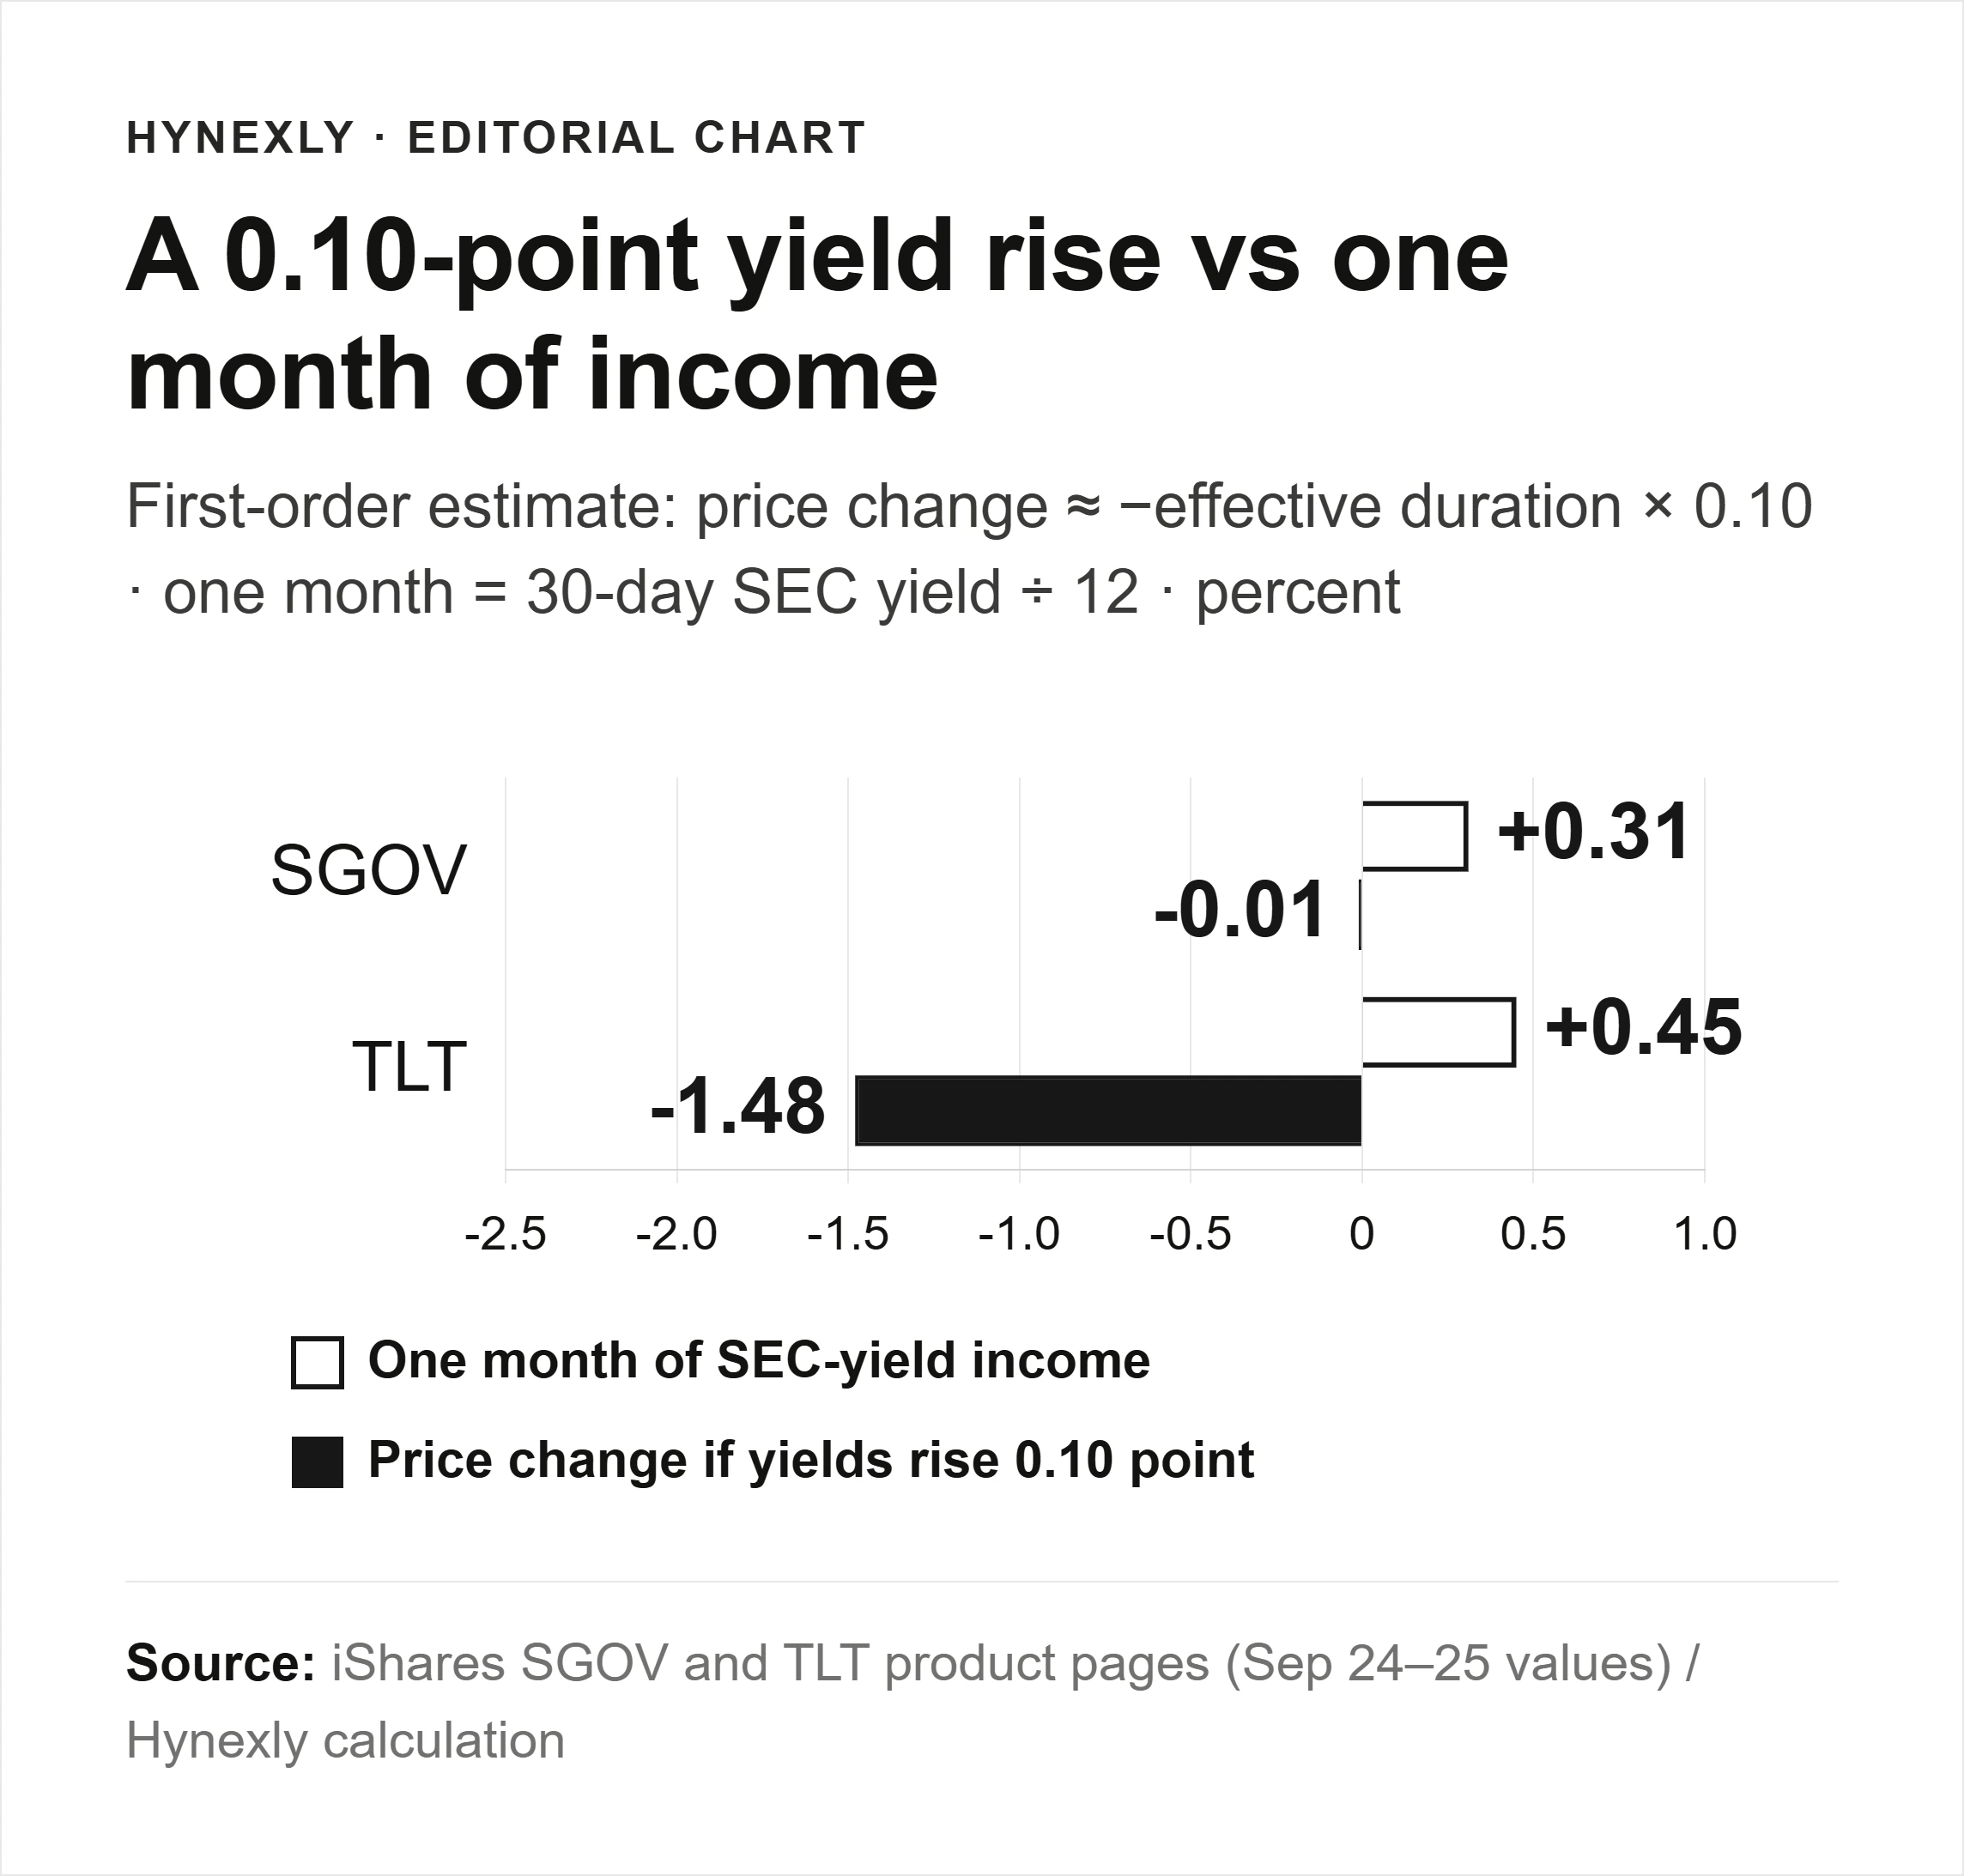
For TLT, a 0.10-point rise in yields would lower the price by about 1.48%, while one month of income at a 5.41% SEC yield is about 0.45%. That small move costs roughly 3.3 months of income. For SGOV, the same move costs about 0.01% against 0.31% of monthly income, so income dominates.
A rise of about 0.36 point in TLT's yields (5.41 ÷ 14.84) would offset a full year of its SEC-yield income. That is how a yield above 5% coexists with a −6.15% year-to-date return. For this year's move at the long end, see our analysis of why long Treasury yields diverge from the Fed rate.
Where this reading can fail
The duration math is a first-order approximation. It assumes an immediate, parallel move and ignores convexity; TLT reports 3.12, which cushions large rises and amplifies large falls. It also holds the SEC yield fixed, although the coming month brings new income.
Definitions differ: another sponsor may compute trailing yield on market price, over a different period or from the latest payment alone. For funds holding inflation-protected Treasuries, SEC staff warn that the short window can make yields swing month to month.
An ETF can also trade away from its net asset value, the per-share value of its holdings; the SEC's ETF bulletin explains these premiums and discounts. Taxes, credit risk outside Treasuries and your holding period change the outcome too. Our Circle reserve-income analysis shows the same rate-to-income translation inside a company's earnings.
Before you compare two yields
| Check | TLT example | If it does not match |
|---|---|---|
Same metric | SEC yield, 5.41% | Do not compare an SEC yield with a trailing or distribution yield |
Same window | The month ended Sep. 24 | Expect gaps after rate changes; SGOV's lag is one example |
Same denominator | Maximum offering price per share | Check whether the other figure uses NAV or market price |
Same cost treatment | After expenses | Yield to maturity excludes fees; subtract costs before comparing |
Same date | Sep. 24 | Refresh both numbers on one day |
Duration added | 14.84 years | Estimate the price change for a 0.10-point move before ranking by yield |
The SGOV timing reading makes a dated prediction. By late October, the whole look-back window will postdate the September 16 hike. If SGOV's SEC yield has not moved closer to its yield to maturity by then, allowing for its 0.09% expense ratio, our reading is wrong or incomplete.
Method and sources
Figures come from the iShares TLT and SGOV pages, read on September 28, 2026, with each field's own as-of date. The SEC definition and formula come from ADI 2022-12 and Form N-1A Item 26(b)(4); bill yields from the Treasury's daily par yield curve; the September 16 decision from the Fed's statement. We calculated the gaps, monthly income (SEC yield ÷ 12), first-order price changes (−duration × 0.10) and the break-even move (SEC yield ÷ duration).
AI assisted with source organization, calculations, chart production and bilingual checks; figures and quotations were checked against the linked originals. This is general educational research, not individualized investment advice, a rating or a recommendation to buy or sell any fund.
Primary references cited or linked in this analysis. Click through to read each source in full.
- SEC staff ADI 2022-12 on SEC yield
- SEC Form N-1A, Item 26(b)(4)
- iShares 20+ Year Treasury Bond ETF (TLT) product page
- iShares 0-3 Month Treasury Bond ETF (SGOV) product page
- U.S. Treasury daily par yield curve, 2026
- Federal Reserve FOMC statement, September 16, 2026
- SEC investor bulletin: Exchange-Traded Funds
Choose the next evidence gap to investigate.
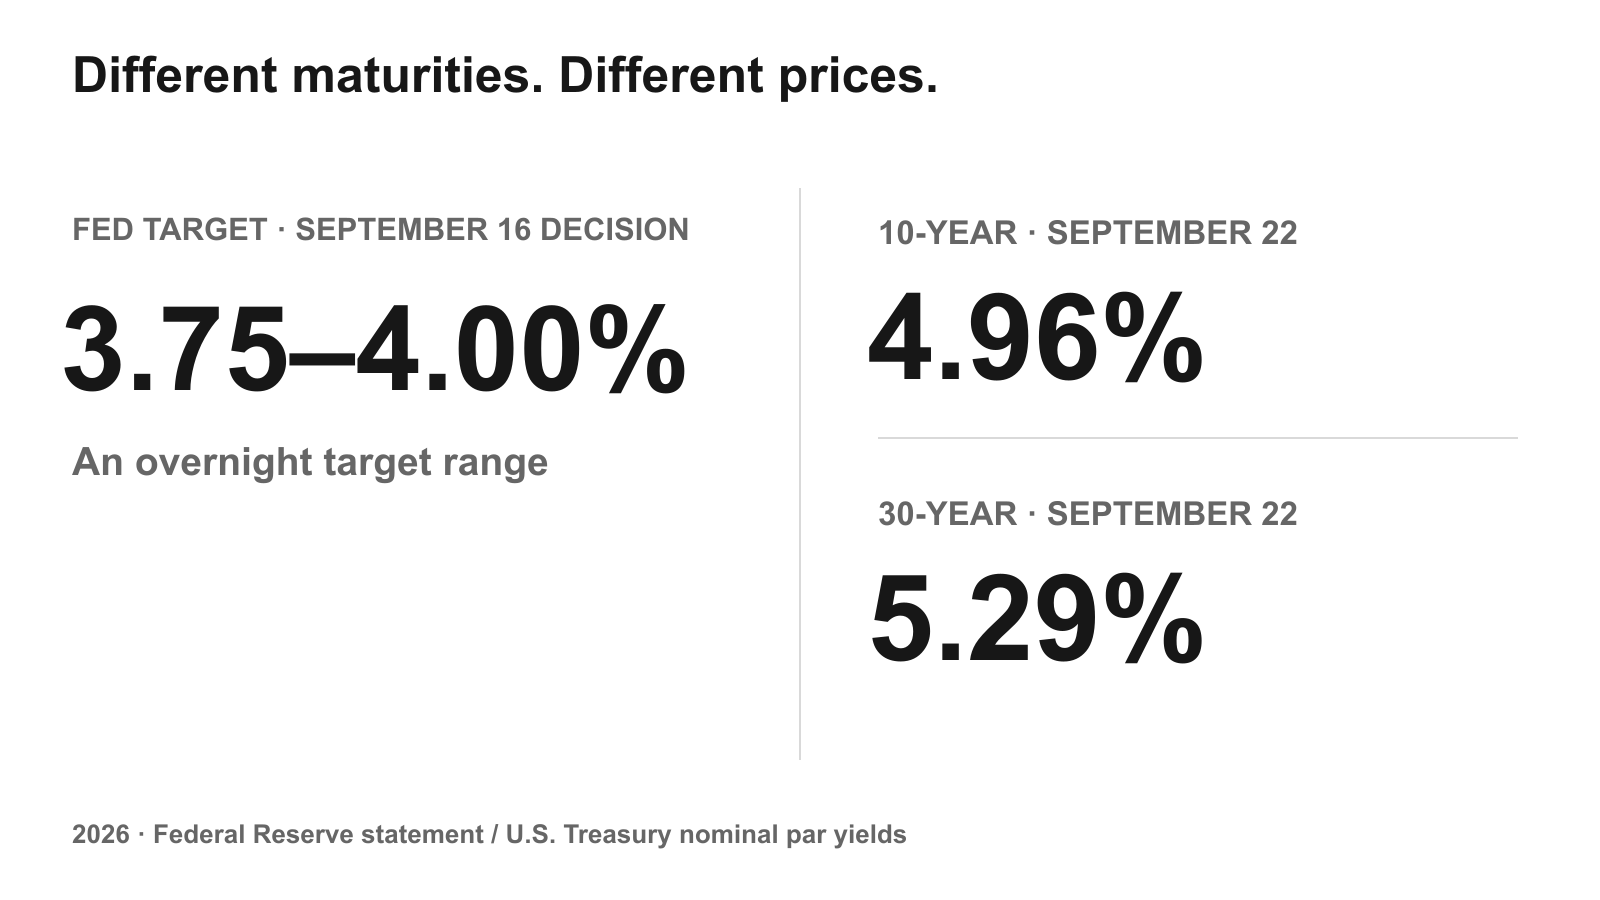
Why the Fed Rate Doesn't Tell the Whole Treasury Story
The Fed's September hike and the Treasury curve tell different stories. A matched nominal-versus-real yield comparison shows what changed—and what it cannot prove.
Owner-operated US market research desk
Owner-operated US stock and market coverage built from public filings, SEC EDGAR, official reports, company releases, and market data.
- Source-grounded research with primary filings & official reports
- Bilingual EN / KO editorial workflow
- Manual editorial QA before publish