AMD: Better Chip Profits, Less Cash Left Over
AMD's Q2 Data Center margin improved, but free cash flow fell. Separate accounting costs, equipment spending and payment timing before judging the AI ramp.
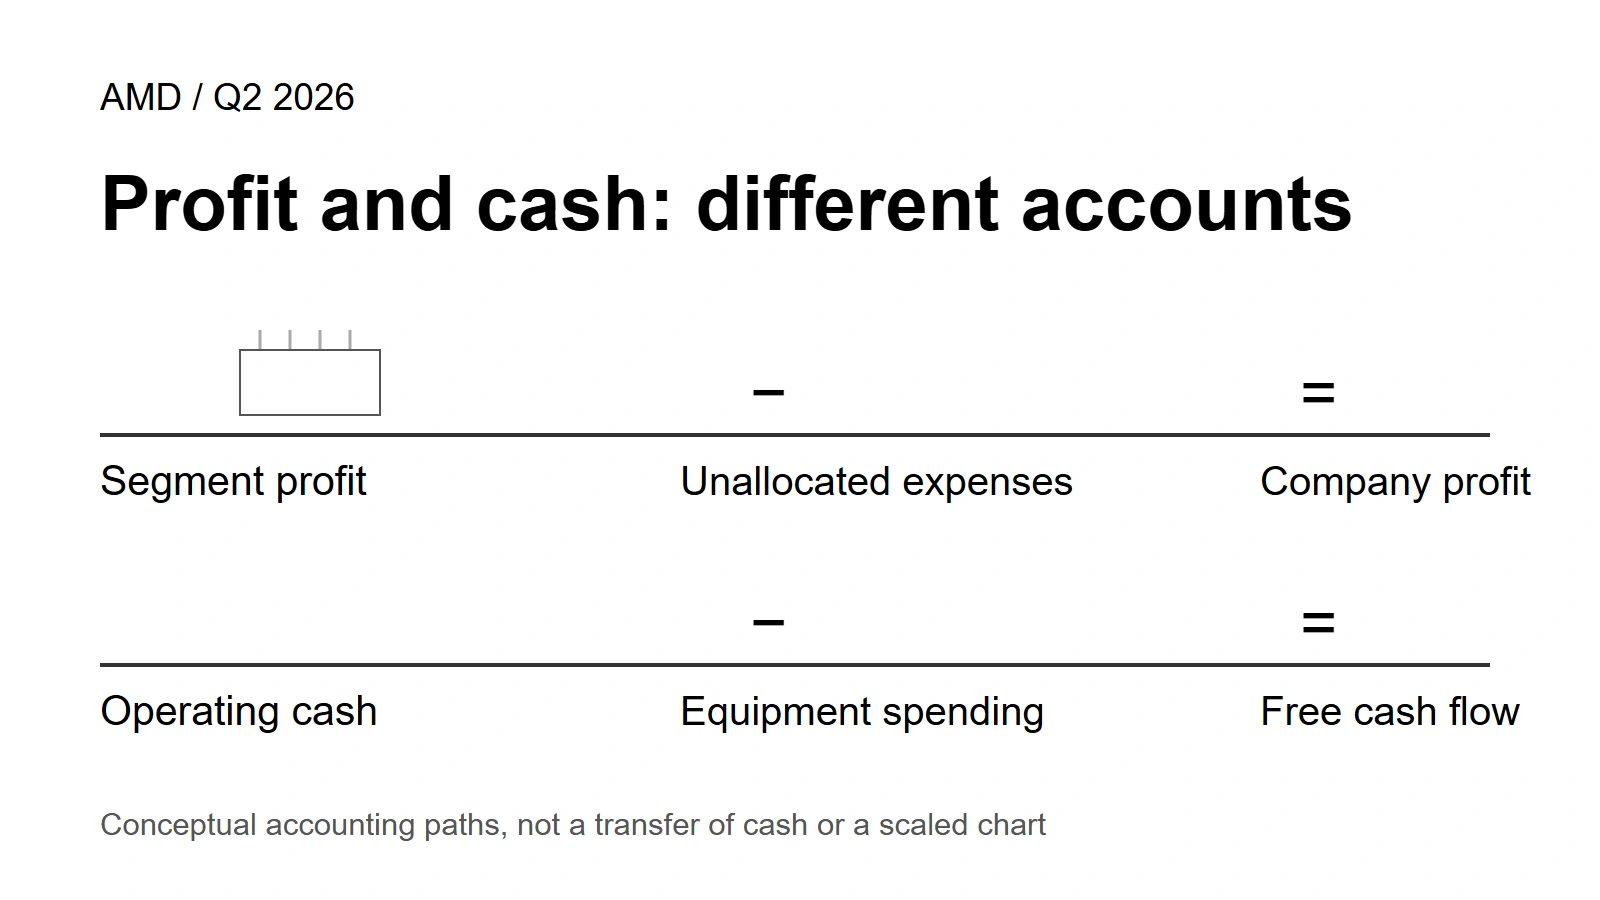
Selling a processor can improve reported profit before the customer's cash arrives. Buying equipment can reduce the cash left over without appearing as an equal expense in that quarter. AMD's latest report is easier to read once those two calculations stop being treated as one.
Its Data Center business became more profitable in Q2 2026. Company-wide free cash flow nevertheless fell from Q1. The useful question is not which number to believe. It is what changed inside each.
| Two different measures | Q1 2026 | Q2 2026 | Scope |
|---|---|---|---|
Operating margin | 27.7% | 31.3% | Data Center segment; calculated |
Free cash flow | $2.566B | $1.558B | Company continuing operations; non-GAAP |
Orientation from AMD's August 4 results. These are different reporting scopes, not a conversion ratio. B means billion U.S. dollars.
Thesis: profit improved; the cash question is more specific
The strongest evidence for improvement is sequential: Data Center earned more operating profit on each $1 of revenue than in Q1. That is more informative than the spectacular year-over-year comparison, because Q2 2025 included an $800M MI308 export-control inventory and related charge.
But this is not a clean bill of health for every part of AMD's AI business. Data Center combines EPYC server processors and Instinct GPUs. Its margin cannot tell us the profitability of either product alone.
Cash needs a separate explanation. Equipment purchases increased, while the operating cash-flow statement shows sizable—and partly offsetting—changes in collections, inventory and payments. Those movements deserve follow-up. One quarter does not establish a structural cash problem.
Source Evidence Snapshot: start with the segment, not a GPU estimate
AMD's reported fields show the improvement directly.
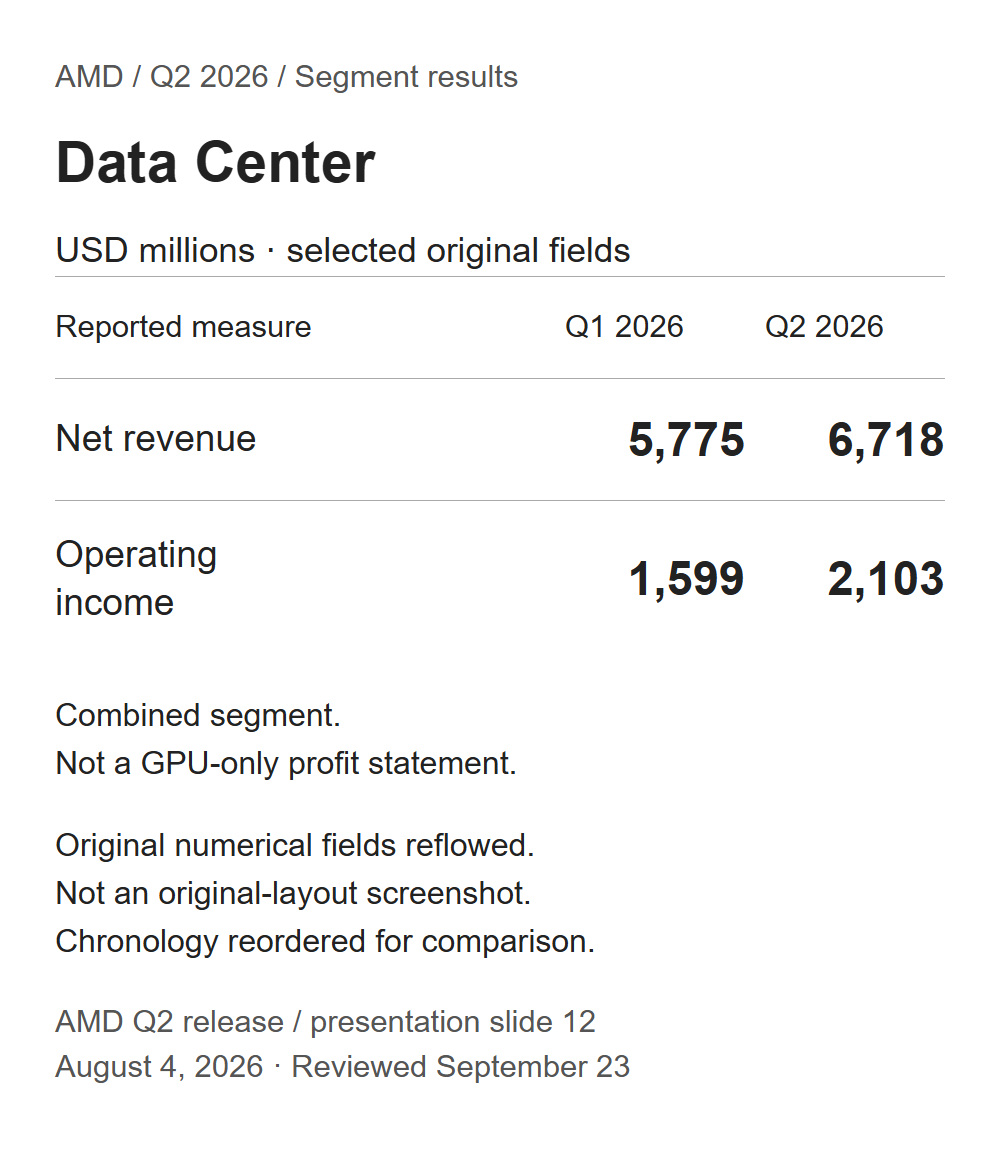
Source-field extract, not an original-layout screenshot: AMD Q2 presentation, slide 12, August 4, 2026. Original numerical fields reflowed and columns reordered; USD millions. Checked September 23. Source capture: original slide.
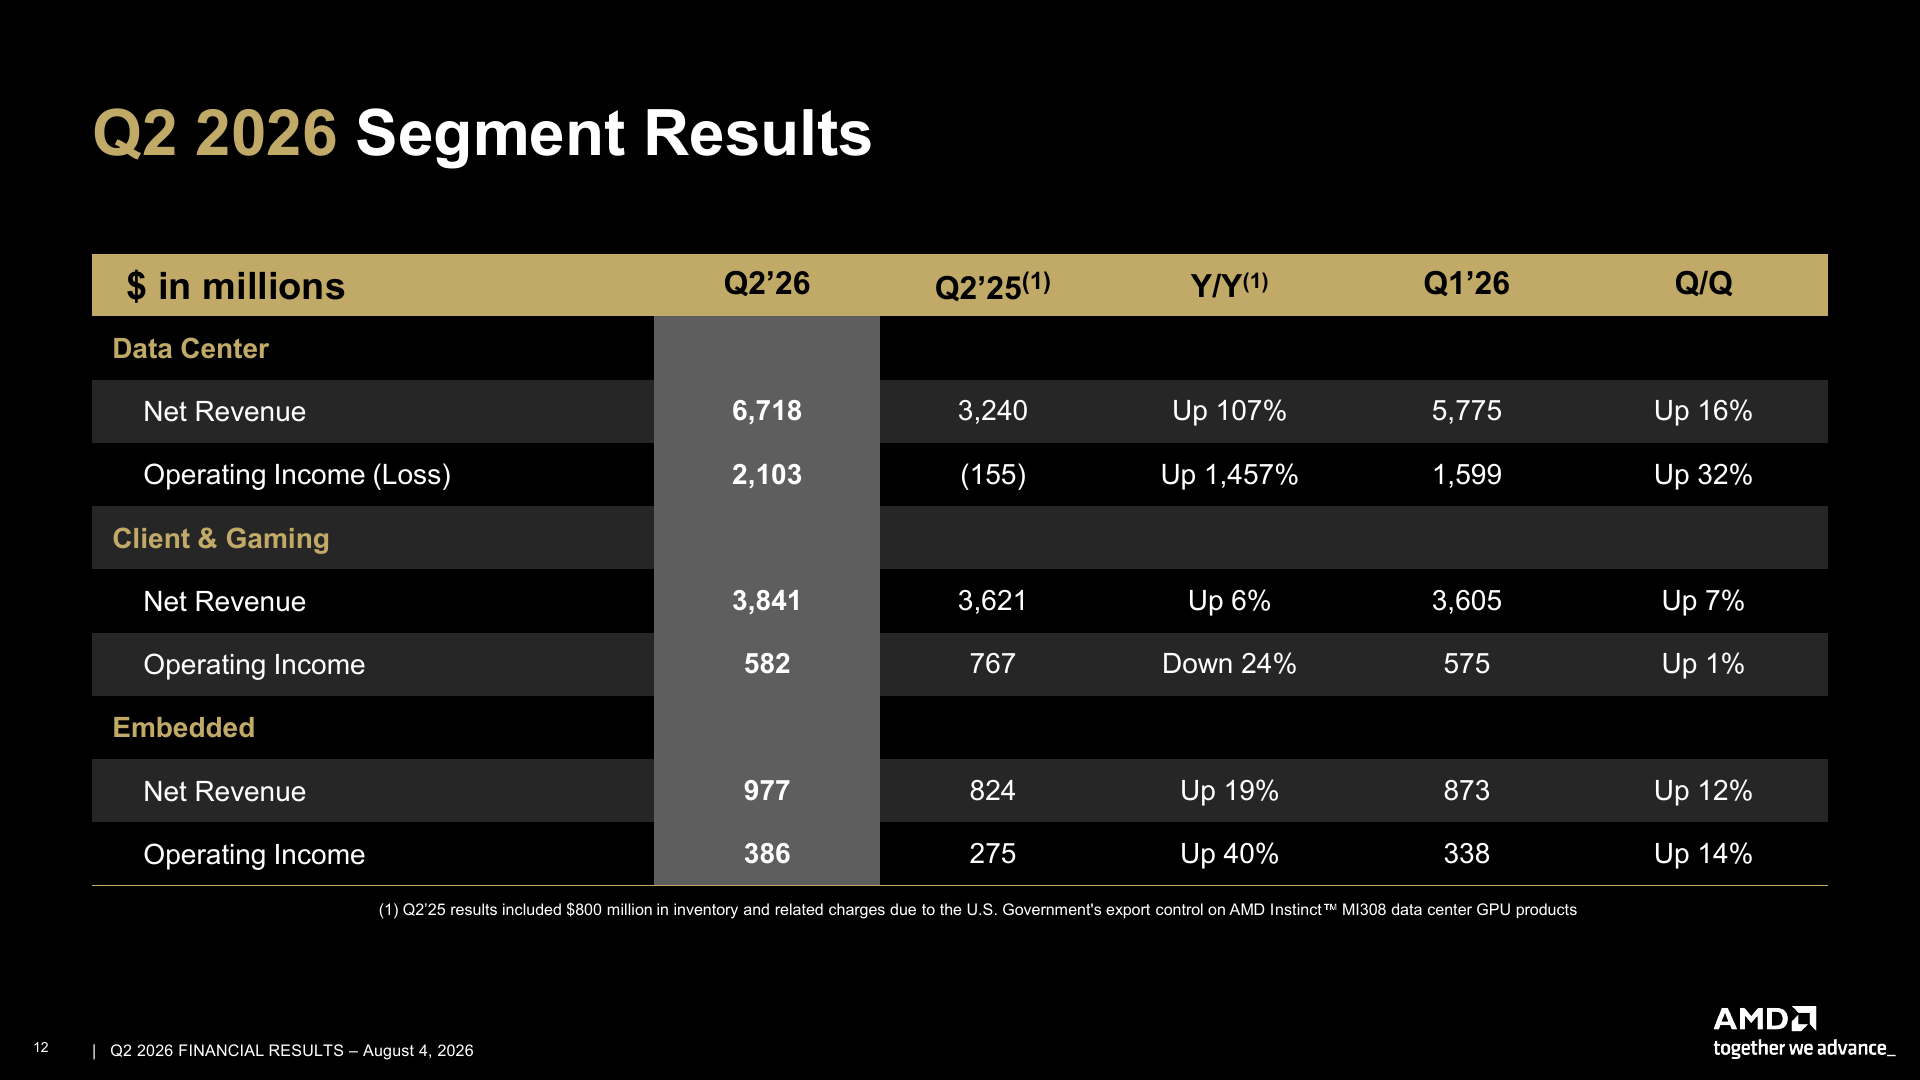
Dividing operating income by revenue gives the 27.7% and 31.3% margins. Data Center also contributed about 90.3% of AMD's year-over-year revenue increase: $3.478B of the company's $3.851B growth. Neither calculation isolates “AI GPU revenue.” The AI revenue guide explains why a segment label matters before a growth rate does.
The $1.081B subtraction is not a cash-payment total
Data Center's $2.103B operating income exceeded AMD's consolidated $1.990B. There is no contradiction. The segment reconciliation includes other businesses and costs excluded from their reported results.
| Q2 operating-income reconciliation | USD millions |
|---|---|
Data Center | 2,103 |
Client and Gaming | 582 |
Embedded | 386 |
All Other | −1,081 |
Consolidated GAAP operating income | 1,990 |
Reported fields from Q2 Form 10-Q, Note 4, filed August 5. “All Other” is not a reportable segment.
Most of All Other was acquisition-related intangible amortization ($544M) and stock-based compensation ($503M). These are accounting expenses, not equivalent same-quarter cash payments. Calling the full $1.081B a cash drain would blur the very distinction this article is trying to make.
That does not make the expenses economically free. It means their consequences should be evaluated on their own terms, rather than deducted again from reported operating cash flow.
Where the cash actually went
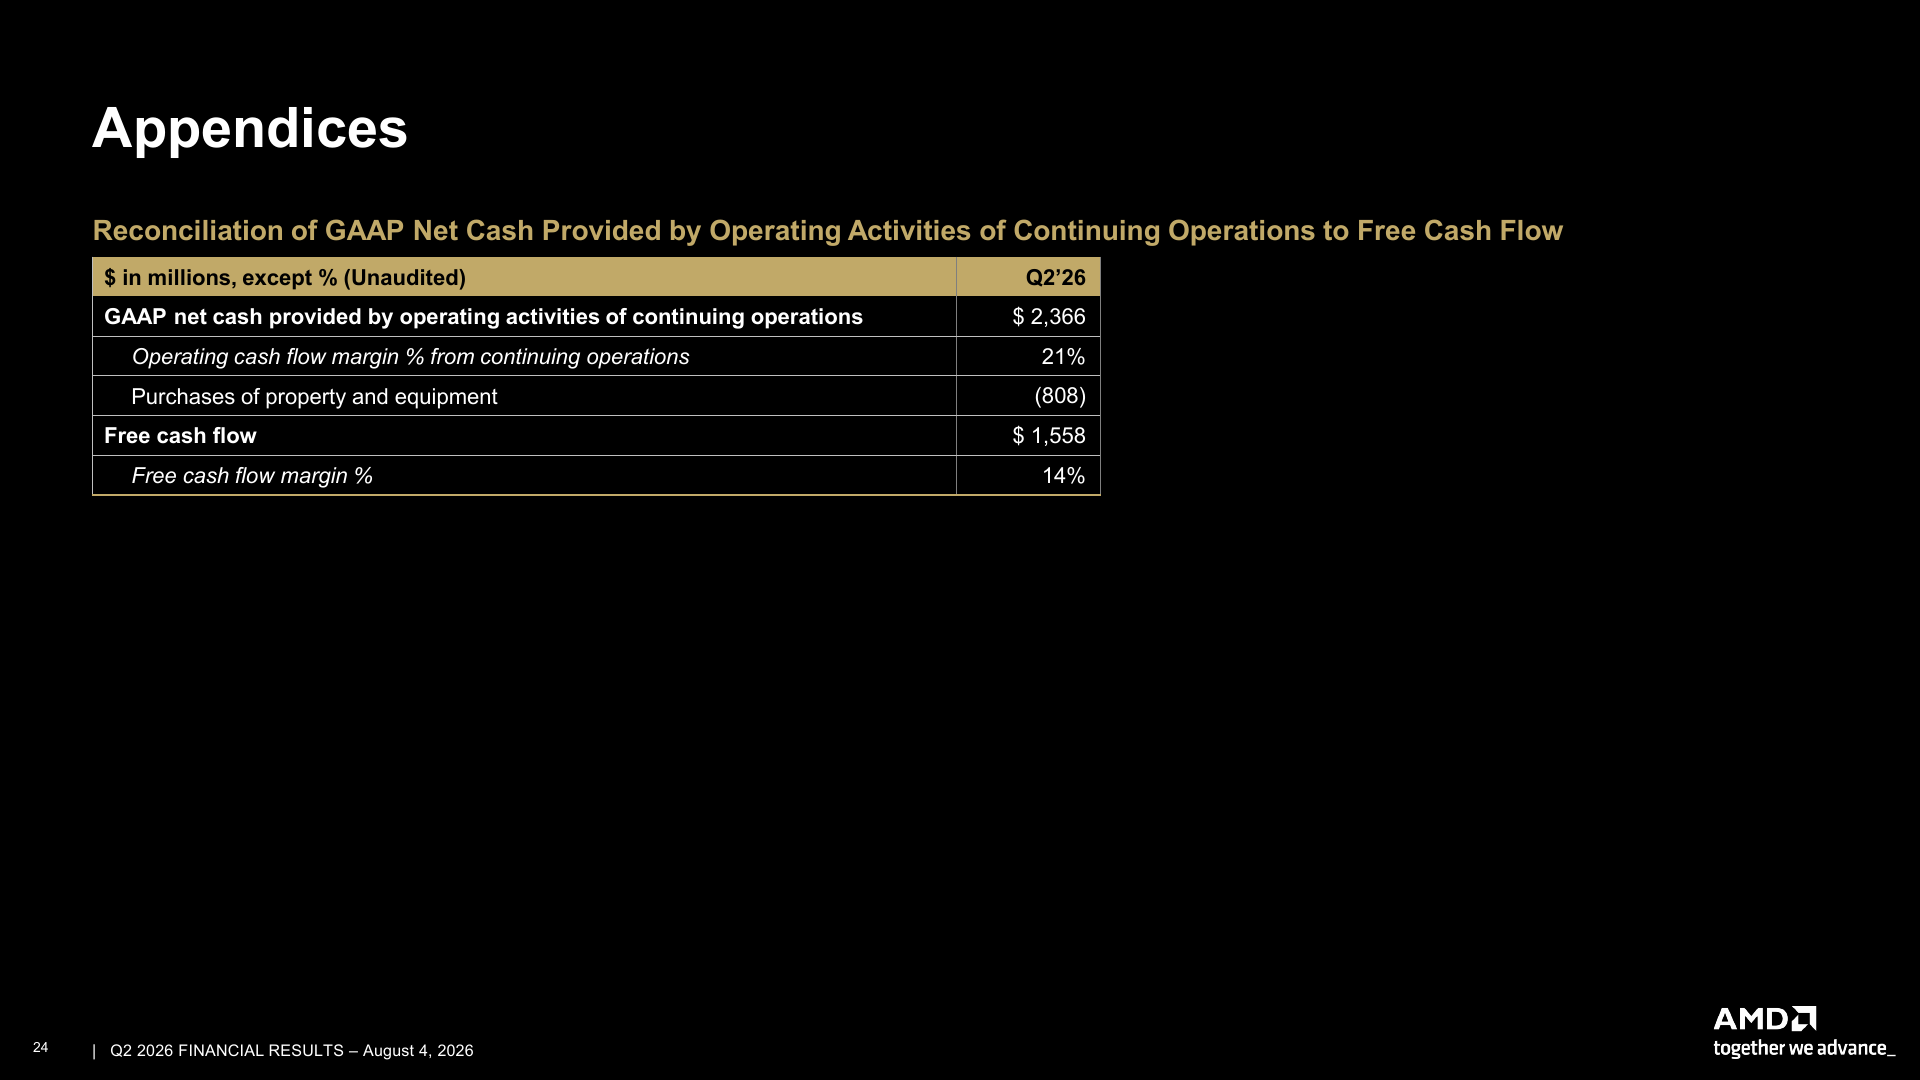
AMD defines free cash flow as operating cash from continuing operations less purchases of property and equipment. Here is its Q2 reconciliation.
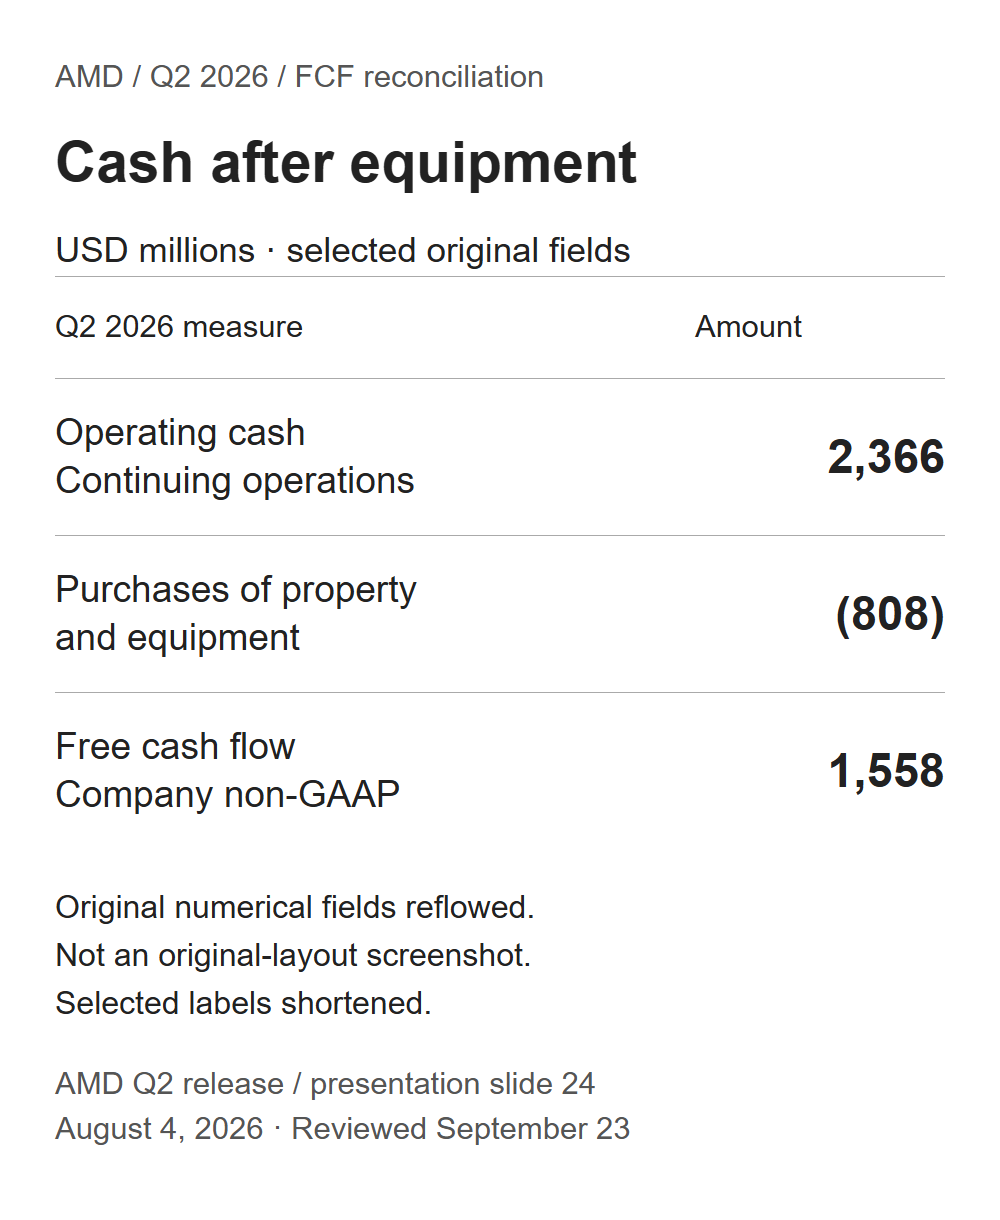
Source-field extract: AMD Q2 presentation, slide 24, August 4, 2026. USD millions; original numerical fields reflowed, selected labels shortened; not an original-layout screenshot. Checked September 23. Source capture: original slide.
The comparison with Q1 identifies two contributors, not just “more investment.”
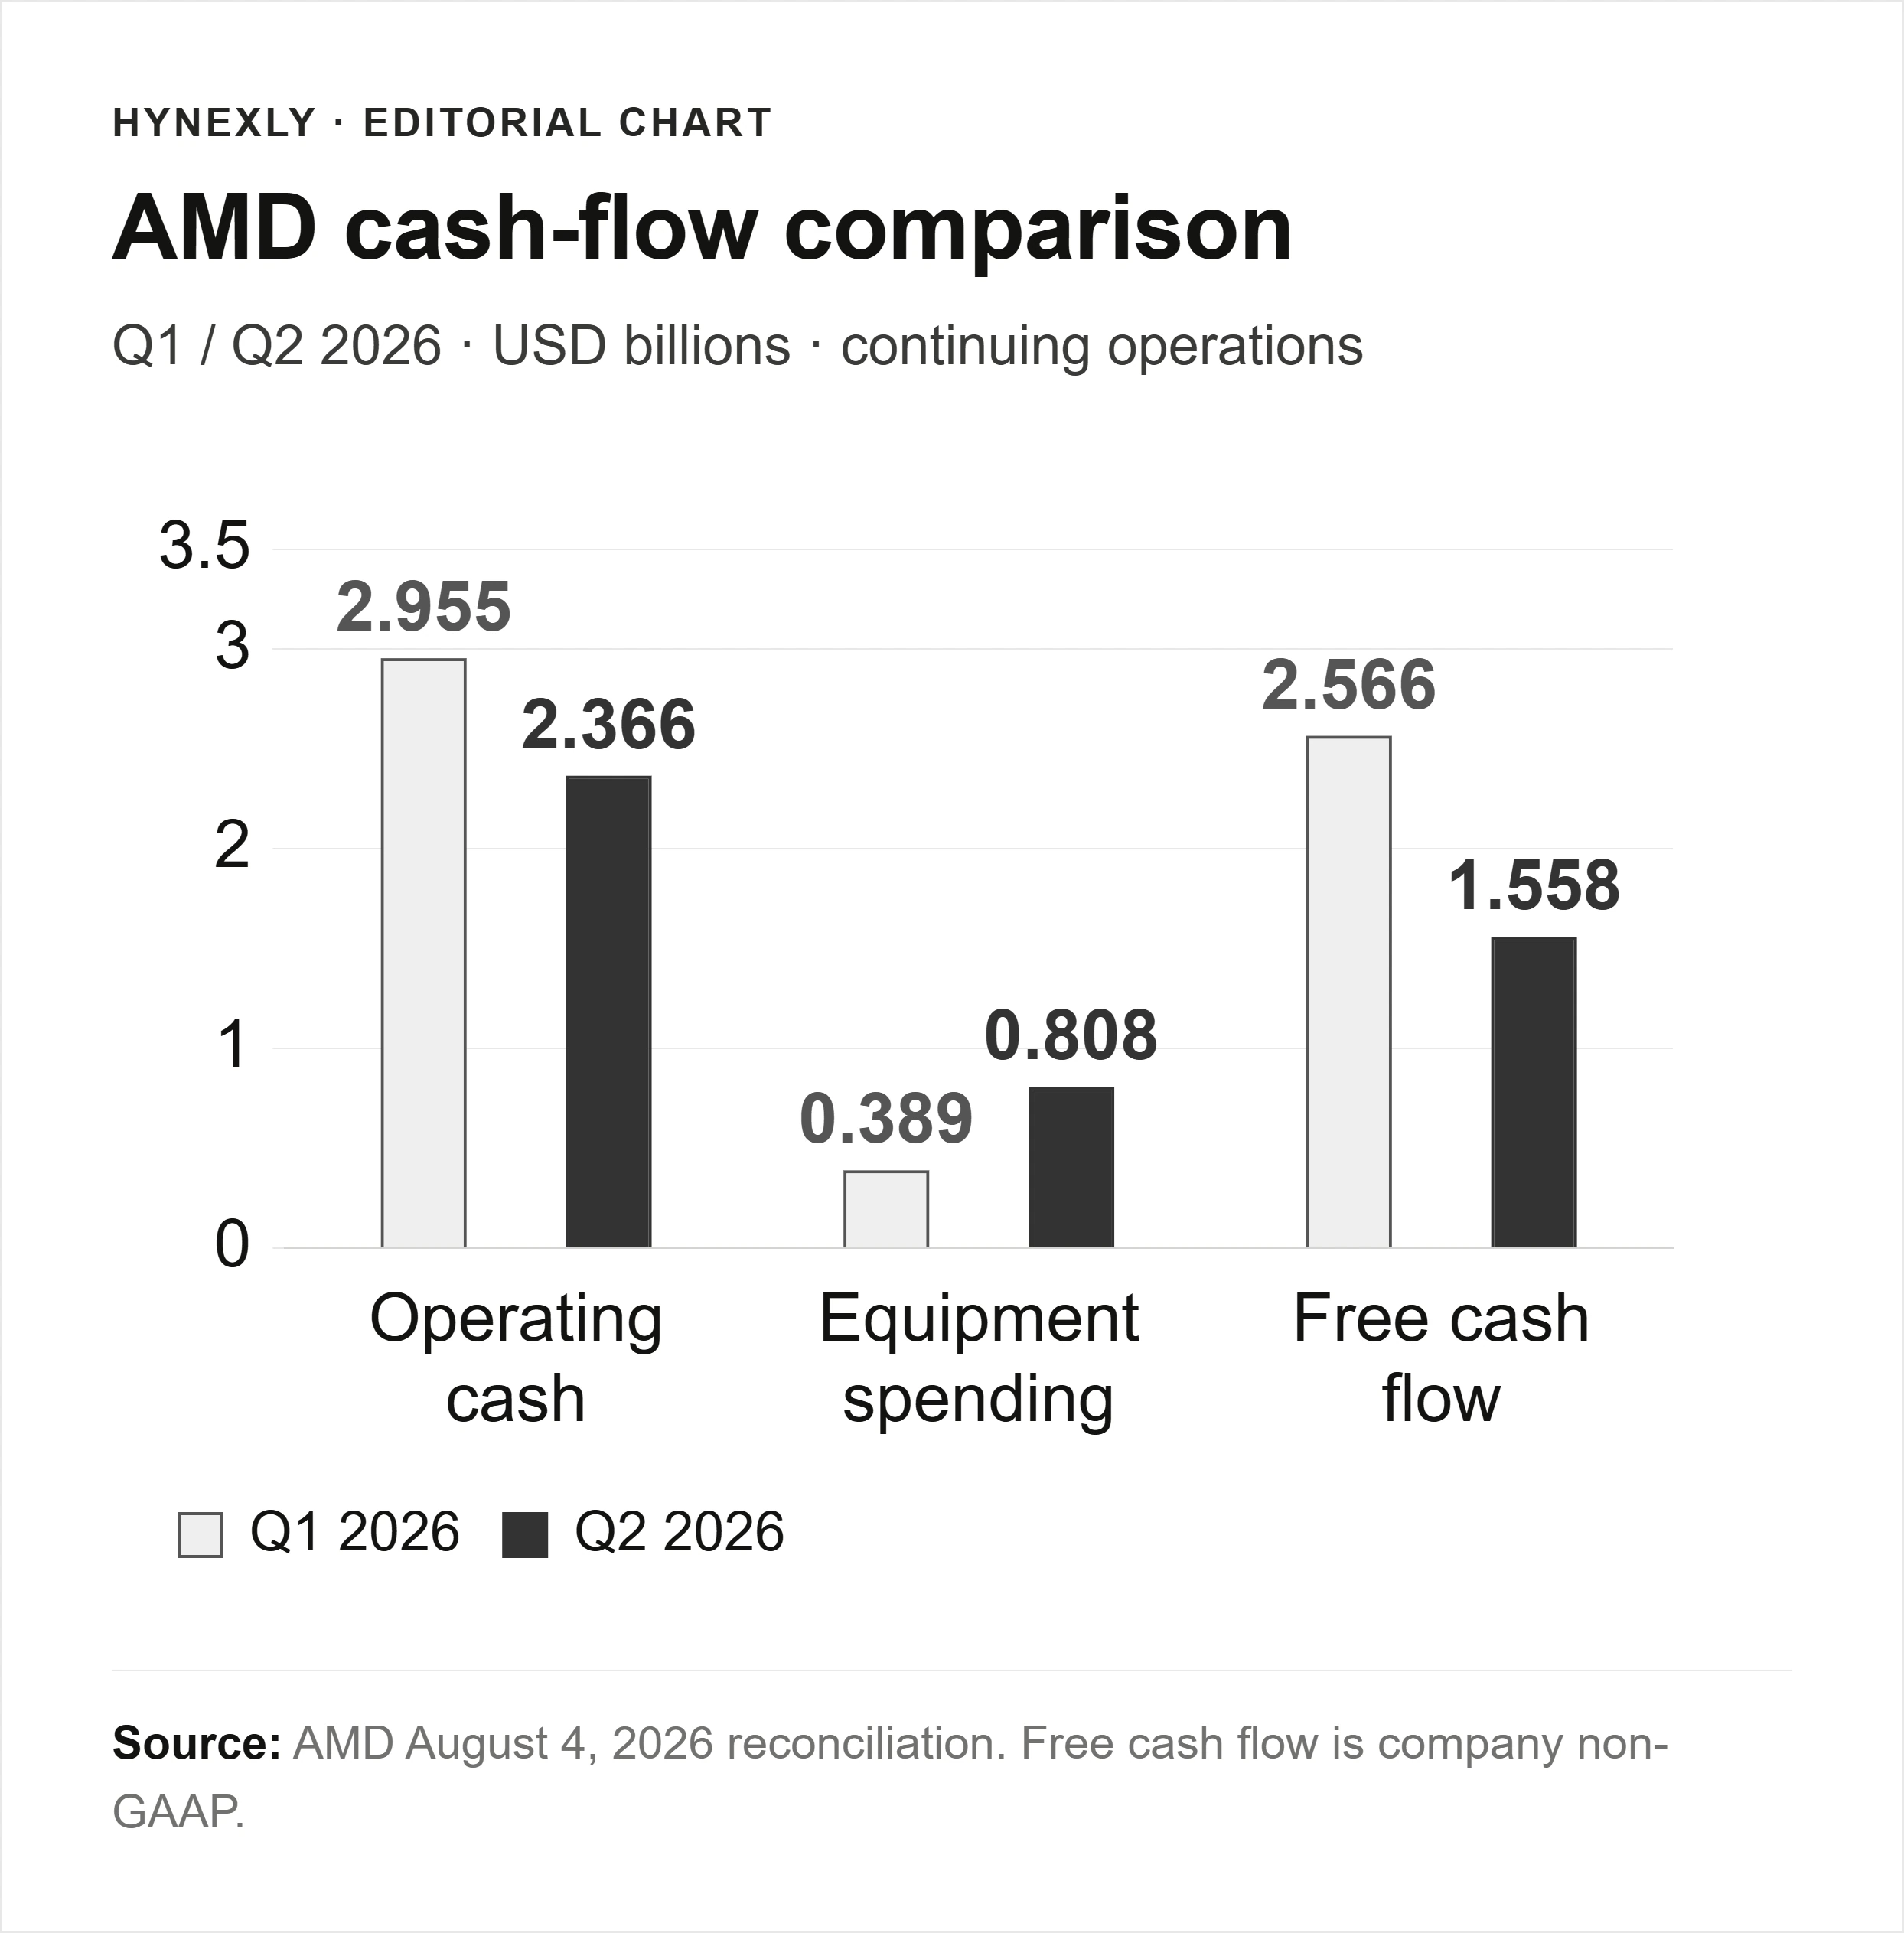
Editorial chart from the Q2 release's cash-flow reconciliation. Continuing operations; free cash flow is AMD-defined non-GAAP. 6 reported values, not a forecast.
Free cash flow declined by $1.008B. Operating cash fell by $589M and equipment spending rose by $419M; those two changes sum exactly to the decline. Equipment spending therefore explains about 41.6% of the reduction, not all of it.
To investigate the operating side, use cash-flow statements rather than changes in balance-sheet balances. AMD's Q2 10-Q supplies 6-month figures; subtracting the Q1 release's cash-flow lines reconstructs the 2nd quarter.
| Cash-flow contribution, USD millions | Q1 | First half | Q2, calculated |
|---|---|---|---|
Accounts receivable | +280 | −966 | −1,246 |
Inventories | −125 | −548 | −423 |
Prepaid expenses and other assets | −308 | −991 | −683 |
Accounts payable | −104 | +2,170 | +2,274 |
Accrued and other liabilities | +713 | +61 | −652 |
Net of these five lines | +456 | −274 | −730 |
Sources: Q2 10-Q cash-flow statement and Q1 release, May 5. Positive adds to operating cash; negative reduces it. Each Q2 field is first half minus Q1, not a balance-sheet subtraction. These five lines are not the whole operating cash-flow statement.
Payables contributed $2.274B, offsetting $3.004B of uses across the other four lines. The 10-Q describes the first-half payable increase primarily in terms of payment timing. Our quarterly arithmetic does not establish overdue bills or deliberate payment stretching.
It does show why the next report's cash-flow detail matters. Collections and payment timing can move in opposite directions while a single headline cash figure conceals both. The Nvidia cash-conversion article uses a related reading method; its different period is not a like-for-like peer ranking.
What the Street is Pricing: a boundary, not a consensus claim
This review did not verify a current share price or analyst consensus. It cannot establish what the market has priced in, or whether AMD is cheap.
The concrete expectation available here is AMD's August 4 outlook. Keep the company's forecast separate from the cash questions this article asks.
| Q3 company guidance | August 4 outlook | What it does not establish |
|---|---|---|
Revenue | $13.0B ± $0.3B | Cash collections; the midpoint is $1.464B above Q2 |
Non-GAAP gross margin | About 56% | Data Center operating margin or free cash flow |
Dated AMD guidance from the Q2 release, not a fresh September consensus.
Risks to the Thesis: the countercase deserves room
The favorable reading is substantial: segment margin improved and Q2 free cash flow remained positive, above the prior-year $1.180B. A sequential decline alongside more equipment spending can accompany expansion. It is not, by itself, evidence that customers are failing to pay.
The caution is equally specific. If operating cash keeps weakening as revenue grows, while payables repeatedly provide a large offset to other working-capital uses, the durability of cash generation needs closer scrutiny. Product mix remains undisclosed, and the prior-year export-control charge still complicates comparisons.
Neither reading justifies stripping out every expense or extrapolating one quarter into a permanent margin.
What Flips the Call: reconcile the next quarter again
The September 23 check of AMD's investor calendar found no announced Q3 results date. The next useful checkpoint is the Q3 release and 10-Q, not an invented calendar deadline.
| What to check | Stronger evidence | Reason to question the thesis |
|---|---|---|
Data Center economics | Profit keeps pace with revenue | Revenue rises but segment margin erodes |
Operating cash | Collections support growth with less reliance on payable timing | Repeated weakness obscured by large payable contributions |
Equipment spending | Cash improves after disclosed investment needs | Spending grows while operating cash weakens further |
Reporting boundaries | Segment costs and cash reconciled separately | A GPU-profit claim inferred from combined segment data |
These are editorial conditions, not AMD guidance, numerical targets or investment ratings.
For now, the finding is narrower and more useful than a pass/fail verdict: AMD demonstrated better combined Data Center profitability. Whether that expansion produces durable cash will take another reconciliation.
Method and review record
Q1 ended March 28 and Q2 ended June 27, 2026. Margins and growth contribution are editorial calculations from reported fields. The cash-flow table reconstructs Q2 from cumulative first-half and standalone Q1 statements; it is not a company-provided quarterly working-capital table. No GPU-only profit, current valuation or normalized earnings estimate is inferred.
The five sources above were reviewed September 23, 2026. This substantive revision separates noncash accounting costs from cash uses and replaces the old binary profit/cash verdict. AI assisted research organization and consistency checks; Hynexly's owner-operated desk retains editorial responsibility. This is general information, not personalized investment advice.
Primary references cited or linked in this analysis. Click through to read each source in full.
Choose the next evidence gap to investigate.
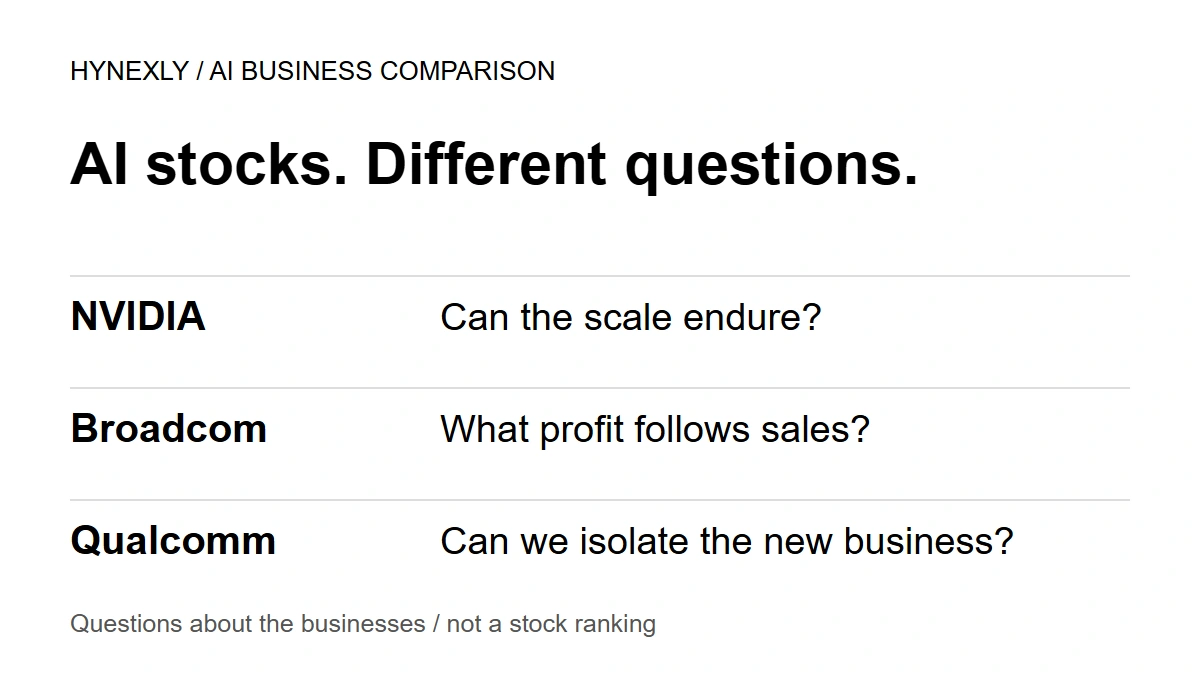
NVIDIA, Broadcom, Qualcomm: What Each AI Business Still Has to Prove
NVIDIA and Broadcom already depend heavily on different AI-related businesses. Qualcomm has real revenue and an Amazon collaboration—but a separate financial ramp to prove.
Owner-operated US market research desk
Owner-operated US stock and market coverage built from public filings, SEC EDGAR, official reports, company releases, and market data.
- Source-grounded research with primary filings & official reports
- Bilingual EN / KO editorial workflow
- Manual editorial QA before publish