Micron has a price floor. That is not the end of the memory cycle.
Micron's customer agreements protect some prices and volumes, not every profit margin. Read the contract limits, cash definitions and longer fourth quarter before extrapolating.
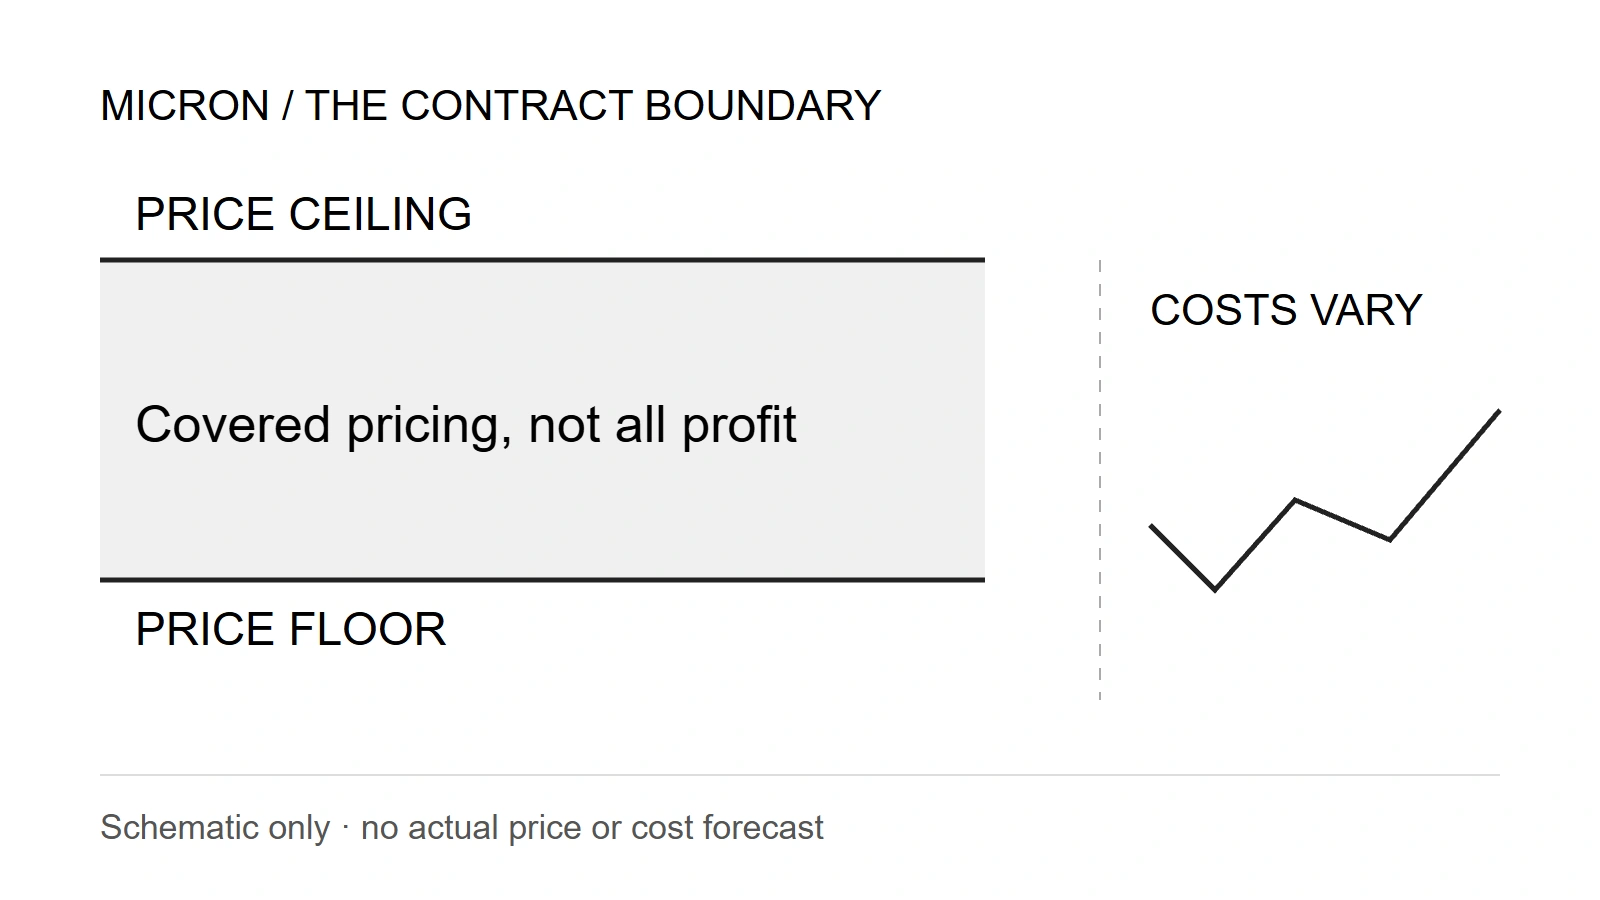
A better contract is not a fixed profit
A customer promises to buy memory for years and accepts a minimum price. It is reasonable to expect a steadier business. It is a bigger leap to expect a steady profit margin.
That is the distinction in Micron's latest reported quarter. The company sells memory and storage chips; its customer agreements can soften parts of a cyclical business. They do not remove the cost of making those chips or the risk of building capacity that earns too little.
The contracts matter. The question is what they cover. This review, dated September 23, 2026, uses the completed third fiscal quarter and the company's fourth-quarter outlook. It is not a report of results that have yet to be released.
Why does the promise look so attractive?
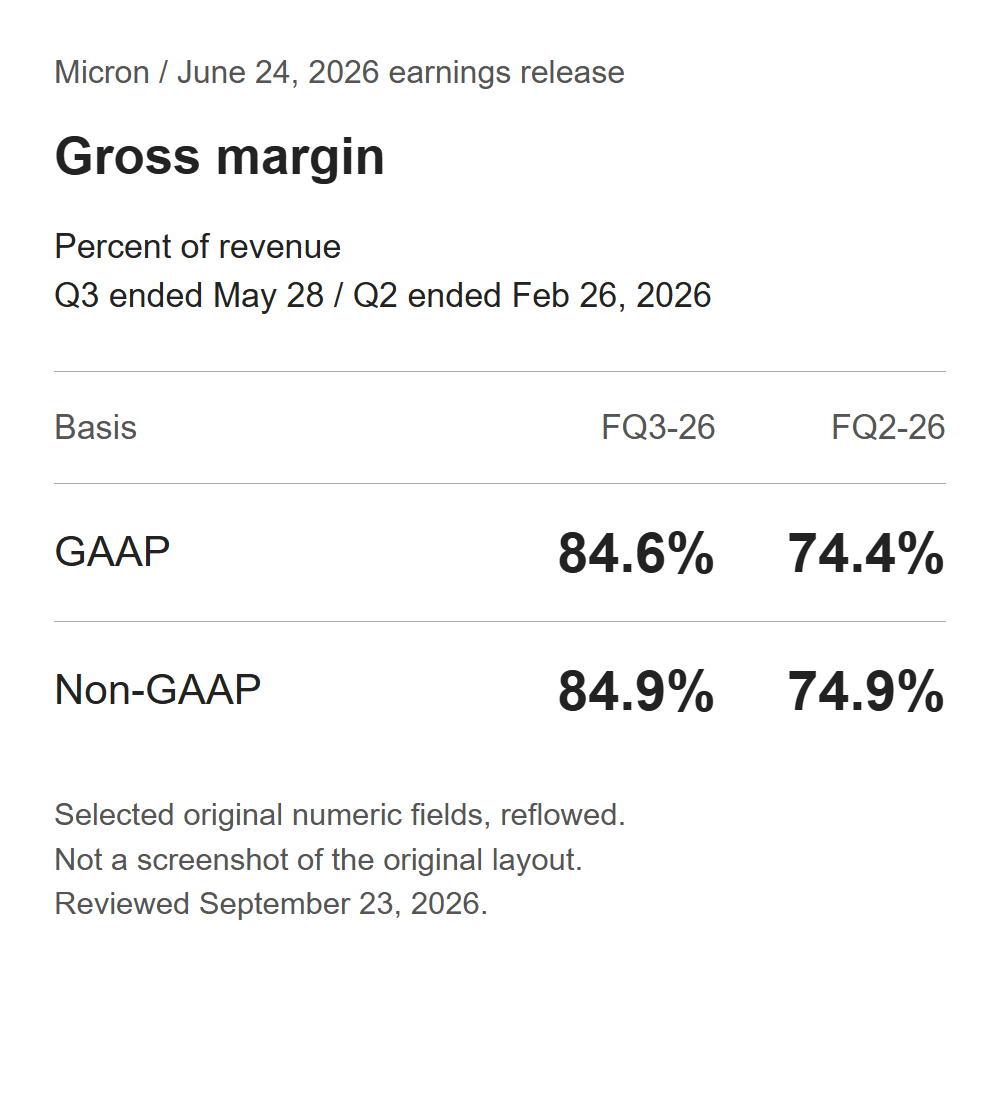
Those are exceptionally high margins. Price did much more work than physical shipment growth: the filing describes large increases in selling prices but only single-digit increases in bits shipped. A bit is a unit of memory capacity, so selling more expensive capacity and shipping more capacity are not the same explanation.
This makes the contract question worth asking. If today's economics depend heavily on pricing, keeping a minimum price in future periods could be valuable. But the past quarter cannot tell us how much of tomorrow's company-wide profit will be protected.
The useful comparison is not “contracts or no contracts.” It is the covered business under its actual terms versus the rest of the business.
What does the floor actually protect?
| Contract feature | What it can protect | What it does not establish |
|---|---|---|
Binding volume commitment | Purchases of the agreed quantity | Unlimited demand for other output |
Minimum price in a pricing band | Covered selling price below that boundary | A fixed production cost |
Maximum price in that band | Customer visibility into covered prices | Unlimited supplier participation in rising spot prices |
The 10-Q describes different arrangements, including a minority without fixed prices or bands. Treating every agreement as the same contract would overstate the protection.
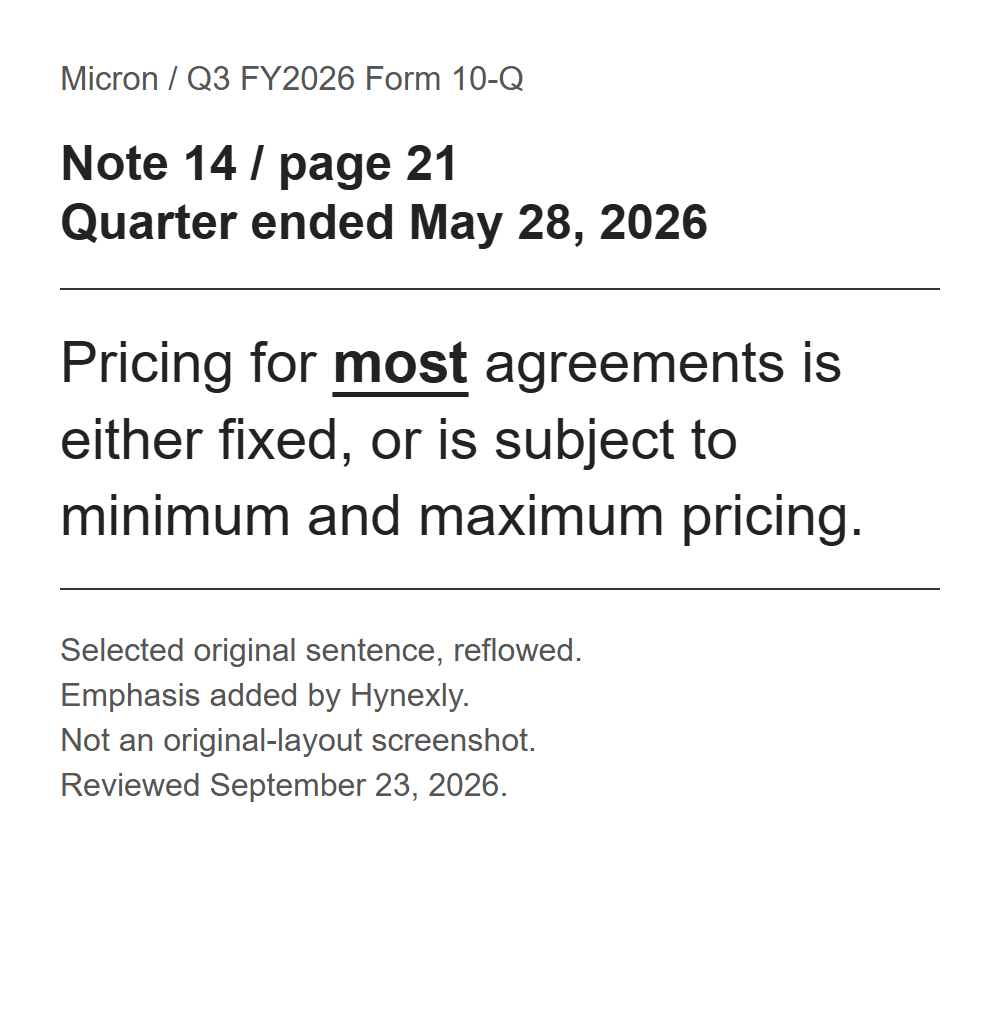
For the largest agreements, Micron generally describes ceilings on existing products near calendar Q2 market prices, with floors over the term. That trades some participation in rising prices for protection on the downside. The company expects strong margins even at the floors; that is management's expectation, not a contractual guarantee of a consolidated margin.
A price can be fixed while the cost of producing the item changes. Product mix, manufacturing efficiency and investment demands can change too. A durable profit claim therefore needs evidence about both sides of the margin, not just the selling-price clause.
Is committed money the same as earned money?
No. The revenue note and liquidity discussion refer to different dates and accounting concepts.
| Disclosed amount | Basis | Why it is not current earnings |
|---|---|---|
About $5B of remaining performance obligations | May 28; specified future contract obligations | Performance and revenue recognition remain ahead |
$422M of recognized contract liabilities | Within that quarter-end disclosure | Primarily deposits associated with revenue not yet recognized |
Expected $22B of deposits and related commitments, including about $18B of cash deposits | Agreements concluded by the filing discussion, including after quarter-end | A funding expectation, not cash already received or profit |
The remaining-performance-obligation disclosure is narrower than all potential contract sales. Its exclusions and minimum-price basis matter. It is not a ready-made forecast of the company's revenue.
Nor can the later deposit projection be subtracted from the quarter-end obligation figure to discover “extra sales.” The amounts do different jobs. One concerns future performance; another concerns how customers help fund the relationship. The dates differ as well.
This distinction is especially useful when a company announces several large contract numbers together. Ask what has been delivered, what has been paid, and what remains conditional before adding anything.
The next quarter has an extra week
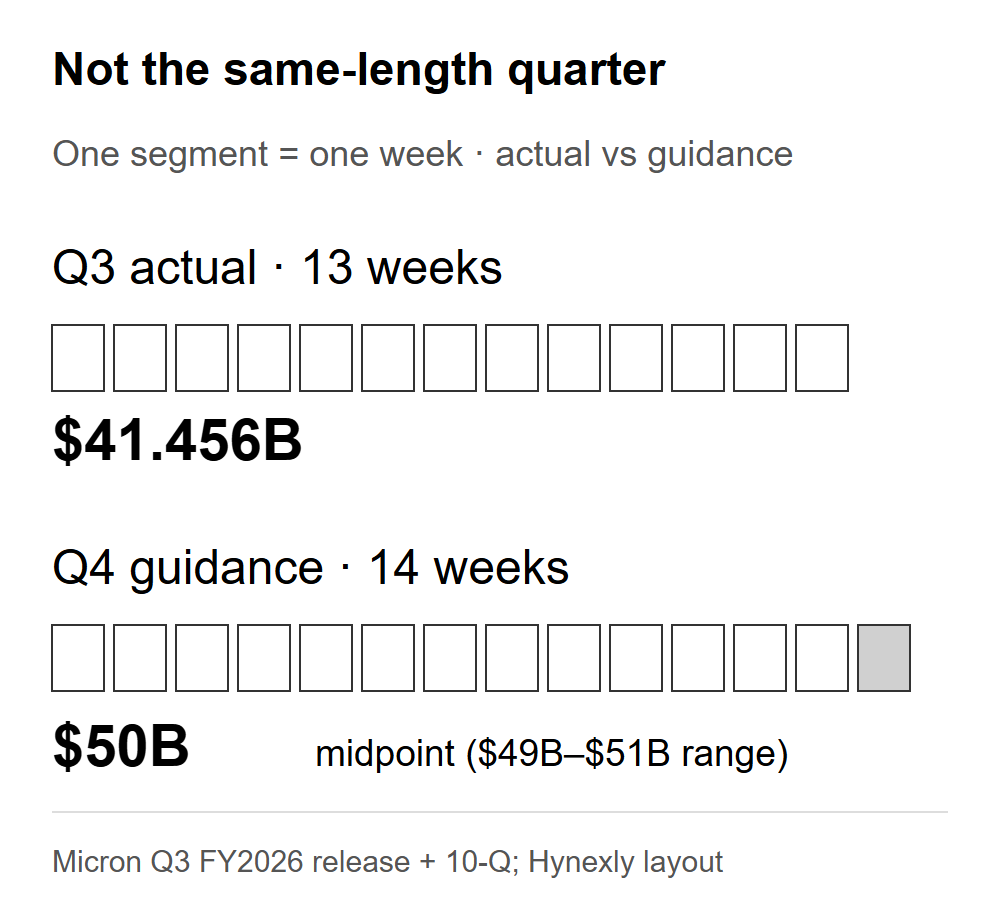
Micron's Q4 outlook gives a revenue range of $49B–$51B and approximately 86% gross margin on both GAAP and non-GAAP bases. But the fiscal calendar gives Q4 more time to earn that revenue.
| Comparison using the guidance midpoint | Calculation | Result |
|---|---|---|
Total revenue | 50 / 41.456 − 1 | 20.6% |
Revenue per fiscal week | (50 / 14) / (41.456 / 13) − 1 | 12.0% |
The adjusted comparison is still growth. The point is not to explain it away; it is to avoid attributing the entire headline increase to stronger demand or better pricing.
Dividing by weeks is only arithmetic. Shipments need not arrive evenly, and mix can change during a quarter. The calculation is neither management's weekly guidance nor an estimate of organic growth. It simply makes the unequal reporting periods visible.
What would a stronger investment case need?
There is no current share-price valuation or analyst-consensus estimate in this review. It cannot establish what the market has already priced in.
The stronger case would need contracts to translate into durable economics through a less favorable pricing environment. A high margin during scarcity is evidence of present profitability. It is not, by itself, evidence of how the same factories and contracts behave when customers have more alternatives.
The distinction also appears in Nvidia's cash-flow baseline: an excellent reported period can be real without being a permanent run rate. Different companies, same extrapolation problem.
Capacity still has to earn its cost
Micron reported $18.304B of adjusted free cash flow after net capital investment in Q3. That is substantial room to fund expansion, but it is a company-defined measure, not a promise about the return from future factories.
| Q3 cash calculation | Amount |
|---|---|
Operating cash | $25.388B |
Less net capital investment | −$7.084B |
Adjusted free cash flow | $18.304B |
Net investment already includes asset-sale proceeds and government incentives. Subtracting those benefits again would double-count them. These are the company's non-GAAP net-investment and adjusted-FCF definitions in the release reconciliation.
The company expected about $27B of net capital expenditure for the fiscal year. More protected revenue can support that commitment. It cannot prove that every additional unit of capacity will meet attractive demand throughout its life.
A contract story becomes weaker if readers use the existence of floors as a reason to stop checking costs, customer terms or spending.
What would change the conclusion?
| Next evidence | A stronger durability case | A weaker durability case |
|---|---|---|
Covered contract economics | Profitability holds as market pricing changes | Costs or unfavorable terms erode the protection |
Price, volume and mix | Growth remains understandable after calendar effects | Headline growth conceals weaker underlying economics |
Cash and capacity investment | Cash generation supports the build | Funding needs outrun internally generated cash |
The next scheduled results call is September 30, 2026. These are reading tests for that report, not trading triggers or claims that the outcome is already known.
Micron may have made its cycle less punishing. That would be a meaningful improvement. It is still different from ending the cycle.
For another boundary that matters in this industry, the SK hynix ADR analysis separates access to a security from improvement in the underlying business.
Method and disclosure
Hynexly checked the cited issuer figures and recalculated the calendar comparison using unrounded inputs. Dollar amounts use B for billions and M for millions. The visual contract band is schematic; it contains no invented price path.
This September 23 refresh removes the dated trading-activity hook and replaces migrated IR links with accessible official sources. AI assisted research organization, drafting, language editing and deterministic visuals. Source and arithmetic checks were performed in this workflow; no independent human review is claimed. No Micron sponsorship or affiliate relationship has been declared, and the author's personal holdings were not verified here. This is general information, not personalized investment advice.
Primary references cited or linked in this analysis. Click through to read each source in full.
Choose the next evidence gap to investigate.
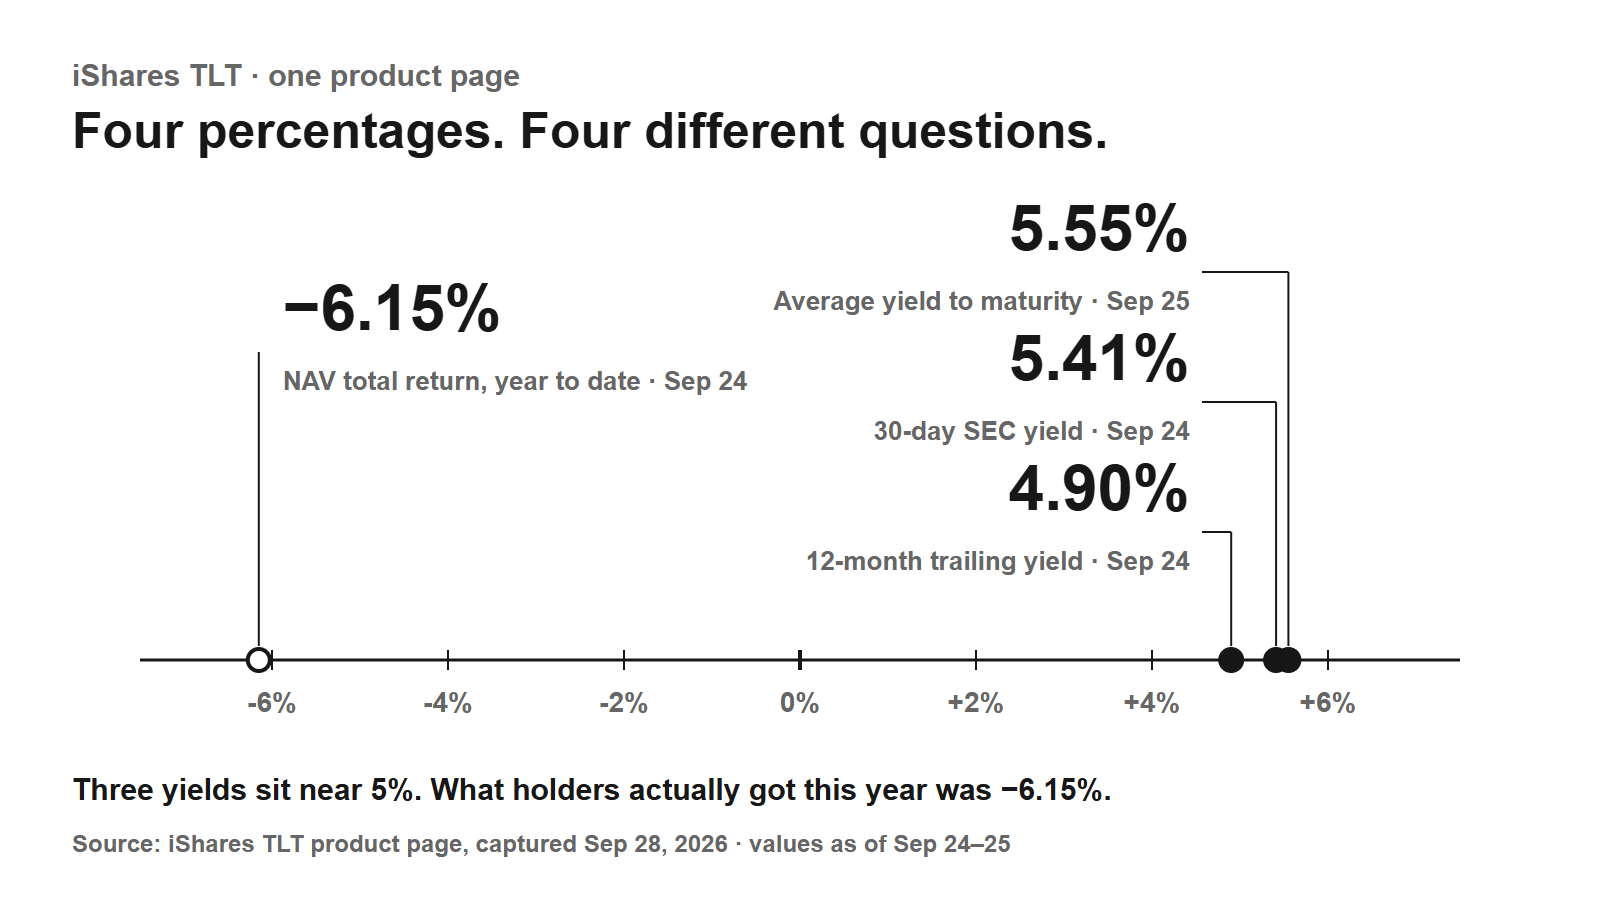
One ETF Page, Four Percentages: What SEC Yield, Trailing Yield, YTM and Total Return Each Answer
On September 24, TLT showed a 5.41% SEC yield, a 4.90% trailing yield and a −6.15% year-to-date total return. What each number measures, why they differ, and the calculation that ties yield to rate risk.
Owner-operated US market research desk
Owner-operated US stock and market coverage built from public filings, SEC EDGAR, official reports, company releases, and market data.
- Source-grounded research with primary filings & official reports
- Bilingual EN / KO editorial workflow
- Manual editorial QA before publish